Liquid Ring Vacuum Pump Market Analysis, Size, and Forecast 2026-2030: APAC (China, India, and Japan), Europe (Germany, France, and UK), North America (US, Canada, and Mexico), Middle East and Africa (Saudi Arabia, UAE, and South Africa), South America (Brazil, Argentina, and Colombia), and Rest of World (ROW)

Liquid Ring Vacuum Pump Market Analysis, Size, and Forecast 2026-2030:
APAC (China, India, and Japan), Europe (Germany, France, and UK), North America (US, Canada, and Mexico), Middle East and Africa (Saudi Arabia, UAE, and South Africa), South America (Brazil, Argentina, and Colombia), and Rest of World (ROW)

Published: Jan 2026 295 Pages SKU: IRTNTR81237

Market Overview at a Glance

$515.7 Mn
Market Opportunity
5.1%
CAGR 2025 - 2030
49.7%
APAC Growth
$1.40 B
Single stage segment 2024

Liquid Ring Vacuum Pump Market Size 2026-2030

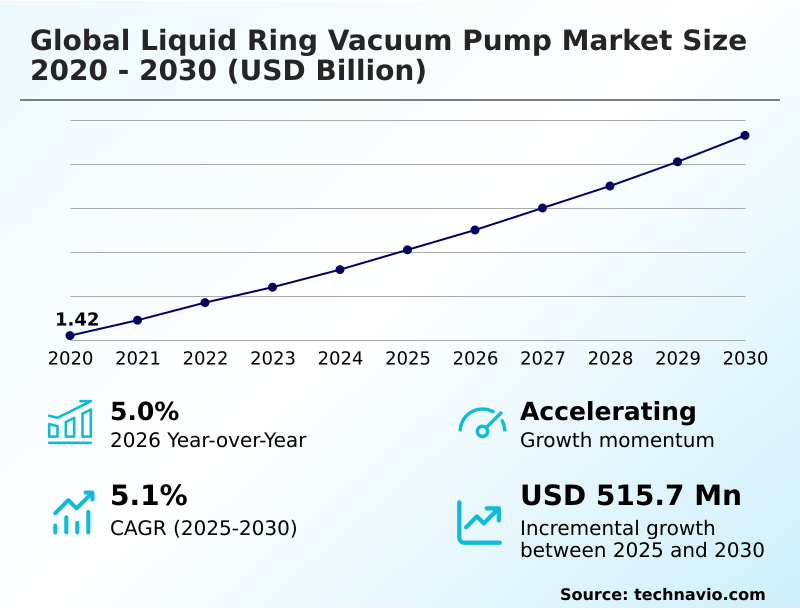
The liquid ring vacuum pump market size is valued to increase by USD 515.7 million, at a CAGR of 5.1% from 2025 to 2030. Expansion of chemical and petrochemical industries will drive the liquid ring vacuum pump market.

Major Market Trends & Insights

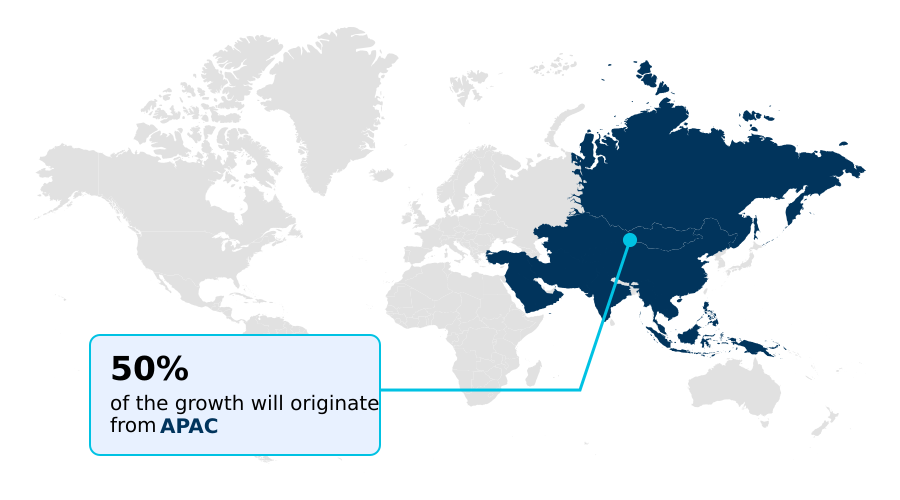
  • APAC dominated the market and accounted for a 49.7% growth during the forecast period.
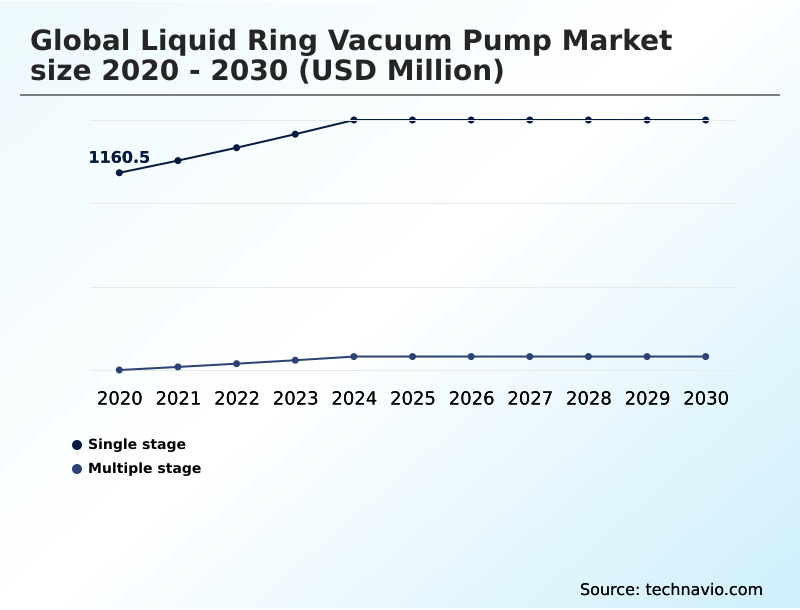
  • By Type - Single stage segment was valued at USD 1.40 billion in 2024
  • By Material - Stainless steel segment accounted for the largest market revenue share in 2024

Market Size & Forecast

  • Market Opportunities: USD 902.1 million
  • Market Future Opportunities: USD 515.7 million
  • CAGR from 2025 to 2030 : 5.1%

Market Summary

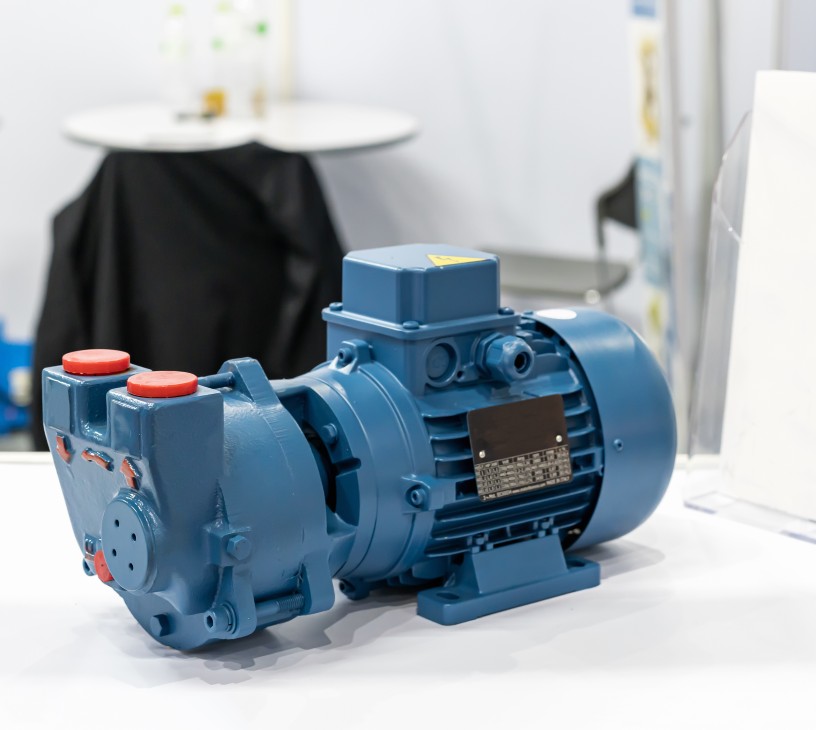
  • The liquid ring vacuum pump market is defined by its indispensable role in heavy process industries, where its unique isothermal compression capability provides a distinct safety advantage. This technology is crucial for applications requiring wet gas handling and the safe compression of explosive gases, making it a mainstay in chemical processing and power generation.
  • A key driver is the expansion of industrial infrastructure, particularly in regions undergoing rapid development. Concurrently, a prominent trend is the integration of IIoT predictive maintenance to improve equipment reliability and prevent unplanned downtime.
  • For instance, a chemical facility can deploy a solvent-sealed system for vapor recovery, not only achieving environmental compliance but also improving product purity standards by over 10%. However, the market faces challenges from the growing adoption of dry vacuum technologies, which offer benefits related to water stewardship and lower operational expenditure.
  • The ongoing focus on energy efficiency optimization continues to shape product development and innovation strategies.

What will be the Size of the Liquid Ring Vacuum Pump Market during the forecast period?

Get Key Insights on Market Forecast (PDF) Request Free Sample

How is the Liquid Ring Vacuum Pump Market Segmented?

The liquid ring vacuum pump industry research report provides comprehensive data (region-wise segment analysis), with forecasts and estimates in "USD million" for the period 2026-2030, as well as historical data from 2020-2024 for the following segments.

  • Type
    • Single stage
    • Multiple stage
  • Material
    • Stainless steel
    • Cast iron
    • Others
  • End-user
    • Chemical processing
    • Oil and gas
    • Power generation
    • Paper and pulp
    • Others
  • Geography
    • APAC
      • China
      • India
      • Japan
    • Europe
      • Germany
      • France
      • UK
    • North America
      • US
      • Canada
      • Mexico
    • Middle East and Africa
      • Saudi Arabia
      • UAE
      • South Africa
    • South America
      • Brazil
      • Argentina
      • Colombia
    • Rest of World (ROW)

By Type Insights

The single stage segment is estimated to witness significant growth during the forecast period.

The liquid ring vacuum pump market is segmented by offerings such as single-stage and multi-stage configurations. The single-stage pump design remains a foundational technology, engineered for applications where high volumetric flow is prioritized over deep vacuum levels.

Its mechanism relies on isothermal compression, a critical feature for processes involving heat-sensitive materials, which mitigates the risk of thermal degradation. This design provides exceptional liquid carryover tolerance, making it ideal for paper dewatering applications and vacuum filtration processes.

The operational resilience and straightforward maintenance of these units help reduce total cost of ownership.

In certain scenarios, these pumps can deliver up to 15% higher volumetric flow rates than multi-stage counterparts, enhancing production throughput and ensuring process stability without incurring high operational expenditure.

Request Free Sample

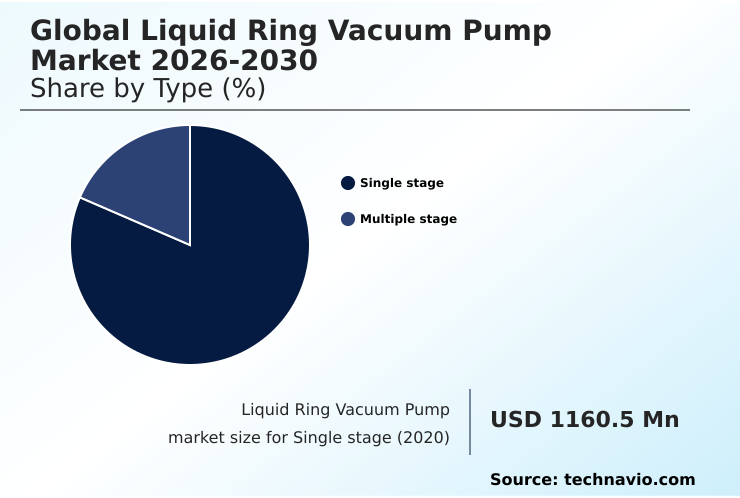
The Single stage segment was valued at USD 1.40 billion in 2024 and showed a gradual increase during the forecast period.

Request Free Sample

Regional Analysis

APAC is estimated to contribute 49.7% to the growth of the global market during the forecast period.Technavio’s analysts have elaborately explained the regional trends and drivers that shape the market during the forecast period.

See How Liquid Ring Vacuum Pump Market Demand is Rising in APAC Request Free Sample

The geographic landscape of the liquid ring vacuum pump market is led by APAC, which accounts for nearly 50% of the market's incremental growth, driven by rapid industrialization in China and India.

In these regions, demand is fueled by the expansion of chemical, power generation, and manufacturing sectors.

In contrast, the mature markets of Europe and North America focus on retrofitting existing infrastructure to meet stringent wastewater discharge regulations and corporate sustainability goals.

The market in Europe, for instance, shows a strong preference for engineered systems that align with industrial water stewardship directives, reducing freshwater consumption by over 30% in some cases.

North America sees continued investment in vapor recovery units to achieve environmental compliance, ensuring process stability in oil and gas operations.

Market Dynamics

Our researchers analyzed the data with 2025 as the base year, along with the key drivers, trends, and challenges. A holistic analysis of drivers will help companies refine their marketing strategies to gain a competitive advantage.

  • The global liquid ring vacuum pump market 2026-2030 is evolving as end-users increasingly scrutinize the efficiency of liquid ring vs dry screw pump systems. While dry pumps offer advantages in certain applications, the liquid ring pump for chemical processing remains critical due to its inherent safety and robustness.
  • The adoption of a liquid ring pump for power generation, particularly for condenser exhaustion, is vital for maintaining plant efficiency. Similarly, its use as a vacuum pump for paper machine dewatering highlights its superior liquid handling capabilities.
  • Demand for stainless steel liquid ring vacuum pumps is growing in corrosive environments, though cast iron liquid ring vacuum pump uses persist in general industrial settings. Key innovations are centered on reducing the energy consumption of vacuum pumps and preventing cavitation in liquid ring pumps.
  • Specialized applications are also emerging, such as the use of a liquid ring pump for hydrogen compression. The development of custom-engineered hybrid vacuum systems, which often combine a liquid ring pump with other technologies, offers optimized performance for high-vacuum applications. Modern systems can improve solvent recovery rates by more than 15% compared to legacy equipment.
  • Furthermore, the integration of a liquid ring compressor for flare gas recovery and within a vapor recovery unit with a liquid ring pump helps operators meet emission targets. The benefits of solvent-sealed liquid ring pump technology, including waste reduction and product recovery, are driving its adoption, particularly in two-stage pump for high vacuum applications.

What are the key market drivers leading to the rise in the adoption of Liquid Ring Vacuum Pump Industry?

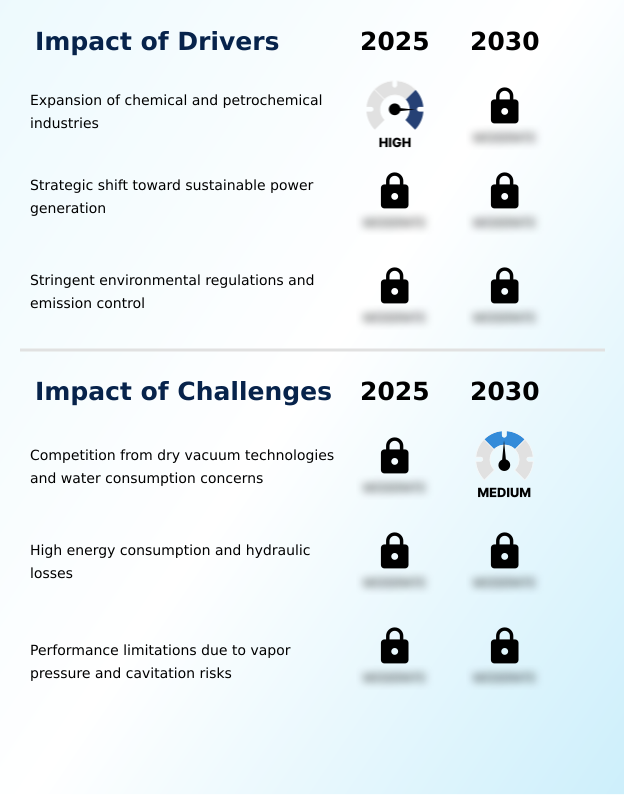
  • The expansion of chemical and petrochemical industries serves as a key driver for the global liquid ring vacuum pump market.

  • Market growth is fundamentally driven by expansion in the chemical, petrochemical, and power generation sectors. The inherent safety of isothermal compression makes these pumps the preferred choice for handling volatile and explosive materials, ensuring process stability.
  • In the power sector, their role in condenser exhaustion is critical for maintaining plant thermal efficiency, directly impacting output.
  • The expansion of geothermal energy provides a new growth avenue, as these pumps are well-suited to handle the corrosive, non-condensable gases found in geothermal steam.
  • Furthermore, stringent environmental regulations are fueling demand for vapor recovery units, where liquid ring pumps enable compliance and can recover valuable raw materials, offering a return on investment within 24-36 months in some cases.

What are the market trends shaping the Liquid Ring Vacuum Pump Industry?

  • The accelerated adoption of hybrid vacuum systems is a key upcoming trend in the market. This development is reshaping operational strategies across various industrial sectors.

  • Key market trends are centered on enhancing efficiency and sustainability. The accelerated adoption of hybrid vacuum systems, which combine liquid ring pumps with other technologies, allows operators to achieve deeper vacuum levels while reducing utility consumption by over 20% compared to traditional setups. This approach is gaining traction in refining and chemical processing.
  • Concurrently, the shift toward closed-loop recirculation and solvent-sealed systems is driven by industrial water stewardship mandates, with some facilities cutting freshwater intake by as much as 40%. The integration of IIoT for predictive maintenance is also transforming the industry, with asset monitoring suites now capable of predicting cavitation events, thereby preventing costly equipment failure and enhancing overall equipment reliability.

What challenges does the Liquid Ring Vacuum Pump Industry face during its growth?

  • Intensifying competition from dry vacuum technologies, alongside persistent concerns regarding water consumption, presents a key challenge affecting the industry's growth trajectory.

  • The market faces significant challenges from competing technologies and inherent operational limitations. The primary challenge is the competition from dry vacuum technologies, which eliminate concerns over water consumption and wastewater discharge regulations. This is a critical factor for industries where product purity standards are paramount.
  • Another key issue is the higher energy consumption stemming from hydraulic loss, which can make the total cost of ownership less competitive, especially as energy prices rise. The performance of these pumps is also constrained by vapor pressure limitations, which can lead to cavitation and mechanical damage.
  • This vulnerability requires additional cooling systems, increasing capital expenditure by 15-20% and complexity for end-users, particularly in high-temperature environments.

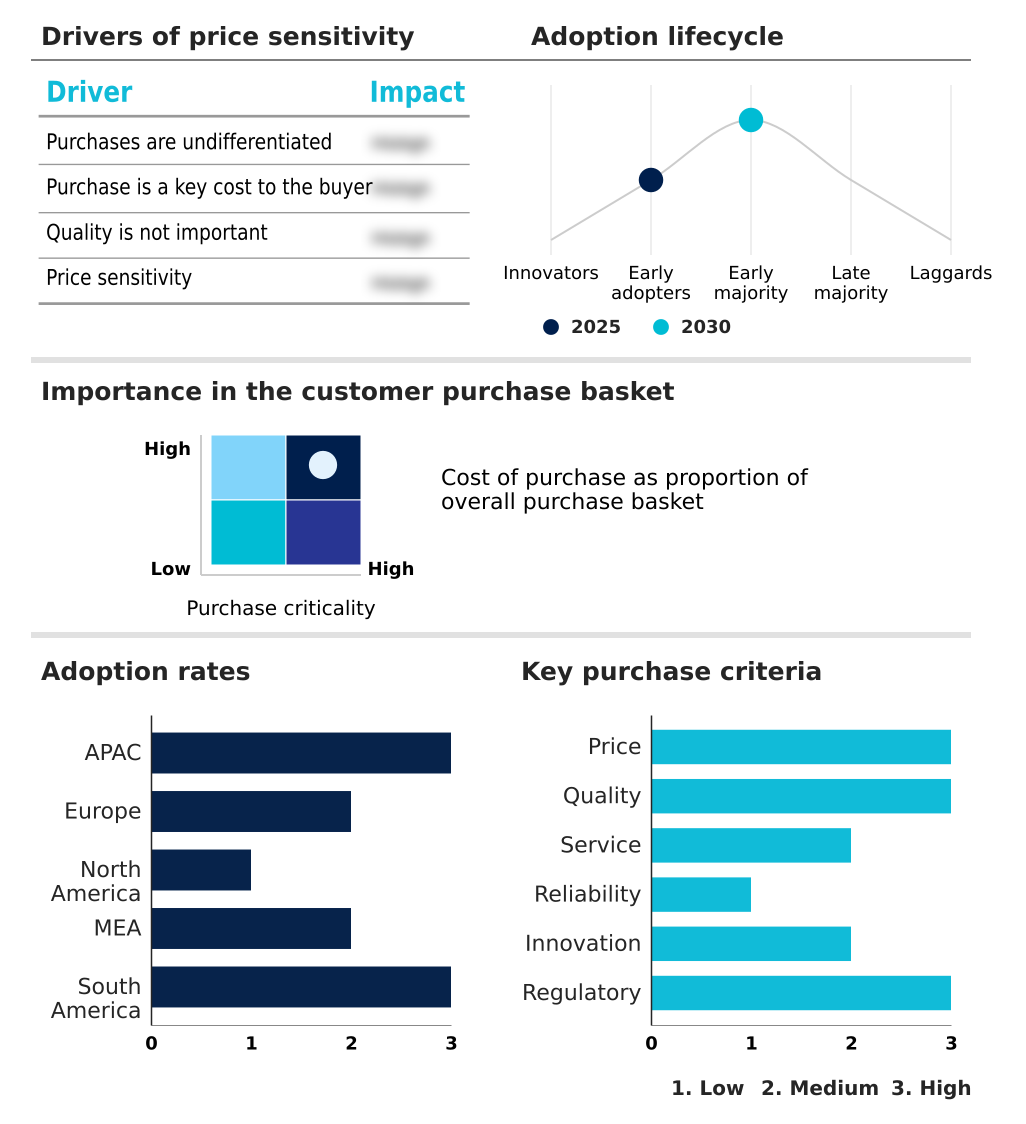
Exclusive Technavio Analysis on Customer Landscape

The liquid ring vacuum pump market forecasting report includes the adoption lifecycle of the market, covering from the innovator’s stage to the laggard’s stage. It focuses on adoption rates in different regions based on penetration. Furthermore, the liquid ring vacuum pump market report also includes key purchase criteria and drivers of price sensitivity to help companies evaluate and develop their market growth analysis strategies.

Customer Landscape of Liquid Ring Vacuum Pump Industry

Competitive Landscape

Companies are implementing various strategies, such as strategic alliances, liquid ring vacuum pump market forecast, partnerships, mergers and acquisitions, geographical expansion, and product/service launches, to enhance their presence in the industry.

Agilent Technologies Inc. - Key offerings encompass engineered liquid ring vacuum pump systems, designed for robust wet gas handling and reliable performance in demanding industrial processes and applications.

The industry research and growth report includes detailed analyses of the competitive landscape of the market and information about key companies, including:

  • Agilent Technologies Inc.
  • Atlas Copco UK Holdings
  • Busch Dienste GmbH
  • Cutes Corp.
  • EBARA Engineering Singapore
  • Edwards Vacuum
  • Flowserve Corp.
  • Graham Corp.
  • Ingersoll Rand Inc.
  • OMEL Pumps and Compressors Ltd
  • Pompetravaini Spa
  • PPI Pumps Pvt. Ltd.
  • Samson Pump AS
  • Tsurumi Manufacturing Co. Ltd.
  • Vooner FloGard Corp.
  • Zibo Zhaohan Vacuum Pump co.

Qualitative and quantitative analysis of companies has been conducted to help clients understand the wider business environment as well as the strengths and weaknesses of key industry players. Data is qualitatively analyzed to categorize companies as pure play, category-focused, industry-focused, and diversified; it is quantitatively analyzed to categorize companies as dominant, leading, strong, tentative, and weak.

Recent Development and News in Liquid ring vacuum pump market

  • In May 2025, Braskem completed the installation of a new closed-loop vacuum system at its production facility in Brazil, featuring a solvent-based liquid ring system to recover volatile organic compounds.
  • In April 2025, the European Environment Agency introduced a new directive focused on industrial water stewardship, imposing tighter restrictions on effluent discharge for chemical manufacturing facilities within the European Union.
  • In April 2025, LyondellBasell announced the successful commissioning of a new propylene oxide and tertiary butyl alcohol production unit in Texas, which incorporated multiple high-capacity liquid ring vacuum systems.
  • In February 2025, Busch Vacuum expanded its North American service footprint through the acquisition of Total Maintenance Solutions, a US-based provider specializing in vacuum pump maintenance.

Dive into Technavio’s robust research methodology, blending expert interviews, extensive data synthesis, and validated models for unparalleled Liquid Ring Vacuum Pump Market insights. See full methodology.

Market Scope
Page number 295
Base year 2025
Historic period 2020-2024
Forecast period 2026-2030
Growth momentum & CAGR Accelerate at a CAGR of 5.1%
Market growth 2026-2030 USD 515.7 million
Market structure Fragmented
YoY growth 2025-2026(%) 5.0%
Key countries China, India, Japan, South Korea, Australia, Indonesia, Germany, France, UK, Italy, The Netherlands, Spain, US, Canada, Mexico, Saudi Arabia, UAE, South Africa, Israel, Turkey, Brazil, Argentina and Colombia
Competitive landscape Leading Companies, Market Positioning of Companies, Competitive Strategies, and Industry Risks

Request Free Sample

Research Analyst Overview

  • The liquid ring vacuum pump market maintains its strategic importance in industrial processes where reliability and safety are non-negotiable. The technology's core advantage, isothermal compression, makes it indispensable for explosive gas compression and applications with high liquid carryover tolerance.
  • Boardroom decisions are increasingly influenced by the need to balance capital expenditure with long-term operational expenditure, favoring systems that offer superior energy efficiency optimization. A key trend is the adoption of IIoT predictive maintenance, enabling proactive interventions that can reduce unplanned downtime by up to 25%.
  • The market is also driven by the need for compliance with ATEX certification and API 681 standards in critical sectors. Innovations focus on cavitation prevention and hydraulic loss reduction through advanced single-stage and two-stage pump designs. The deployment of skid-mounted packages with variable frequency drive (VFD) integration allows for better process control and energy savings.
  • As industries pursue stringent sustainability targets, the demand for closed-loop recirculation and solvent-sealed systems continues to grow, transforming operational models.

What are the Key Data Covered in this Liquid Ring Vacuum Pump Market Research and Growth Report?

  • What is the expected growth of the Liquid Ring Vacuum Pump Market between 2026 and 2030?

    • USD 515.7 million, at a CAGR of 5.1%

  • What segmentation does the market report cover?

    • The report is segmented by Type (Single stage, and Multiple stage), Material (Stainless steel, Cast iron, and Others), End-user (Chemical processing, Oil and gas, Power generation, Paper and pulp, and Others) and Geography (APAC, Europe, North America, Middle East and Africa, South America)

  • Which regions are analyzed in the report?

    • APAC, Europe, North America, Middle East and Africa and South America

  • What are the key growth drivers and market challenges?

    • Expansion of chemical and petrochemical industries, Competition from dry vacuum technologies and water consumption concerns

  • Who are the major players in the Liquid Ring Vacuum Pump Market?

    • Agilent Technologies Inc., Atlas Copco UK Holdings, Busch Dienste GmbH, Cutes Corp., EBARA Engineering Singapore, Edwards Vacuum, Flowserve Corp., Graham Corp., Ingersoll Rand Inc., OMEL Pumps and Compressors Ltd, Pompetravaini Spa, PPI Pumps Pvt. Ltd., Samson Pump AS, Tsurumi Manufacturing Co. Ltd., Vooner FloGard Corp. and Zibo Zhaohan Vacuum Pump co.

Market Research Insights

  • Market dynamics are increasingly shaped by a focus on reducing the total cost of ownership and aligning with stringent environmental compliance mandates. Businesses are achieving operational expenditure reductions of up to 40% by transitioning from once-through water systems to closed-loop recirculation designs. This shift not only enhances water stewardship but also improves overall plant thermal efficiency.
  • Furthermore, the adoption of IIoT-enabled asset monitoring suites allows for advanced preventative maintenance strategies, which have been shown to reduce unplanned downtime by more than 25%. This focus on lifecycle services and operational excellence is creating new value propositions beyond initial capital expenditure, driving demand for more sophisticated and sustainable vacuum solutions.

We can help! Our analysts can customize this liquid ring vacuum pump market research report to meet your requirements.

Get in touch

1. Executive Summary

1.1 Market overview

Executive Summary - Chart on Market Overview
Executive Summary - Data Table on Market Overview
Executive Summary - Chart on Global Market Characteristics
Executive Summary - Chart on Market by Geography
Executive Summary - Chart on Market Segmentation by Type
Executive Summary - Chart on Market Segmentation by Material
Executive Summary - Chart on Market Segmentation by End-user
Executive Summary - Chart on Incremental Growth
Executive Summary - Data Table on Incremental Growth
Executive Summary - Chart on Company Market Positioning

2. Technavio Analysis

2.1 Analysis of price sensitivity, lifecycle, customer purchase basket, adoption rates, and purchase criteria

2.2 Criticality of inputs and Factors of differentiation

Chart on Overview on criticality of inputs and factors of differentiation

2.3 Factors of disruption

Chart on Overview on factors of disruption

2.4 Impact of drivers and challenges

Chart on Impact of drivers and challenges in 2025 and 2030

3. Market Landscape

3.1 Market ecosystem

Chart on Parent Market
Data Table on - Parent Market

3.2 Market characteristics

Chart on Market characteristics analysis

3.3 Value chain analysis

Chart on Value chain analysis

4. Market Sizing

4.1 Market definition

Data Table on Offerings of companies included in the market definition

4.2 Market segment analysis

Market segments

4.3 Market size 2025

4.4 Market outlook: Forecast for 2025-2030

Chart on Global - Market size and forecast 2025-2030 ($ million)
Data Table on Global - Market size and forecast 2025-2030 ($ million)
Chart on Global Market: Year-over-year growth 2025-2030 (%)
Data Table on Global Market: Year-over-year growth 2025-2030 (%)

5. Historic Market Size

5.1 Global Liquid Ring Vacuum Pump Market 2020 - 2024

Historic Market Size - Data Table on Global Liquid Ring Vacuum Pump Market 2020 - 2024 ($ million)

5.2 Type segment analysis 2020 - 2024

Historic Market Size - Type Segment 2020 - 2024 ($ million)

5.3 Material segment analysis 2020 - 2024

Historic Market Size - Material Segment 2020 - 2024 ($ million)

5.4 End-user segment analysis 2020 - 2024

Historic Market Size - End-user Segment 2020 - 2024 ($ million)

5.5 Geography segment analysis 2020 - 2024

Historic Market Size - Geography Segment 2020 - 2024 ($ million)

5.6 Country segment analysis 2020 - 2024

Historic Market Size - Country Segment 2020 - 2024 ($ million)

6. Qualitative Analysis

6.1 The AI impact on global liquid ring vacuum pump market

7. Five Forces Analysis

7.1 Five forces summary

Five forces analysis - Comparison between 2025 and 2030

7.2 Bargaining power of buyers

Bargaining power of buyers - Impact of key factors 2025 and 2030

7.3 Bargaining power of suppliers

Bargaining power of suppliers - Impact of key factors in 2025 and 2030

7.4 Threat of new entrants

Threat of new entrants - Impact of key factors in 2025 and 2030

7.5 Threat of substitutes

Threat of substitutes - Impact of key factors in 2025 and 2030

7.6 Threat of rivalry

Threat of rivalry - Impact of key factors in 2025 and 2030

7.7 Market condition

Chart on Market condition - Five forces 2025 and 2030

8. Market Segmentation by Type

8.1 Market segments

Chart on Type - Market share 2025-2030 (%)
Data Table on Type - Market share 2025-2030 (%)

8.2 Comparison by Type

Chart on Comparison by Type
Data Table on Comparison by Type

8.3 Single stage - Market size and forecast 2025-2030

Chart on Single stage - Market size and forecast 2025-2030 ($ million)
Data Table on Single stage - Market size and forecast 2025-2030 ($ million)
Chart on Single stage - Year-over-year growth 2025-2030 (%)
Data Table on Single stage - Year-over-year growth 2025-2030 (%)

8.4 Multiple stage - Market size and forecast 2025-2030

Chart on Multiple stage - Market size and forecast 2025-2030 ($ million)
Data Table on Multiple stage - Market size and forecast 2025-2030 ($ million)
Chart on Multiple stage - Year-over-year growth 2025-2030 (%)
Data Table on Multiple stage - Year-over-year growth 2025-2030 (%)

8.5 Market opportunity by Type

Market opportunity by Type ($ million)
Data Table on Market opportunity by Type ($ million)

9. Market Segmentation by Material

9.1 Market segments

Chart on Material - Market share 2025-2030 (%)
Data Table on Material - Market share 2025-2030 (%)

9.2 Comparison by Material

Chart on Comparison by Material
Data Table on Comparison by Material

9.3 Stainless steel - Market size and forecast 2025-2030

Chart on Stainless steel - Market size and forecast 2025-2030 ($ million)
Data Table on Stainless steel - Market size and forecast 2025-2030 ($ million)
Chart on Stainless steel - Year-over-year growth 2025-2030 (%)
Data Table on Stainless steel - Year-over-year growth 2025-2030 (%)

9.4 Cast iron - Market size and forecast 2025-2030

Chart on Cast iron - Market size and forecast 2025-2030 ($ million)
Data Table on Cast iron - Market size and forecast 2025-2030 ($ million)
Chart on Cast iron - Year-over-year growth 2025-2030 (%)
Data Table on Cast iron - Year-over-year growth 2025-2030 (%)

9.5 Others - Market size and forecast 2025-2030

Chart on Others - Market size and forecast 2025-2030 ($ million)
Data Table on Others - Market size and forecast 2025-2030 ($ million)
Chart on Others - Year-over-year growth 2025-2030 (%)
Data Table on Others - Year-over-year growth 2025-2030 (%)

9.6 Market opportunity by Material

Market opportunity by Material ($ million)
Data Table on Market opportunity by Material ($ million)

10. Market Segmentation by End-user

10.1 Market segments

Chart on End-user - Market share 2025-2030 (%)
Data Table on End-user - Market share 2025-2030 (%)

10.2 Comparison by End-user

Chart on Comparison by End-user
Data Table on Comparison by End-user

10.3 Chemical processing - Market size and forecast 2025-2030

Chart on Chemical processing - Market size and forecast 2025-2030 ($ million)
Data Table on Chemical processing - Market size and forecast 2025-2030 ($ million)
Chart on Chemical processing - Year-over-year growth 2025-2030 (%)
Data Table on Chemical processing - Year-over-year growth 2025-2030 (%)

10.4 Oil and gas - Market size and forecast 2025-2030

Chart on Oil and gas - Market size and forecast 2025-2030 ($ million)
Data Table on Oil and gas - Market size and forecast 2025-2030 ($ million)
Chart on Oil and gas - Year-over-year growth 2025-2030 (%)
Data Table on Oil and gas - Year-over-year growth 2025-2030 (%)

10.5 Power generation - Market size and forecast 2025-2030

Chart on Power generation - Market size and forecast 2025-2030 ($ million)
Data Table on Power generation - Market size and forecast 2025-2030 ($ million)
Chart on Power generation - Year-over-year growth 2025-2030 (%)
Data Table on Power generation - Year-over-year growth 2025-2030 (%)

10.6 Paper and pulp - Market size and forecast 2025-2030

Chart on Paper and pulp - Market size and forecast 2025-2030 ($ million)
Data Table on Paper and pulp - Market size and forecast 2025-2030 ($ million)
Chart on Paper and pulp - Year-over-year growth 2025-2030 (%)
Data Table on Paper and pulp - Year-over-year growth 2025-2030 (%)

10.7 Others - Market size and forecast 2025-2030

Chart on Others - Market size and forecast 2025-2030 ($ million)
Data Table on Others - Market size and forecast 2025-2030 ($ million)
Chart on Others - Year-over-year growth 2025-2030 (%)
Data Table on Others - Year-over-year growth 2025-2030 (%)

10.8 Market opportunity by End-user

Market opportunity by End-user ($ million)
Data Table on Market opportunity by End-user ($ million)

11. Customer Landscape

11.1 Customer landscape overview

Analysis of price sensitivity, lifecycle, customer purchase basket, adoption rates, and purchase criteria

12. Geographic Landscape

12.1 Geographic segmentation

Chart on Market share by geography 2025-2030 (%)
Data Table on Market share by geography 2025-2030 (%)

12.2 Geographic comparison

Chart on Geographic comparison
Data Table on Geographic comparison

12.3 APAC - Market size and forecast 2025-2030

Chart on APAC - Market size and forecast 2025-2030 ($ million)
Data Table on APAC - Market size and forecast 2025-2030 ($ million)
Chart on APAC - Year-over-year growth 2025-2030 (%)
Data Table on APAC - Year-over-year growth 2025-2030 (%)
Chart on Regional Comparison - APAC
Data Table on Regional Comparison - APAC

12.3.1 China - Market size and forecast 2025-2030

Chart on China - Market size and forecast 2025-2030 ($ million)
Data Table on China - Market size and forecast 2025-2030 ($ million)
Chart on China - Year-over-year growth 2025-2030 (%)
Data Table on China - Year-over-year growth 2025-2030 (%)

12.3.2 India - Market size and forecast 2025-2030

Chart on India - Market size and forecast 2025-2030 ($ million)
Data Table on India - Market size and forecast 2025-2030 ($ million)
Chart on India - Year-over-year growth 2025-2030 (%)
Data Table on India - Year-over-year growth 2025-2030 (%)

12.3.3 Japan - Market size and forecast 2025-2030

Chart on Japan - Market size and forecast 2025-2030 ($ million)
Data Table on Japan - Market size and forecast 2025-2030 ($ million)
Chart on Japan - Year-over-year growth 2025-2030 (%)
Data Table on Japan - Year-over-year growth 2025-2030 (%)

12.3.4 South Korea - Market size and forecast 2025-2030

Chart on South Korea - Market size and forecast 2025-2030 ($ million)
Data Table on South Korea - Market size and forecast 2025-2030 ($ million)
Chart on South Korea - Year-over-year growth 2025-2030 (%)
Data Table on South Korea - Year-over-year growth 2025-2030 (%)

12.3.5 Australia - Market size and forecast 2025-2030

Chart on Australia - Market size and forecast 2025-2030 ($ million)
Data Table on Australia - Market size and forecast 2025-2030 ($ million)
Chart on Australia - Year-over-year growth 2025-2030 (%)
Data Table on Australia - Year-over-year growth 2025-2030 (%)

12.3.6 Indonesia - Market size and forecast 2025-2030

Chart on Indonesia - Market size and forecast 2025-2030 ($ million)
Data Table on Indonesia - Market size and forecast 2025-2030 ($ million)
Chart on Indonesia - Year-over-year growth 2025-2030 (%)
Data Table on Indonesia - Year-over-year growth 2025-2030 (%)

12.4 Europe - Market size and forecast 2025-2030

Chart on Europe - Market size and forecast 2025-2030 ($ million)
Data Table on Europe - Market size and forecast 2025-2030 ($ million)
Chart on Europe - Year-over-year growth 2025-2030 (%)
Data Table on Europe - Year-over-year growth 2025-2030 (%)
Chart on Regional Comparison - Europe
Data Table on Regional Comparison - Europe

12.4.1 Germany - Market size and forecast 2025-2030

Chart on Germany - Market size and forecast 2025-2030 ($ million)
Data Table on Germany - Market size and forecast 2025-2030 ($ million)
Chart on Germany - Year-over-year growth 2025-2030 (%)
Data Table on Germany - Year-over-year growth 2025-2030 (%)

12.4.2 France - Market size and forecast 2025-2030

Chart on France - Market size and forecast 2025-2030 ($ million)
Data Table on France - Market size and forecast 2025-2030 ($ million)
Chart on France - Year-over-year growth 2025-2030 (%)
Data Table on France - Year-over-year growth 2025-2030 (%)

12.4.3 UK - Market size and forecast 2025-2030

Chart on UK - Market size and forecast 2025-2030 ($ million)
Data Table on UK - Market size and forecast 2025-2030 ($ million)
Chart on UK - Year-over-year growth 2025-2030 (%)
Data Table on UK - Year-over-year growth 2025-2030 (%)

12.4.4 Italy - Market size and forecast 2025-2030

Chart on Italy - Market size and forecast 2025-2030 ($ million)
Data Table on Italy - Market size and forecast 2025-2030 ($ million)
Chart on Italy - Year-over-year growth 2025-2030 (%)
Data Table on Italy - Year-over-year growth 2025-2030 (%)

12.4.5 The Netherlands - Market size and forecast 2025-2030

Chart on The Netherlands - Market size and forecast 2025-2030 ($ million)
Data Table on The Netherlands - Market size and forecast 2025-2030 ($ million)
Chart on The Netherlands - Year-over-year growth 2025-2030 (%)
Data Table on The Netherlands - Year-over-year growth 2025-2030 (%)

12.4.6 Spain - Market size and forecast 2025-2030

Chart on Spain - Market size and forecast 2025-2030 ($ million)
Data Table on Spain - Market size and forecast 2025-2030 ($ million)
Chart on Spain - Year-over-year growth 2025-2030 (%)
Data Table on Spain - Year-over-year growth 2025-2030 (%)

12.5 North America - Market size and forecast 2025-2030

Chart on North America - Market size and forecast 2025-2030 ($ million)
Data Table on North America - Market size and forecast 2025-2030 ($ million)
Chart on North America - Year-over-year growth 2025-2030 (%)
Data Table on North America - Year-over-year growth 2025-2030 (%)
Chart on Regional Comparison - North America
Data Table on Regional Comparison - North America

12.5.1 US - Market size and forecast 2025-2030

Chart on US - Market size and forecast 2025-2030 ($ million)
Data Table on US - Market size and forecast 2025-2030 ($ million)
Chart on US - Year-over-year growth 2025-2030 (%)
Data Table on US - Year-over-year growth 2025-2030 (%)

12.5.2 Canada - Market size and forecast 2025-2030

Chart on Canada - Market size and forecast 2025-2030 ($ million)
Data Table on Canada - Market size and forecast 2025-2030 ($ million)
Chart on Canada - Year-over-year growth 2025-2030 (%)
Data Table on Canada - Year-over-year growth 2025-2030 (%)

12.5.3 Mexico - Market size and forecast 2025-2030

Chart on Mexico - Market size and forecast 2025-2030 ($ million)
Data Table on Mexico - Market size and forecast 2025-2030 ($ million)
Chart on Mexico - Year-over-year growth 2025-2030 (%)
Data Table on Mexico - Year-over-year growth 2025-2030 (%)

12.6 Middle East and Africa - Market size and forecast 2025-2030

Chart on Middle East and Africa - Market size and forecast 2025-2030 ($ million)
Data Table on Middle East and Africa - Market size and forecast 2025-2030 ($ million)
Chart on Middle East and Africa - Year-over-year growth 2025-2030 (%)
Data Table on Middle East and Africa - Year-over-year growth 2025-2030 (%)
Chart on Regional Comparison - Middle East and Africa
Data Table on Regional Comparison - Middle East and Africa

12.6.1 Saudi Arabia - Market size and forecast 2025-2030

Chart on Saudi Arabia - Market size and forecast 2025-2030 ($ million)
Data Table on Saudi Arabia - Market size and forecast 2025-2030 ($ million)
Chart on Saudi Arabia - Year-over-year growth 2025-2030 (%)
Data Table on Saudi Arabia - Year-over-year growth 2025-2030 (%)

12.6.2 UAE - Market size and forecast 2025-2030

Chart on UAE - Market size and forecast 2025-2030 ($ million)
Data Table on UAE - Market size and forecast 2025-2030 ($ million)
Chart on UAE - Year-over-year growth 2025-2030 (%)
Data Table on UAE - Year-over-year growth 2025-2030 (%)

12.6.3 South Africa - Market size and forecast 2025-2030

Chart on South Africa - Market size and forecast 2025-2030 ($ million)
Data Table on South Africa - Market size and forecast 2025-2030 ($ million)
Chart on South Africa - Year-over-year growth 2025-2030 (%)
Data Table on South Africa - Year-over-year growth 2025-2030 (%)

12.6.4 Israel - Market size and forecast 2025-2030

Chart on Israel - Market size and forecast 2025-2030 ($ million)
Data Table on Israel - Market size and forecast 2025-2030 ($ million)
Chart on Israel - Year-over-year growth 2025-2030 (%)
Data Table on Israel - Year-over-year growth 2025-2030 (%)

12.6.5 Turkey - Market size and forecast 2025-2030

Chart on Turkey - Market size and forecast 2025-2030 ($ million)
Data Table on Turkey - Market size and forecast 2025-2030 ($ million)
Chart on Turkey - Year-over-year growth 2025-2030 (%)
Data Table on Turkey - Year-over-year growth 2025-2030 (%)

12.7 South America - Market size and forecast 2025-2030

Chart on South America - Market size and forecast 2025-2030 ($ million)
Data Table on South America - Market size and forecast 2025-2030 ($ million)
Chart on South America - Year-over-year growth 2025-2030 (%)
Data Table on South America - Year-over-year growth 2025-2030 (%)
Chart on Regional Comparison - South America
Data Table on Regional Comparison - South America

12.7.1 Brazil - Market size and forecast 2025-2030

Chart on Brazil - Market size and forecast 2025-2030 ($ million)
Data Table on Brazil - Market size and forecast 2025-2030 ($ million)
Chart on Brazil - Year-over-year growth 2025-2030 (%)
Data Table on Brazil - Year-over-year growth 2025-2030 (%)

12.7.2 Argentina - Market size and forecast 2025-2030

Chart on Argentina - Market size and forecast 2025-2030 ($ million)
Data Table on Argentina - Market size and forecast 2025-2030 ($ million)
Chart on Argentina - Year-over-year growth 2025-2030 (%)
Data Table on Argentina - Year-over-year growth 2025-2030 (%)

12.7.3 Colombia - Market size and forecast 2025-2030

Chart on Colombia - Market size and forecast 2025-2030 ($ million)
Data Table on Colombia - Market size and forecast 2025-2030 ($ million)
Chart on Colombia - Year-over-year growth 2025-2030 (%)
Data Table on Colombia - Year-over-year growth 2025-2030 (%)

12.8 Market opportunity by geography

Market opportunity by geography ($ million)
Data Tables on Market opportunity by geography ($ million)

13. Drivers, Challenges, and Opportunity

13.1 Market drivers

Expansion of chemical and petrochemical industries
Strategic shift toward sustainable power generation
Stringent environmental regulations and emission control

13.2 Market challenges

Competition from dry vacuum technologies and water consumption concerns
High energy consumption and hydraulic losses
Performance limitations due to vapor pressure and cavitation risks

13.3 Impact of drivers and challenges

Impact of drivers and challenges in 2025 and 2030

13.4 Market opportunities

Accelerated adoption of hybrid vacuum systems
Transition toward closed-loop and solvent-sealed operations
Integration of IIoT for predictive maintenance and cavitation prevention

14. Competitive Landscape

14.1 Overview

14.2

Overview on criticality of inputs and factors of differentiation

14.3 Landscape disruption

Overview on factors of disruption

14.4 Industry risks

Impact of key risks on business

15. Competitive Analysis

15.1 Companies profiled

Companies covered

15.2 Company ranking index

15.3 Market positioning of companies

Matrix on companies position and classification

15.4 Agilent Technologies Inc.

Agilent Technologies Inc. - Overview
Agilent Technologies Inc. - Business segments
Agilent Technologies Inc. - Key news
Agilent Technologies Inc. - Key offerings
Agilent Technologies Inc. - Segment focus
SWOT

15.5 Atlas Copco UK Holdings

Atlas Copco UK Holdings - Overview
Atlas Copco UK Holdings - Product / Service
Atlas Copco UK Holdings - Key offerings
SWOT

15.6 Busch Dienste GmbH

Busch Dienste GmbH - Overview
Busch Dienste GmbH - Product / Service
Busch Dienste GmbH - Key offerings
SWOT

15.7 Cutes Corp.

Cutes Corp. - Overview
Cutes Corp. - Product / Service
Cutes Corp. - Key offerings
SWOT

15.8 Edwards Vacuum

Edwards Vacuum - Overview
Edwards Vacuum - Product / Service
Edwards Vacuum - Key offerings
SWOT

15.9 Flowserve Corp.

Flowserve Corp. - Overview
Flowserve Corp. - Business segments
Flowserve Corp. - Key offerings
Flowserve Corp. - Segment focus
SWOT

15.10 Graham Corp.

Graham Corp. - Overview
Graham Corp. - Product / Service
Graham Corp. - Key news
Graham Corp. - Key offerings
SWOT

15.11 Ingersoll Rand Inc.

Ingersoll Rand Inc. - Overview
Ingersoll Rand Inc. - Business segments
Ingersoll Rand Inc. - Key offerings
Ingersoll Rand Inc. - Segment focus
SWOT

15.12 OMEL Pumps and Compressors Ltd

OMEL Pumps and Compressors Ltd - Overview
OMEL Pumps and Compressors Ltd - Product / Service
OMEL Pumps and Compressors Ltd - Key offerings
SWOT

15.13 Pompetravaini Spa

Pompetravaini Spa - Overview
Pompetravaini Spa - Product / Service
Pompetravaini Spa - Key offerings
SWOT

15.14 PPI Pumps Pvt. Ltd.

PPI Pumps Pvt. Ltd. - Overview
PPI Pumps Pvt. Ltd. - Product / Service
PPI Pumps Pvt. Ltd. - Key offerings
SWOT

15.15 Samson Pump AS

Samson Pump AS - Overview
Samson Pump AS - Product / Service
Samson Pump AS - Key offerings
SWOT

15.16 Tsurumi Manufacturing Co. Ltd.

Tsurumi Manufacturing Co. Ltd. - Overview
Tsurumi Manufacturing Co. Ltd. - Product / Service
Tsurumi Manufacturing Co. Ltd. - Key offerings
SWOT

15.17 Vooner FloGard Corp.

Vooner FloGard Corp. - Overview
Vooner FloGard Corp. - Product / Service
Vooner FloGard Corp. - Key offerings
SWOT

15.18 Zibo Zhaohan Vacuum Pump co.

Zibo Zhaohan Vacuum Pump co. - Overview
Zibo Zhaohan Vacuum Pump co. - Product / Service
Zibo Zhaohan Vacuum Pump co. - Key offerings
SWOT

16. Appendix

16.1 Scope of the report

Market definition
Objectives
Notes and caveats

16.2 Inclusions and exclusions checklist

Inclusions checklist
Exclusions checklist

16.3 Currency conversion rates for US$

16.4 Research methodology

16.5 Data procurement

Information sources

16.6 Data validation

16.7 Validation techniques employed for market sizing

16.8 Data synthesis

16.9 360 degree market analysis

16.10 List of abbreviations

Research Methodology

Technavio presents a detailed picture of the market by way of study, synthesis, and summation of data from multiple sources. The analysts have presented the various facets of the market with a particular focus on identifying the key industry influencers. The data thus presented is comprehensive, reliable, and the result of extensive research, both primary and secondary.

INFORMATION SOURCES

Primary sources

  • Manufacturers and suppliers
  • Channel partners
  • Industry experts
  • Strategic decision makers

Secondary sources

  • Industry journals and periodicals
  • Government data
  • Financial reports of key industry players
  • Historical data
  • Press releases

DATA ANALYSIS

Data Synthesis

  • Collation of data
  • Estimation of key figures
  • Analysis of derived insights

Data Validation

  • Triangulation with data models
  • Reference against proprietary databases
  • Corroboration with industry experts

REPORT WRITING

Qualitative

  • Market drivers
  • Market challenges
  • Market trends
  • Five forces analysis

Quantitative

  • Market size and forecast
  • Market segmentation
  • Geographical insights
  • Competitive landscape

Interested in this report?

Get your sample now to see our research methodology and insights!

Download Now

Frequently Asked Questions

Liquid Ring Vacuum Pump market growth will increase by USD 515.7 million during 2026-2030 .

The Liquid Ring Vacuum Pump market is expected to grow at a CAGR of 5.1% during 2026-2030 .

Liquid Ring Vacuum Pump market is segmented by Type (Single stage, Multiple stage) Material (Stainless steel, Cast iron, Others) End-user (Chemical processing, Oil and gas, Power generation, Paper and pulp, Others)

Agilent Technologies Inc., Atlas Copco UK Holdings, Busch Dienste GmbH, Cutes Corp., EBARA Engineering Singapore, Edwards Vacuum, Flowserve Corp., Graham Corp., Ingersoll Rand Inc., OMEL Pumps and Compressors Ltd, Pompetravaini Spa, PPI Pumps Pvt. Ltd., Samson Pump AS, Tsurumi Manufacturing Co. Ltd., Vooner FloGard Corp., Zibo Zhaohan Vacuum Pump co. are a few of the key vendors in the Liquid Ring Vacuum Pump market.

APAC will register the highest growth rate of 49.7% among the other regions. Therefore, the Liquid Ring Vacuum Pump market in APAC is expected to garner significant business opportunities for the vendors during the forecast period.

China, India, Japan, South Korea, Australia, Indonesia, Germany, France, UK, Italy, The Netherlands, Spain, US, Canada, Mexico, Saudi Arabia, UAE, South Africa, Israel, Turkey, Brazil, Argentina, Colombia

  • Expansion of chemical and petrochemical industries is the driving factor this market.

The Liquid Ring Vacuum Pump market vendors should focus on grabbing business opportunities from the Type segment as it accounted for the largest market share in the base year.