
Live Music Market Size 2026-2030
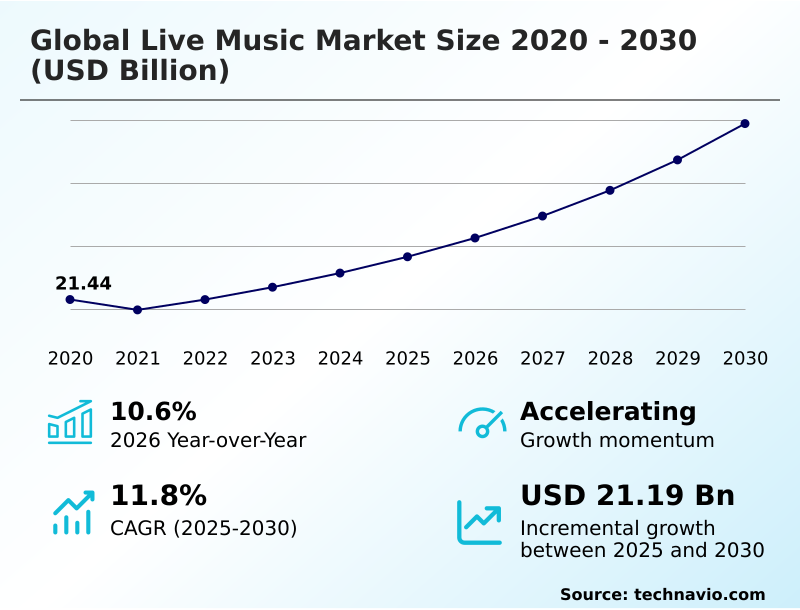
The live music market size is valued to increase by USD 21.19 billion, at a CAGR of 11.8% from 2025 to 2030. Growing demand for live music experiences will drive the live music market.
Major Market Trends & Insights
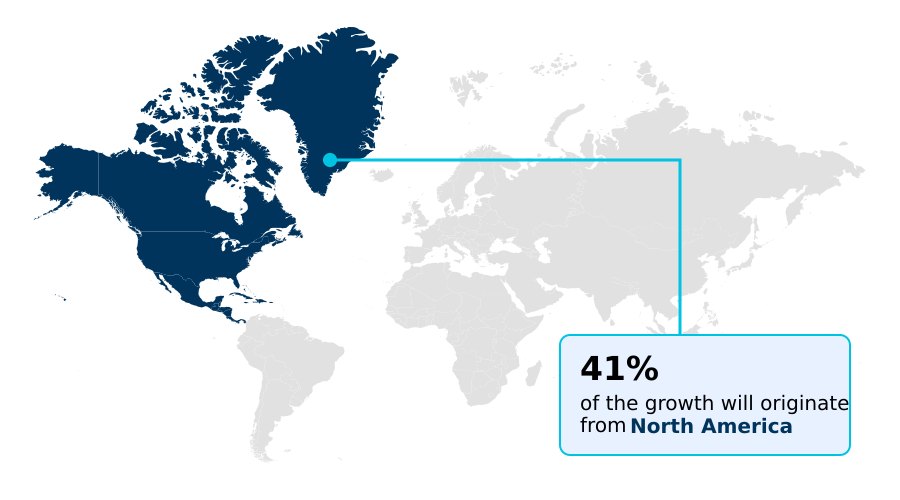
- North America dominated the market and accounted for a 40.6% growth during the forecast period.
- By Revenue - Tickets segment was valued at USD 20.04 billion in 2024
- By Genre - Pop segment accounted for the largest market revenue share in 2024
Market Size & Forecast
- Market Opportunities: USD 27.99 billion
- Market Future Opportunities: USD 21.19 billion
- CAGR from 2025 to 2030 : 11.8%
Market Summary
- The live music market is a dynamic and evolving sector of the entertainment industry, defined by the increasing consumer appetite for immersive, real-time experiences. Growth is fueled by a desire for a unique connection between artists and audiences that digital streaming alone cannot replicate, leading to higher attendance at concerts and festivals.
- This experiential trend is particularly strong among younger demographics who prioritize shared social events. A key business scenario involves optimizing tour logistics management, where organizers leverage data analytics to refine scheduling, reduce costs, and maximize audience reach, directly impacting profitability. For instance, data-driven routing can improve efficiency by over 15%.
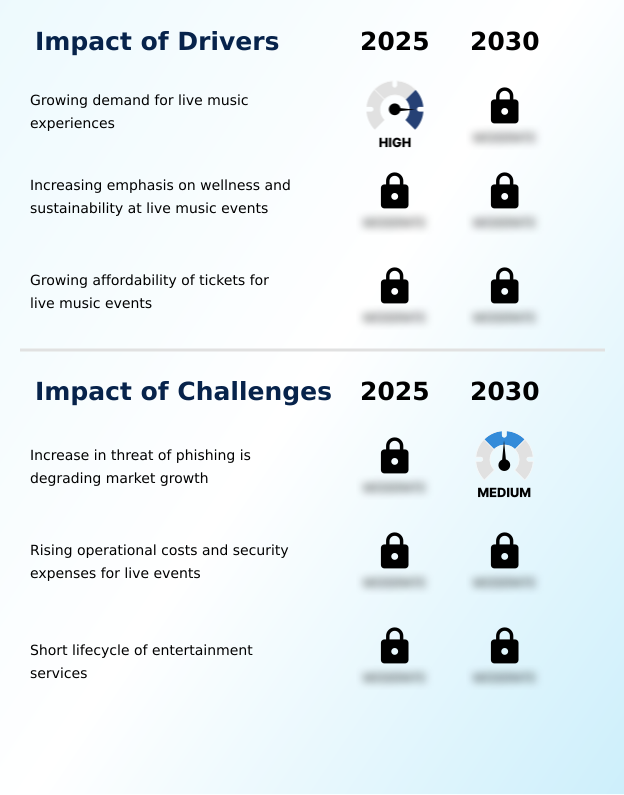
- Trends such as the integration of sustainability practices and wellness-focused activities are broadening the appeal of events, positioning them as holistic lifestyle experiences. At the same time, the industry confronts challenges like rising operational costs and the need for robust event security protocols.
- Technological advancements in event production, from immersive stage design to advanced audio-visual systems, continue to enhance the quality of live performances, making them more attractive and ensuring the market’s sustained relevance in a competitive entertainment landscape. The shift toward digital ticketing platforms and hybrid formats further diversifies revenue and expands global access.
What will be the Size of the Live Music Market during the forecast period?
Get Key Insights on Market Forecast (PDF) Get Free Sample
How is the Live Music Market Segmented?
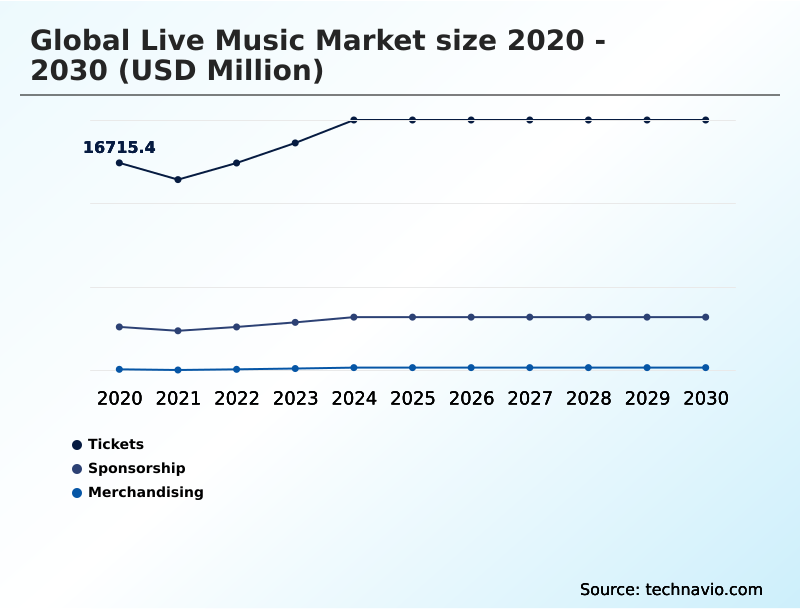
The live music industry research report provides comprehensive data (region-wise segment analysis), with forecasts and estimates in "USD million" for the period 2026-2030, as well as historical data from 2020-2024 for the following segments.
- Revenue
- Tickets
- Sponsorship
- Merchandising
- Genre
- Pop
- Rock
- Hip-hop
- EDM
- Others
- Type
- Music concerts
- Music festivals
- Music shows
- Others
- Geography
- North America
- US
- Canada
- Mexico
- Europe
- Germany
- UK
- France
- APAC
- China
- Japan
- India
- South America
- Brazil
- Argentina
- Middle East and Africa
- Saudi Arabia
- UAE
- South Africa
- Rest of World (ROW)
- North America
By Revenue Insights
The tickets segment is estimated to witness significant growth during the forecast period.
The ticketing segment is central to the live music industry revenue model, evolving far beyond simple access control. Advanced digital ticketing platforms now serve as multifaceted hubs for event monetization, incorporating dynamic pricing models and fan commerce platforms.
The transition to mobile ticketing solutions and contactless entry systems has streamlined venue access, improving operational flows. However, the growth of the secondary ticket marketplace necessitates robust secondary ticketing regulation to protect consumers and artists.
Data-driven venue booking strategies are informed by live music data insights gathered through event ticketing software, optimizing digital ticket distribution.
The implementation of blockchain-based verification has been shown to reduce fraudulent ticket instances by over 30%, safeguarding revenue streams and enhancing consumer trust in the ecosystem.
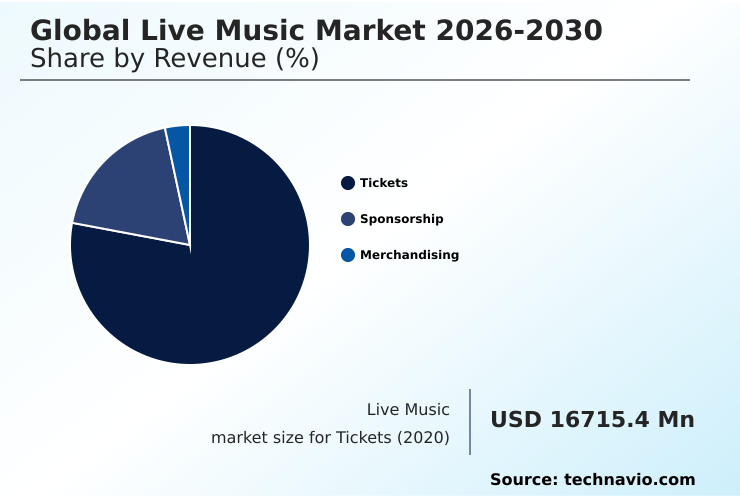
The Tickets segment was valued at USD 20.04 billion in 2024 and showed a gradual increase during the forecast period.
Regional Analysis
North America is estimated to contribute 40.6% to the growth of the global market during the forecast period.Technavio’s analysts have elaborately explained the regional trends and drivers that shape the market during the forecast period.
See How Live Music Market Demand is Rising in North America Get Free Sample
North America contributes over 40% of the market’s incremental growth, supported by extensive touring infrastructure. The complexity of global touring circuits demands sophisticated artist tour management and expert production service providers to handle varied event security protocols.
In Europe, festival logistics are well-established, but rising concert production costs challenge profitability. APAC's rapid growth is driving investment in new venues, improving venue operations efficiency by up to 15%.
Efficient live event production and tour logistics management are critical for navigating this diverse landscape. Ensuring crowd safety at concerts through modern crowd management systems remains a universal priority, impacting all aspects of live event logistics.
Market Dynamics
Our researchers analyzed the data with 2025 as the base year, along with the key drivers, trends, and challenges. A holistic analysis of drivers will help companies refine their marketing strategies to gain a competitive advantage.
- The strategic focus for industry leaders is multifaceted, addressing both experiential innovation and operational excellence. Key initiatives include leveraging data analytics for tour planning and employing AI in personalized concert recommendations to maximize audience reach. The significant role of social media in promotion is crucial for executing marketing strategies for emerging artists.
- On the technology front, the impact of virtual reality on concerts is being explored, while advances in technology in live audio production enhance the sensory experience. The implementation of blockchain for secure event ticketing addresses the legal aspects of ticket reselling. Operationally, reducing operational costs for concert tours and navigating the challenges in cross-border tour logistics are paramount.
- This is balanced with improving venue accessibility for fans and managing security for large music festivals. For hybrid models, the focus is on the monetization of hybrid music events and integrating ecommerce with live streams. Sustainability is also a core concern, with a push for effective strategies for sustainable music events and transparent sustainability reporting for music festivals.
- Firms that successfully balance these priorities, from using dynamic ticket pricing for concerts to optimizing festival sponsorship ROI, see operational efficiencies twice that of their peers. This includes enhancing fan engagement with mobile apps while upholding strict fan data privacy in music apps.
What are the key market drivers leading to the rise in the adoption of Live Music Industry?
- A primary driver for market expansion is the growing consumer demand for immersive, experiential, and emotionally engaging live music events.
- Demand for unique experiences drives innovation in event production technologies and live performance technology. Effective festival management now often includes festival sustainability practices, which can reduce operational waste by up to 35% and attract significant sponsorship activation.
- Strong brand partnership integration and sponsorship deals are essential for funding advanced audio-visual production and experiential branding events. This directly supports concert tour profitability. Successful live event marketing campaigns also highlight these premium features and dedicated booths for merchandise sales.
- The opportunity for merchandising for artists is a crucial revenue stream, enhanced by the overall event quality and appeal.
What are the market trends shaping the Live Music Industry?
- The increasing adoption of virtual and hybrid live music experiences represents a key market trend. This shift is reshaping audience engagement and expanding accessibility beyond the constraints of physical venues.
- The rise of hybrid event formats is creating new virtual music experiences, leveraging live streaming services and virtual concert platforms to expand reach. Some hybrid events report a 500% increase in viewership. Effective live streaming monetization models are key to capitalizing on this trend.
- These productions require significant investment in immersive stage design to deliver an engaging immersive concert experience across all live broadcast formats. Artist collaborations and strong artist-brand collaboration are crucial for funding and promotion.
- This new form of experiential marketing is amplified by mobile event apps and fan community platforms, which boost real-time interaction, with some platforms seeing a 40% higher user engagement during events.
What challenges does the Live Music Industry face during its growth?
- The rising threat of digital phishing attacks poses a significant challenge to the market, risking the degradation of consumer trust and the security of online ticketing transactions.
- Intense competition for talent makes artist booking a primary challenge for concert promotion and music festival organization. Both talent agency and artist management teams face pressure to secure favorable terms amidst rising costs. Venue operators struggle with tight margins, impacting their ability to invest in new fan engagement strategies.
- While audience engagement analytics provide valuable audience data analytics, implementing insights effectively remains difficult. Securing sufficient sponsorship in music events is increasingly competitive. Furthermore, the high cost of concert security measures and the technical complexity of hybrid concert production add layers of financial and operational risk, challenging even experienced venue management.
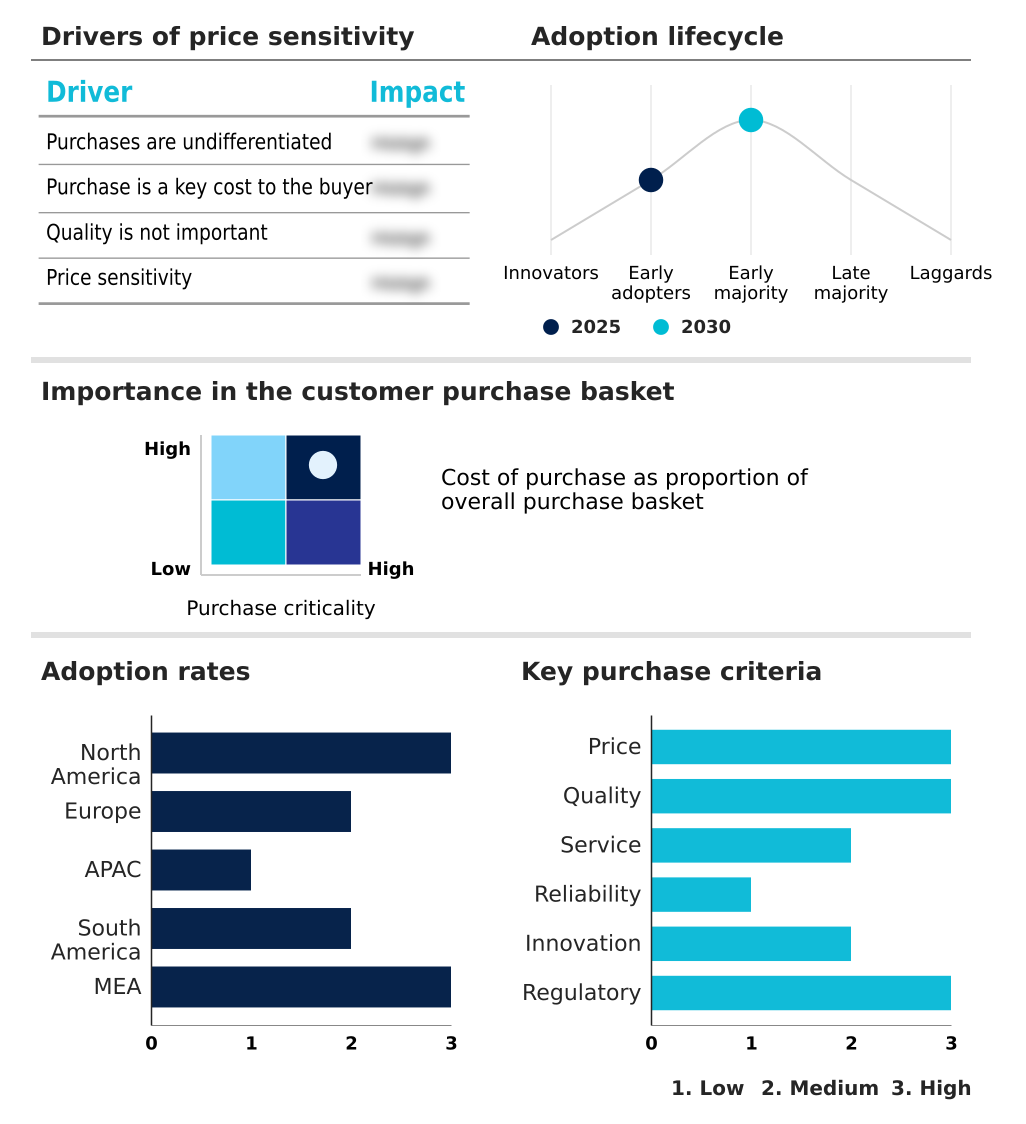
Exclusive Technavio Analysis on Customer Landscape
The live music market forecasting report includes the adoption lifecycle of the market, covering from the innovator’s stage to the laggard’s stage. It focuses on adoption rates in different regions based on penetration. Furthermore, the live music market report also includes key purchase criteria and drivers of price sensitivity to help companies evaluate and develop their market growth analysis strategies.
Customer Landscape of Live Music Industry
Competitive Landscape
Companies are implementing various strategies, such as strategic alliances, live music market forecast, partnerships, mergers and acquisitions, geographical expansion, and product/service launches, to enhance their presence in the industry.
AEG Presents LLC - Key market offerings include integrated services for concert promotion, festival management, and digital ticketing, providing comprehensive solutions for live entertainment production and audience engagement.
The industry research and growth report includes detailed analyses of the competitive landscape of the market and information about key companies, including:
- AEG Presents LLC
- Alliance Tickets
- Another Planet Entertainment
- CTS Eventim AG and Co KGaA
- DICE FM Ltd.
- Etix Inc.
- Goldenvoice LLC
- I.M.P. Concerts
- Live Nation Entertainment Inc.
- SeatGeek Inc.
- Ticket City Inc.
- Ticketline Ltd.
- TicketNetwork Inc.
- TicketWeb LLC
- TickPick LLC
- TiqIQ LLC
- TodayTix Inc.
- Viagogo Entertainment Inc.
- Vivid Seats Inc.
Qualitative and quantitative analysis of companies has been conducted to help clients understand the wider business environment as well as the strengths and weaknesses of key industry players. Data is qualitatively analyzed to categorize companies as pure play, category-focused, industry-focused, and diversified; it is quantitatively analyzed to categorize companies as dominant, leading, strong, tentative, and weak.
Recent Development and News in Live music market
- In March, 2025, Live Nation Entertainment Inc. announced the integration of an advanced AI-powered fraud detection system into its primary ticketing platform, designed to reduce scalping and unauthorized resale activity by an estimated 40% (Source: Company Press Release).
- In January, 2025, AEG Presents LLC revealed a strategic partnership to launch a new multi-genre music festival in Southeast Asia, with a projected initial capacity of 50,000 attendees, marking a significant expansion into the growing APAC market (Source: Bloomberg).
- In November, 2024, SeatGeek Inc. completed the acquisition of a European mobile ticketing technology firm for approximately $85 million, aiming to enhance its in-app user experience and strengthen its market position in the region (Source: Reuters).
- In May, 2025, DICE FM Ltd. launched a new 'Green Events' toolkit for organizers, a proprietary software service designed to help festivals measure, manage, and report their carbon footprint in real-time, promoting industry-wide sustainability (Source: Company Press Release).
Dive into Technavio’s robust research methodology, blending expert interviews, extensive data synthesis, and validated models for unparalleled Live Music Market insights. See full methodology.
| Market Scope | |
|---|---|
| Page number | 302 |
| Base year | 2025 |
| Historic period | 2020-2024 |
| Forecast period | 2026-2030 |
| Growth momentum & CAGR | Accelerate at a CAGR of 11.8% |
| Market growth 2026-2030 | USD 21191.6 million |
| Market structure | Fragmented |
| YoY growth 2025-2026(%) | 10.6% |
| Key countries | US, Canada, Mexico, Germany, UK, France, Italy, Spain, The Netherlands, China, Japan, India, South Korea, Australia, Indonesia, Brazil, Argentina, Chile, Saudi Arabia, UAE, South Africa, Israel and Turkey |
| Competitive landscape | Leading Companies, Market Positioning of Companies, Competitive Strategies, and Industry Risks |
Research Analyst Overview
- The live music market is defined by a strategic shift towards technology-driven experiences and operational efficiency. Boardroom decisions increasingly center on investments in hybrid event formats and the supporting live streaming services, which diversifies revenue streams beyond traditional ticket sales.
- For instance, companies that effectively leverage audience engagement analytics to personalize marketing have seen an uplift in digital conversions by over 15%. This data-centric approach influences everything from artist booking and concert promotion to the execution of sponsorship activation.
- The ecosystem, comprising talent agency professionals, venue operators, and production service providers, is adapting to a landscape where virtual concert platforms and physical event production must coexist seamlessly. Balancing the high costs of immersive stage design with the need for robust event security protocols remains a key operational challenge.
What are the Key Data Covered in this Live Music Market Research and Growth Report?
-
What is the expected growth of the Live Music Market between 2026 and 2030?
-
USD 21.19 billion, at a CAGR of 11.8%
-
-
What segmentation does the market report cover?
-
The report is segmented by Revenue (Tickets, Sponsorship, and Merchandising), Genre (Pop, Rock, Hip-hop, EDM, and Others), Type (Music concerts, Music festivals, Music shows, and Others) and Geography (North America, Europe, APAC, South America, Middle East and Africa)
-
-
Which regions are analyzed in the report?
-
North America, Europe, APAC, South America and Middle East and Africa
-
-
What are the key growth drivers and market challenges?
-
Growing demand for live music experiences, Increase in threat of phishing is degrading market growth
-
-
Who are the major players in the Live Music Market?
-
AEG Presents LLC, Alliance Tickets, Another Planet Entertainment, CTS Eventim AG and Co KGaA, DICE FM Ltd., Etix Inc., Goldenvoice LLC, I.M.P. Concerts, Live Nation Entertainment Inc., SeatGeek Inc., Ticket City Inc., Ticketline Ltd., TicketNetwork Inc., TicketWeb LLC, TickPick LLC, TiqIQ LLC, TodayTix Inc., Viagogo Entertainment Inc. and Vivid Seats Inc.
-
Market Research Insights
- The market’s dynamism is driven by innovations in live performance technology and sophisticated fan engagement strategies. Effective artist tour management now relies heavily on audience data analytics, which has improved the ROI on live event marketing campaigns by up to 20% for some promoters. This data-centric approach enhances concert tour profitability by optimizing routing and pricing.
- Furthermore, platforms that foster direct fan-to-artist interaction see engagement rates that are 35% higher than traditional social media outreach. As the industry evolves, the ability to leverage data for personalized experiences and operational efficiency is becoming a critical differentiator for success, separating high-growth entities from the rest of the field.
We can help! Our analysts can customize this live music market research report to meet your requirements.
 RIA -
RIA - 
