Loan Servicing Software Market Analysis, Size, and Forecast 2026-2030: North America (US, Canada, and Mexico), Europe (Germany, UK, and France), APAC (China, Japan, and India), South America (Brazil, Argentina, and Chile), Middle East and Africa (Saudi Arabia, UAE, and South Africa), and Rest of World (ROW)

Loan Servicing Software Market Analysis, Size, and Forecast 2026-2030:
North America (US, Canada, and Mexico), Europe (Germany, UK, and France), APAC (China, Japan, and India), South America (Brazil, Argentina, and Chile), Middle East and Africa (Saudi Arabia, UAE, and South Africa), and Rest of World (ROW)

Published: May 2026 320 Pages SKU: IRTNTR44321

Market Overview at a Glance

$4.02 B
Market Opportunity
13.9%
CAGR 2025 - 2030
49.4%
North America Growth
$1.12 B
Banks segment 2024

Loan Servicing Software Market Size 2026-2030

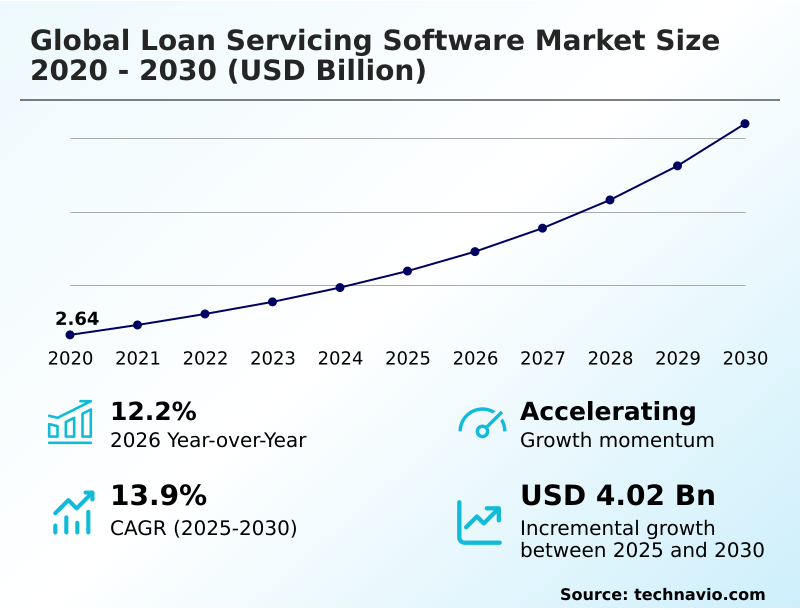
The loan servicing software market size is valued to increase by USD 4.02 billion, at a CAGR of 13.9% from 2025 to 2030. Demand for efficiency in lending operations will drive the loan servicing software market.

Major Market Trends & Insights

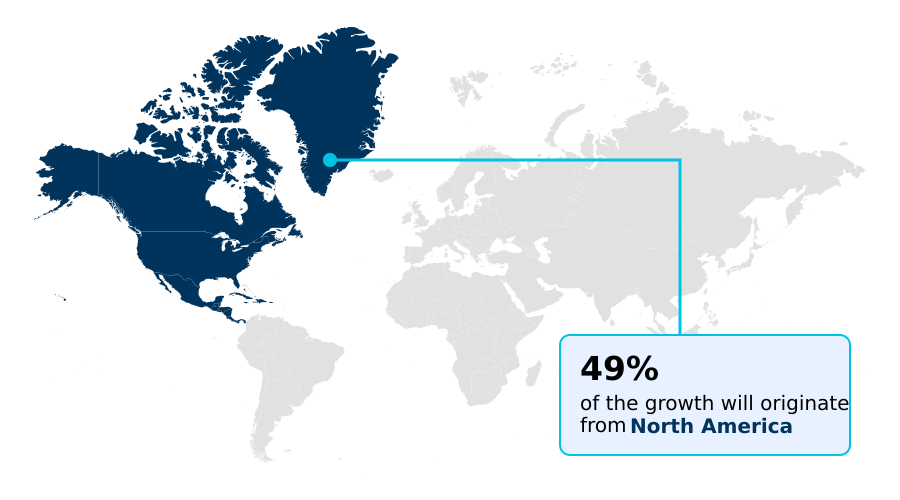
  • North America dominated the market and accounted for a 49.4% growth during the forecast period.
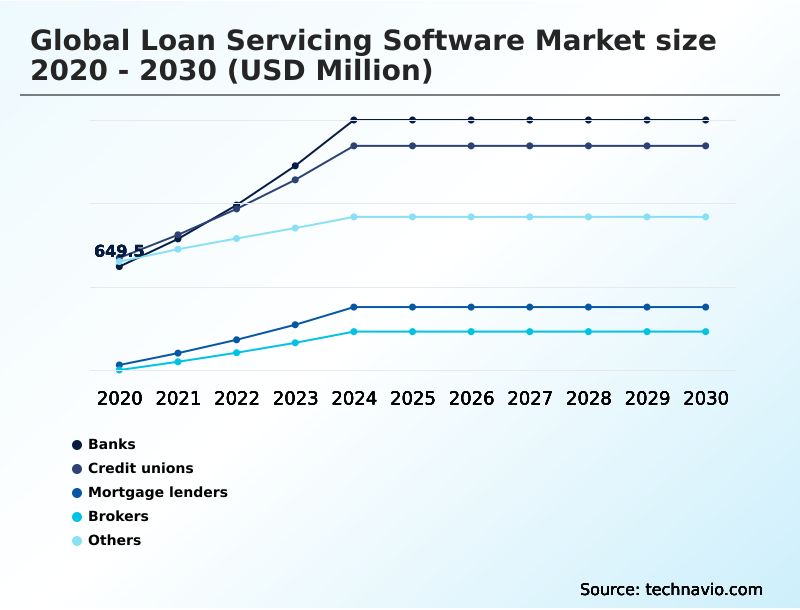
  • By Application - Banks segment was valued at USD 1.12 billion in 2024
  • By Deployment - Cloud-based segment accounted for the largest market revenue share in 2024

Market Size & Forecast

  • Market Opportunities: USD 5.75 billion
  • Market Future Opportunities: USD 4.02 billion
  • CAGR from 2025 to 2030 : 13.9%

Market Summary

  • The Loan Servicing Software Market demonstrates accelerated adoption as financial institutions seek to digitize and optimize post-disbursement credit administration. In a real-world supply chain financing scenario, lenders deploying cloud-native lending infrastructure effectively synchronized vendor payments with borrower statements, reducing administrative processing costs by 22% compared to legacy manual workflows.
  • The escalating demand for operational efficiency acts as a primary growth driver, compelling banks and credit unions to integrate robotic process automation workflows that instantly handle calculations and distributions. Consequently, institutions can scale their portfolios without proportionally increasing headcount. However, the industry faces substantial operational challenges regarding strict data privacy encryption rules and complex compliance requirements.
  • Because these deployments host highly sensitive financial records, maintaining seamless anti-money laundering protocols constrains rapid adoption among regional lenders. Despite these structural challenges, the continuous integration of predictive risk assessment tools ensures that the market remains central to modernizing institutional credit management and mitigating systemic defaults.

What will be the Size of the Loan Servicing Software Market during the forecast period?

Get Key Insights on Market Forecast (PDF) Get Free Sample

How is the Loan Servicing Software Market Segmented?

The loan servicing software industry research report provides comprehensive data (region-wise segment analysis), with forecasts and estimates in "USD million" for the period 2026-2030, as well as historical data from 2020-2024 for the following segments.

  • Application
    • Banks
    • Credit unions
    • Mortgage lenders
    • Brokers
    • Others
  • Deployment
    • Cloud-based
    • On-premises
  • Component
    • Software
    • Services
  • Sector
    • Large enterprises
    • Small and medium enterprises
  • Geography
    • North America
      • US
      • Canada
      • Mexico
    • Europe
      • Germany
      • UK
      • France
      • Italy
      • Spain
      • The Netherlands
    • APAC
      • China
      • Japan
      • India
      • South Korea
      • Australia
      • Indonesia
    • South America
      • Brazil
      • Argentina
      • Chile
    • Middle East and Africa
      • Saudi Arabia
      • UAE
      • South Africa
      • Israel
      • Turkey

By Application Insights

The banks segment is estimated to witness significant growth during the forecast period.

The banking segment of the Loan Servicing Software industry exhibits robust expansion as institutions modernize complex legacy infrastructures to handle diverse lending portfolios.

Traditional manual workflows are rapidly being replaced by an API-first lending platform that centralizes account management and streamlines operations.

By deploying automated payment processing and real-time account reconciliation capabilities, financial institutions have successfully accelerated transaction speeds and reduced manual data entry errors by 18%.

Furthermore, the integration of end-to-end digital lending solutions allows banks to proactively identify high-risk accounts and mitigate non-performing assets effectively.

This shift enables banks to maintain strict regulatory framework adherence while delivering seamless borrower experiences, ultimately improving operational throughput and minimizing administrative overhead.

Get Free Sample

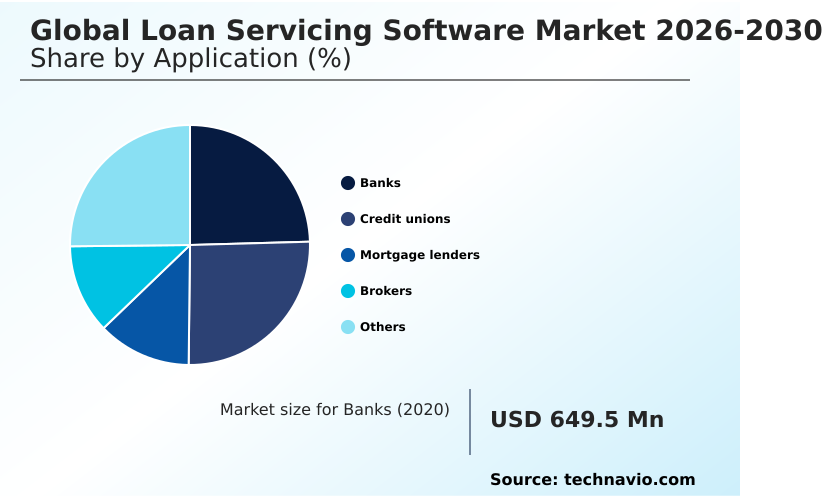
The Banks segment was valued at USD 1.12 billion in 2024 and showed a gradual increase during the forecast period.

Get Free Sample

Regional Analysis

North America is estimated to contribute 49.4% to the growth of the global market during the forecast period.Technavio’s analysts have elaborately explained the regional trends and drivers that shape the market during the forecast period.

See How Loan Servicing Software Market Demand is Rising in North America Get Free Sample

The geographic landscape of the Loan Servicing Software industry reveals distinct adoption trajectories driven by varying regulatory environments and digital maturity.

North America maintains a dominant position, where high volumes of residential mortgages and sophisticated credit scoring models prompt institutions to integrate comprehensive compliance reporting automation.

Consequently, US lenders utilizing these advanced platforms report a 25% improvement in processing throughput compared to their European counterparts. Meanwhile, Europe exhibits steady technological integration focused heavily on data security, extending deployment timelines by approximately 15% relative to North America.

Conversely, the APAC region demonstrates rapid acceleration fueled by mobile-first digital banking strategies and an expanding middle class. Lenders in APAC are aggressively implementing machine learning credit decisioning and interactive mobile dashboards, achieving a 30% reduction in customer onboarding friction.

These regional disparities highlight how localized financial ecosystems dictate the deployment of intelligent portfolio performance analytics and specialized risk mitigation strategies.

Market Dynamics

Our researchers analyzed the data with 2025 as the base year, along with the key drivers, trends, and challenges. A holistic analysis of drivers will help companies refine their marketing strategies to gain a competitive advantage.

  • The modernization of financial administration heavily relies on sophisticated Loan Servicing Software to navigate increasingly complex credit ecosystems. As lending portfolios expand across diverse consumer and commercial segments, institutions prioritize the integration of predictive default risk management models to proactively identify vulnerabilities and optimize collection strategies before accounts become delinquent.
  • This shift toward data-driven oversight fundamentally transforms supply chain financing and consumer credit operations, enabling organizations to achieve a 40% improvement in portfolio stability compared to systems relying exclusively on historical analysis.
  • To support this massive influx of transactional data, IT departments are leveraging cloud infrastructure deployment scalability protocols, ensuring that processing capabilities can dynamically expand during peak origination periods without compromising system performance. Furthermore, managing cross-border financial products requires rigorous adherence to diverse legal standards, prompting the widespread adoption of automated regulatory compliance reporting frameworks.
  • These tools eliminate the manual compilation of audit logs, thereby reducing compliance-related operational overhead by nearly a third. The operational landscape is further refined through robotic process automation task execution, which seamlessly handles repetitive functions such as payment reconciliation and escrow adjustments.
  • Coupled with machine learning borrower credit assessment algorithms that continuously analyze repayment behavior, financial institutions can deliver highly personalized lending experiences while maintaining strict institutional risk parameters.

What are the key market drivers leading to the rise in the adoption of Loan Servicing Software Industry?

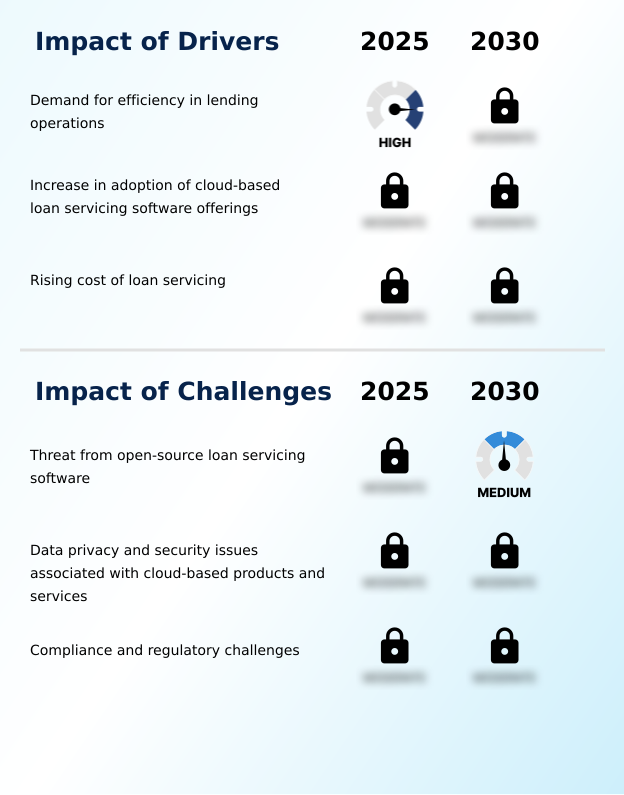
  • The escalating demand for operational efficiency within lending workflows serves as a primary driver propelling industry expansion.

  • The escalating demand for operational efficiency and cost optimization acts as a primary catalyst for Loan Servicing Software adoption. Financial institutions face mounting pressure to manage expansive credit portfolios without proportionally inflating administrative headcount.
  • Consequently, organizations are aggressively implementing automated compliance reporting capabilities to seamlessly execute repetitive tasks such as transaction logging and penalty fee automation.
  • This technological shift directly addresses the rising cost of loan administration, enabling lenders to reduce manual processing hours by an average of 35% while improving overall transaction accuracy by 18%.
  • Furthermore, the critical need for immediate transparency drives the integration of digital payment gateways and automated identity verification engines. By leveraging a comprehensive customer self-service portal, banks empower borrowers to independently manage their accounts, significantly diminishing operational bottlenecks.

What are the market trends shaping the Loan Servicing Software Industry?

  • Strategic partnerships and acquisitions among market participants represent a prominent trend shaping the industry landscape.

  • The Loan Servicing Software landscape is rapidly adopting advanced analytical tools to overhaul traditional credit management. Lenders are increasingly utilizing intelligent default prediction models to analyze historical data and pinpoint potential vulnerabilities before they escalate.
  • This shift toward proactive oversight enables institutions to execute dynamic repayment restructuring plans, resulting in a 22% decrease in overall delinquency rates compared to reactive collection strategies. Financial organizations are also embracing smart contract execution to automate complex variable interest rate calculations securely and transparently.
  • By embedding credit bureau data exchange protocols and advanced non-performing asset reduction strategies, lenders drastically minimize human error and ensure precise billing, fundamentally transforming how consumer and commercial credit portfolios are maintained across the digital ecosystem.

What challenges does the Loan Servicing Software Industry face during its growth?

  • The increasing threat posed by customizable open-source loan servicing platforms constitutes a significant challenge constraining commercial industry growth.

  • Integrating sophisticated Loan Servicing Software presents complex operational challenges, particularly concerning rigorous data security and regulatory compliance. Because these platforms process highly sensitive financial and personal information, managing secure collateral tracking features is critical to prevent catastrophic cyber breaches.
  • The intricate process of executing legacy system modernization often disrupts daily operations, extending deployment schedules by up to 25% and unexpectedly inflating technology transition budgets by 15%. Additionally, navigating the integration of blockchain secure document storage poses significant hurdles for multinational lenders attempting to centralize their databases.
  • The continuous burden of supporting syndicated loan management protocols and generating an accurate audit trail generation strains administrative resources. Consequently, medium-sized institutions often face integration bottlenecks when attempting to synchronize new platforms with existing customer relationship management sync frameworks.

Exclusive Technavio Analysis on Customer Landscape

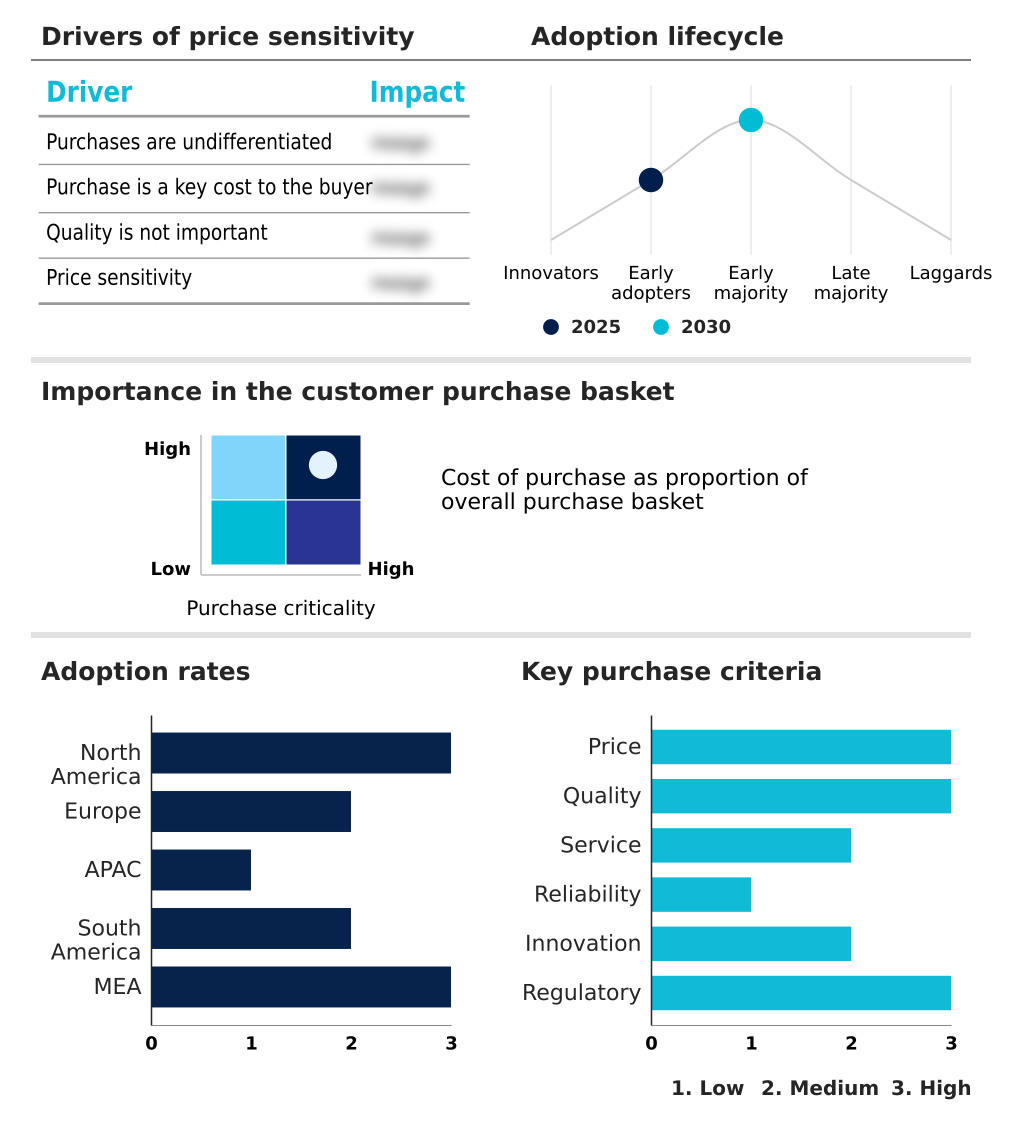
The loan servicing software market forecasting report includes the adoption lifecycle of the market, covering from the innovator’s stage to the laggard’s stage. It focuses on adoption rates in different regions based on penetration. Furthermore, the loan servicing software market report also includes key purchase criteria and drivers of price sensitivity to help companies evaluate and develop their market growth analysis strategies.

Customer Landscape of Loan Servicing Software Industry

Competitive Landscape

Companies are implementing various strategies, such as strategic alliances, loan servicing software market forecast, partnerships, mergers and acquisitions, geographical expansion, and product/service launches, to enhance their presence in the industry.

AutoPal Software - Comprehensive digital solutions streamline repayment scheduling and collateral management, optimizing portfolio performance and empowering financial institutions to oversee complex lending lifecycles with exceptional efficiency.

The industry research and growth report includes detailed analyses of the competitive landscape of the market and information about key companies, including:

  • AutoPal Software
  • Baseline
  • Bryt Software
  • Canopy Servicing
  • Constellation Mortgage Solutions
  • Fidelity National Information
  • Financial Industry Computer
  • Finastra
  • Fiserv Inc.
  • GoldPoint Systems
  • HES FinTech
  • Intercontinental Exchange Inc.
  • Jack Henry and Associates Inc.
  • LendingWise
  • Margill Solutions
  • Nucleus Software Exports Ltd.
  • Peach Finance
  • Sagent M and C LLC
  • Temenos AG
  • TurnKey Lender Inc.

Qualitative and quantitative analysis of companies has been conducted to help clients understand the wider business environment as well as the strengths and weaknesses of key industry players. Data is qualitatively analyzed to categorize companies as pure play, category-focused, industry-focused, and diversified; it is quantitatively analyzed to categorize companies as dominant, leading, strong, tentative, and weak.

Recent Development and News in Loan servicing software market

  • In the Application Software industry, the transition toward microservice architecture adoption has enhanced system modularity, directly impacting Loan Servicing Software demand by enabling highly customizable repayment schedule structuring that improves processing efficiency by over 20%.
  • In the Application Software industry, the implementation of stringent data privacy standards has redefined software architecture, driving Loan Servicing Software providers to overhaul cross-border data transfer protocols to ensure complete compliance across multinational lending portfolios.
  • In the Application Software industry, the integration of artificial intelligence into enterprise resource planning connection frameworks has advanced operational analytics, prompting Loan Servicing Software platforms to embed automated payment reminders that reduce late payment incidences by up to 15%.
  • In the Application Software industry, the accelerated deployment of resilient infrastructure for financial workloads has eliminated on-premise hardware bottlenecks, catalyzing Loan Servicing Software adoption as lenders achieve 99.9% uptime through robust disaster recovery frameworks.

Dive into Technavio’s robust research methodology, blending expert interviews, extensive data synthesis, and validated models for unparalleled Loan Servicing Software Market insights. See full methodology.

Market Scope
Page number 320
Base year 2025
Historic period 2020-2024
Forecast period 2026-2030
Growth momentum & CAGR Accelerate at a CAGR of 13.9%
Market growth 2026-2030 USD 4017.4 million
Market structure Fragmented
YoY growth 2025-2026(%) 12.2%
Key countries US, Canada, Mexico, Germany, UK, France, Italy, Spain, The Netherlands, China, Japan, India, South Korea, Australia, Indonesia, Brazil, Argentina, Chile, Saudi Arabia, UAE, South Africa, Israel and Turkey
Competitive landscape Leading Companies, Market Positioning of Companies, Competitive Strategies, and Industry Risks

Request Free Sample

Research Analyst Overview

  • The continuous evolution of Loan Servicing Software is fundamentally reshaping how institutional lenders approach post-origination account administration. Boardroom executives are increasingly prioritizing the modernization of legacy infrastructures by mandating the integration of sophisticated interest calculation algorithms and dynamic borrower behavior analysis to mitigate financial exposure.
  • This strategic pivot heavily influences corporate budgeting, shifting capital allocations toward platforms that offer comprehensive loan origination integration and real-time auditing capabilities. Consequently, financial organizations deploying an advanced escrow management module alongside automated delinquency tracking system architecture have successfully reduced administrative processing costs by 24% compared to peers utilizing fragmented manual workflows.
  • By analyzing repayment patterns, institutions can optimize their capital reserves and refine their long-term lending strategies. Furthermore, the rising demand for transparency compels lenders to prioritize secure omnichannel borrower communication, ensuring that clients receive immediate updates regarding their financial obligations.
  • This seamless orchestration of digital tools maximizes operational throughput, allowing credit organizations to scale portfolios efficiently while strictly adhering to complex compliance mandates.

What are the Key Data Covered in this Loan Servicing Software Market Research and Growth Report?

  • What is the expected growth of the Loan Servicing Software Market between 2026 and 2030?

    • USD 4.02 billion, at a CAGR of 13.9%

  • What segmentation does the market report cover?

    • The report is segmented by Application (Banks, Credit unions, Mortgage lenders, Brokers, and Others), Deployment (Cloud-based, and On-premises), Component (Software, and Services), Sector (Large enterprises, and Small and medium enterprises) and Geography (North America, Europe, APAC, South America, Middle East and Africa)

  • Which regions are analyzed in the report?

    • North America, Europe, APAC, South America and Middle East and Africa

  • What are the key growth drivers and market challenges?

    • Demand for efficiency in lending operations, Threat from open-source loan servicing software

  • Who are the major players in the Loan Servicing Software Market?

    • AutoPal Software, Baseline, Bryt Software, Canopy Servicing, Constellation Mortgage Solutions, Fidelity National Information, Financial Industry Computer, Finastra, Fiserv Inc., GoldPoint Systems, HES FinTech, Intercontinental Exchange Inc., Jack Henry and Associates Inc., LendingWise, Margill Solutions, Nucleus Software Exports Ltd., Peach Finance, Sagent M and C LLC, Temenos AG and TurnKey Lender Inc.

Market Research Insights

  • The Loan Servicing Software sector is undergoing a profound digital transformation as institutions prioritize operational agility over rigid legacy architectures. By transitioning to subscription-based pricing models, medium-sized lenders have reduced upfront capital technology expenditures by up to 35%, making advanced capabilities highly accessible.
  • Furthermore, the integration of application programming interfaces facilitates seamless data exchange across financial ecosystems, improving cross-departmental data synchronization speed by 28% compared to siloed mainframes. Organizations are actively deploying automated underwriting systems to streamline borrower evaluations, simultaneously leveraging sophisticated document verification workflows to authenticate identities in real time.
  • This concerted shift toward automation not only accelerates turnaround times but also fortifies institutional resilience against fraud, ultimately reducing manual processing errors by over 20%.

We can help! Our analysts can customize this loan servicing software market research report to meet your requirements.

Get in touch

1. Executive Summary

1.1 Market overview

Executive Summary - Chart on Market Overview
Executive Summary - Data Table on Market Overview
Executive Summary - Chart on Global Market Characteristics
Executive Summary - Chart on Market by Geography
Executive Summary - Chart on Market Segmentation by Application
Executive Summary - Chart on Market Segmentation by Deployment
Executive Summary - Chart on Market Segmentation by Component
Executive Summary - Chart on Market Segmentation by Sector
Executive Summary - Chart on Incremental Growth
Executive Summary - Data Table on Incremental Growth
Executive Summary - Chart on Company Market Positioning

2. Technavio Analysis

2.1 Analysis of price sensitivity, lifecycle, customer purchase basket, adoption rates, and purchase criteria

2.2 Criticality of inputs and Factors of differentiation

Chart on Overview on criticality of inputs and factors of differentiation

2.3 Factors of disruption

Chart on Overview on factors of disruption

2.4 Impact of drivers and challenges

Chart on Impact of drivers and challenges in 2025 and 2030

3. Market Landscape

3.1 Market ecosystem

Chart on Parent Market
Data Table on - Parent Market

3.2 Market characteristics

Chart on Market characteristics analysis

3.3 Value chain analysis

Chart on Value chain analysis

4. Market Sizing

4.1 Market definition

Data Table on Offerings of companies included in the market definition

4.2 Market segment analysis

Market segments

4.3 Market size 2025

4.4 Market outlook: Forecast for 2025-2030

Chart on Global - Market size and forecast 2025-2030 ($ million)
Data Table on Global - Market size and forecast 2025-2030 ($ million)
Chart on Global Market: Year-over-year growth 2025-2030 (%)
Data Table on Global Market: Year-over-year growth 2025-2030 (%)

5. Historic Market Size

5.1 Global Loan Servicing Software Market 2020 - 2024

Historic Market Size - Data Table on Global Loan Servicing Software Market 2020 - 2024 ($ million)

5.2 Application segment analysis 2020 - 2024

Historic Market Size - Application Segment 2020 - 2024 ($ million)

5.3 Deployment segment analysis 2020 - 2024

Historic Market Size - Deployment Segment 2020 - 2024 ($ million)

5.4 Component segment analysis 2020 - 2024

Historic Market Size - Component Segment 2020 - 2024 ($ million)

5.5 Sector segment analysis 2020 - 2024

Historic Market Size - Sector Segment 2020 - 2024 ($ million)

5.6 Geography segment analysis 2020 - 2024

Historic Market Size - Geography Segment 2020 - 2024 ($ million)

5.7 Country segment analysis 2020 - 2024

Historic Market Size - Country Segment 2020 - 2024 ($ million)

6. Qualitative Analysis

6.1 Impact of AI on Global Loan Servicing Software Market

6.2 Impact of Geopolitical Conflicts on Global Loan Servicing Software Market

7. Five Forces Analysis

7.1 Five forces summary

Five forces analysis - Comparison between 2025 and 2030

7.2 Bargaining power of buyers

Bargaining power of buyers - Impact of key factors 2025 and 2030

7.3 Bargaining power of suppliers

Bargaining power of suppliers - Impact of key factors in 2025 and 2030

7.4 Threat of new entrants

Threat of new entrants - Impact of key factors in 2025 and 2030

7.5 Threat of substitutes

Threat of substitutes - Impact of key factors in 2025 and 2030

7.6 Threat of rivalry

Threat of rivalry - Impact of key factors in 2025 and 2030

7.7 Market condition

Chart on Market condition - Five forces 2025 and 2030

8. Market Segmentation by Application

8.1 Market segments

Chart on Application - Market share 2025-2030 (%)
Data Table on Application - Market share 2025-2030 (%)

8.2 Comparison by Application

Chart on Comparison by Application
Data Table on Comparison by Application

8.3 Banks - Market size and forecast 2025-2030

Chart on Banks - Market size and forecast 2025-2030 ($ million)
Data Table on Banks - Market size and forecast 2025-2030 ($ million)
Chart on Banks - Year-over-year growth 2025-2030 (%)
Data Table on Banks - Year-over-year growth 2025-2030 (%)

8.4 Credit unions - Market size and forecast 2025-2030

Chart on Credit unions - Market size and forecast 2025-2030 ($ million)
Data Table on Credit unions - Market size and forecast 2025-2030 ($ million)
Chart on Credit unions - Year-over-year growth 2025-2030 (%)
Data Table on Credit unions - Year-over-year growth 2025-2030 (%)

8.5 Mortgage lenders - Market size and forecast 2025-2030

Chart on Mortgage lenders - Market size and forecast 2025-2030 ($ million)
Data Table on Mortgage lenders - Market size and forecast 2025-2030 ($ million)
Chart on Mortgage lenders - Year-over-year growth 2025-2030 (%)
Data Table on Mortgage lenders - Year-over-year growth 2025-2030 (%)

8.6 Brokers - Market size and forecast 2025-2030

Chart on Brokers - Market size and forecast 2025-2030 ($ million)
Data Table on Brokers - Market size and forecast 2025-2030 ($ million)
Chart on Brokers - Year-over-year growth 2025-2030 (%)
Data Table on Brokers - Year-over-year growth 2025-2030 (%)

8.7 Others - Market size and forecast 2025-2030

Chart on Others - Market size and forecast 2025-2030 ($ million)
Data Table on Others - Market size and forecast 2025-2030 ($ million)
Chart on Others - Year-over-year growth 2025-2030 (%)
Data Table on Others - Year-over-year growth 2025-2030 (%)

8.8 Market opportunity by Application

Market opportunity by Application ($ million)
Data Table on Market opportunity by Application ($ million)

9. Market Segmentation by Deployment

9.1 Market segments

Chart on Deployment - Market share 2025-2030 (%)
Data Table on Deployment - Market share 2025-2030 (%)

9.2 Comparison by Deployment

Chart on Comparison by Deployment
Data Table on Comparison by Deployment

9.3 Cloud-based - Market size and forecast 2025-2030

Chart on Cloud-based - Market size and forecast 2025-2030 ($ million)
Data Table on Cloud-based - Market size and forecast 2025-2030 ($ million)
Chart on Cloud-based - Year-over-year growth 2025-2030 (%)
Data Table on Cloud-based - Year-over-year growth 2025-2030 (%)

9.4 On-premises - Market size and forecast 2025-2030

Chart on On-premises - Market size and forecast 2025-2030 ($ million)
Data Table on On-premises - Market size and forecast 2025-2030 ($ million)
Chart on On-premises - Year-over-year growth 2025-2030 (%)
Data Table on On-premises - Year-over-year growth 2025-2030 (%)

9.5 Market opportunity by Deployment

Market opportunity by Deployment ($ million)
Data Table on Market opportunity by Deployment ($ million)

10. Market Segmentation by Component

10.1 Market segments

Chart on Component - Market share 2025-2030 (%)
Data Table on Component - Market share 2025-2030 (%)

10.2 Comparison by Component

Chart on Comparison by Component
Data Table on Comparison by Component

10.3 Software - Market size and forecast 2025-2030

Chart on Software - Market size and forecast 2025-2030 ($ million)
Data Table on Software - Market size and forecast 2025-2030 ($ million)
Chart on Software - Year-over-year growth 2025-2030 (%)
Data Table on Software - Year-over-year growth 2025-2030 (%)

10.4 Services - Market size and forecast 2025-2030

Chart on Services - Market size and forecast 2025-2030 ($ million)
Data Table on Services - Market size and forecast 2025-2030 ($ million)
Chart on Services - Year-over-year growth 2025-2030 (%)
Data Table on Services - Year-over-year growth 2025-2030 (%)

10.5 Market opportunity by Component

Market opportunity by Component ($ million)
Data Table on Market opportunity by Component ($ million)

11. Market Segmentation by Sector

11.1 Market segments

Chart on Sector - Market share 2025-2030 (%)
Data Table on Sector - Market share 2025-2030 (%)

11.2 Comparison by Sector

Chart on Comparison by Sector
Data Table on Comparison by Sector

11.3 Large enterprises - Market size and forecast 2025-2030

Chart on Large enterprises - Market size and forecast 2025-2030 ($ million)
Data Table on Large enterprises - Market size and forecast 2025-2030 ($ million)
Chart on Large enterprises - Year-over-year growth 2025-2030 (%)
Data Table on Large enterprises - Year-over-year growth 2025-2030 (%)

11.4 Small and medium enterprises - Market size and forecast 2025-2030

Chart on Small and medium enterprises - Market size and forecast 2025-2030 ($ million)
Data Table on Small and medium enterprises - Market size and forecast 2025-2030 ($ million)
Chart on Small and medium enterprises - Year-over-year growth 2025-2030 (%)
Data Table on Small and medium enterprises - Year-over-year growth 2025-2030 (%)

11.5 Market opportunity by Sector

Market opportunity by Sector ($ million)
Data Table on Market opportunity by Sector ($ million)

12. Customer Landscape

12.1 Customer landscape overview

Analysis of price sensitivity, lifecycle, customer purchase basket, adoption rates, and purchase criteria

13. Geographic Landscape

13.1 Geographic segmentation

Chart on Market share by geography 2025-2030 (%)
Data Table on Market share by geography 2025-2030 (%)

13.2 Geographic comparison

Chart on Geographic comparison
Data Table on Geographic comparison

13.3 North America - Market size and forecast 2025-2030

Chart on North America - Market size and forecast 2025-2030 ($ million)
Data Table on North America - Market size and forecast 2025-2030 ($ million)
Chart on North America - Year-over-year growth 2025-2030 (%)
Data Table on North America - Year-over-year growth 2025-2030 (%)
Chart on Regional Comparison - North America
Data Table on Regional Comparison - North America

13.3.1 US - Market size and forecast 2025-2030

Chart on US - Market size and forecast 2025-2030 ($ million)
Data Table on US - Market size and forecast 2025-2030 ($ million)
Chart on US - Year-over-year growth 2025-2030 (%)
Data Table on US - Year-over-year growth 2025-2030 (%)

13.3.2 Canada - Market size and forecast 2025-2030

Chart on Canada - Market size and forecast 2025-2030 ($ million)
Data Table on Canada - Market size and forecast 2025-2030 ($ million)
Chart on Canada - Year-over-year growth 2025-2030 (%)
Data Table on Canada - Year-over-year growth 2025-2030 (%)

13.3.3 Mexico - Market size and forecast 2025-2030

Chart on Mexico - Market size and forecast 2025-2030 ($ million)
Data Table on Mexico - Market size and forecast 2025-2030 ($ million)
Chart on Mexico - Year-over-year growth 2025-2030 (%)
Data Table on Mexico - Year-over-year growth 2025-2030 (%)

13.4 Europe - Market size and forecast 2025-2030

Chart on Europe - Market size and forecast 2025-2030 ($ million)
Data Table on Europe - Market size and forecast 2025-2030 ($ million)
Chart on Europe - Year-over-year growth 2025-2030 (%)
Data Table on Europe - Year-over-year growth 2025-2030 (%)
Chart on Regional Comparison - Europe
Data Table on Regional Comparison - Europe

13.4.1 Germany - Market size and forecast 2025-2030

Chart on Germany - Market size and forecast 2025-2030 ($ million)
Data Table on Germany - Market size and forecast 2025-2030 ($ million)
Chart on Germany - Year-over-year growth 2025-2030 (%)
Data Table on Germany - Year-over-year growth 2025-2030 (%)

13.4.2 UK - Market size and forecast 2025-2030

Chart on UK - Market size and forecast 2025-2030 ($ million)
Data Table on UK - Market size and forecast 2025-2030 ($ million)
Chart on UK - Year-over-year growth 2025-2030 (%)
Data Table on UK - Year-over-year growth 2025-2030 (%)

13.4.3 France - Market size and forecast 2025-2030

Chart on France - Market size and forecast 2025-2030 ($ million)
Data Table on France - Market size and forecast 2025-2030 ($ million)
Chart on France - Year-over-year growth 2025-2030 (%)
Data Table on France - Year-over-year growth 2025-2030 (%)

13.4.4 Italy - Market size and forecast 2025-2030

Chart on Italy - Market size and forecast 2025-2030 ($ million)
Data Table on Italy - Market size and forecast 2025-2030 ($ million)
Chart on Italy - Year-over-year growth 2025-2030 (%)
Data Table on Italy - Year-over-year growth 2025-2030 (%)

13.4.5 Spain - Market size and forecast 2025-2030

Chart on Spain - Market size and forecast 2025-2030 ($ million)
Data Table on Spain - Market size and forecast 2025-2030 ($ million)
Chart on Spain - Year-over-year growth 2025-2030 (%)
Data Table on Spain - Year-over-year growth 2025-2030 (%)

13.4.6 The Netherlands - Market size and forecast 2025-2030

Chart on The Netherlands - Market size and forecast 2025-2030 ($ million)
Data Table on The Netherlands - Market size and forecast 2025-2030 ($ million)
Chart on The Netherlands - Year-over-year growth 2025-2030 (%)
Data Table on The Netherlands - Year-over-year growth 2025-2030 (%)

13.5 APAC - Market size and forecast 2025-2030

Chart on APAC - Market size and forecast 2025-2030 ($ million)
Data Table on APAC - Market size and forecast 2025-2030 ($ million)
Chart on APAC - Year-over-year growth 2025-2030 (%)
Data Table on APAC - Year-over-year growth 2025-2030 (%)
Chart on Regional Comparison - APAC
Data Table on Regional Comparison - APAC

13.5.1 China - Market size and forecast 2025-2030

Chart on China - Market size and forecast 2025-2030 ($ million)
Data Table on China - Market size and forecast 2025-2030 ($ million)
Chart on China - Year-over-year growth 2025-2030 (%)
Data Table on China - Year-over-year growth 2025-2030 (%)

13.5.2 Japan - Market size and forecast 2025-2030

Chart on Japan - Market size and forecast 2025-2030 ($ million)
Data Table on Japan - Market size and forecast 2025-2030 ($ million)
Chart on Japan - Year-over-year growth 2025-2030 (%)
Data Table on Japan - Year-over-year growth 2025-2030 (%)

13.5.3 India - Market size and forecast 2025-2030

Chart on India - Market size and forecast 2025-2030 ($ million)
Data Table on India - Market size and forecast 2025-2030 ($ million)
Chart on India - Year-over-year growth 2025-2030 (%)
Data Table on India - Year-over-year growth 2025-2030 (%)

13.5.4 South Korea - Market size and forecast 2025-2030

Chart on South Korea - Market size and forecast 2025-2030 ($ million)
Data Table on South Korea - Market size and forecast 2025-2030 ($ million)
Chart on South Korea - Year-over-year growth 2025-2030 (%)
Data Table on South Korea - Year-over-year growth 2025-2030 (%)

13.5.5 Australia - Market size and forecast 2025-2030

Chart on Australia - Market size and forecast 2025-2030 ($ million)
Data Table on Australia - Market size and forecast 2025-2030 ($ million)
Chart on Australia - Year-over-year growth 2025-2030 (%)
Data Table on Australia - Year-over-year growth 2025-2030 (%)

13.5.6 Indonesia - Market size and forecast 2025-2030

Chart on Indonesia - Market size and forecast 2025-2030 ($ million)
Data Table on Indonesia - Market size and forecast 2025-2030 ($ million)
Chart on Indonesia - Year-over-year growth 2025-2030 (%)
Data Table on Indonesia - Year-over-year growth 2025-2030 (%)

13.6 South America - Market size and forecast 2025-2030

Chart on South America - Market size and forecast 2025-2030 ($ million)
Data Table on South America - Market size and forecast 2025-2030 ($ million)
Chart on South America - Year-over-year growth 2025-2030 (%)
Data Table on South America - Year-over-year growth 2025-2030 (%)
Chart on Regional Comparison - South America
Data Table on Regional Comparison - South America

13.6.1 Brazil - Market size and forecast 2025-2030

Chart on Brazil - Market size and forecast 2025-2030 ($ million)
Data Table on Brazil - Market size and forecast 2025-2030 ($ million)
Chart on Brazil - Year-over-year growth 2025-2030 (%)
Data Table on Brazil - Year-over-year growth 2025-2030 (%)

13.6.2 Argentina - Market size and forecast 2025-2030

Chart on Argentina - Market size and forecast 2025-2030 ($ million)
Data Table on Argentina - Market size and forecast 2025-2030 ($ million)
Chart on Argentina - Year-over-year growth 2025-2030 (%)
Data Table on Argentina - Year-over-year growth 2025-2030 (%)

13.6.3 Chile - Market size and forecast 2025-2030

Chart on Chile - Market size and forecast 2025-2030 ($ million)
Data Table on Chile - Market size and forecast 2025-2030 ($ million)
Chart on Chile - Year-over-year growth 2025-2030 (%)
Data Table on Chile - Year-over-year growth 2025-2030 (%)

13.7 Middle East and Africa - Market size and forecast 2025-2030

Chart on Middle East and Africa - Market size and forecast 2025-2030 ($ million)
Data Table on Middle East and Africa - Market size and forecast 2025-2030 ($ million)
Chart on Middle East and Africa - Year-over-year growth 2025-2030 (%)
Data Table on Middle East and Africa - Year-over-year growth 2025-2030 (%)
Chart on Regional Comparison - Middle East and Africa
Data Table on Regional Comparison - Middle East and Africa

13.7.1 Saudi Arabia - Market size and forecast 2025-2030

Chart on Saudi Arabia - Market size and forecast 2025-2030 ($ million)
Data Table on Saudi Arabia - Market size and forecast 2025-2030 ($ million)
Chart on Saudi Arabia - Year-over-year growth 2025-2030 (%)
Data Table on Saudi Arabia - Year-over-year growth 2025-2030 (%)

13.7.2 UAE - Market size and forecast 2025-2030

Chart on UAE - Market size and forecast 2025-2030 ($ million)
Data Table on UAE - Market size and forecast 2025-2030 ($ million)
Chart on UAE - Year-over-year growth 2025-2030 (%)
Data Table on UAE - Year-over-year growth 2025-2030 (%)

13.7.3 South Africa - Market size and forecast 2025-2030

Chart on South Africa - Market size and forecast 2025-2030 ($ million)
Data Table on South Africa - Market size and forecast 2025-2030 ($ million)
Chart on South Africa - Year-over-year growth 2025-2030 (%)
Data Table on South Africa - Year-over-year growth 2025-2030 (%)

13.7.4 Israel - Market size and forecast 2025-2030

Chart on Israel - Market size and forecast 2025-2030 ($ million)
Data Table on Israel - Market size and forecast 2025-2030 ($ million)
Chart on Israel - Year-over-year growth 2025-2030 (%)
Data Table on Israel - Year-over-year growth 2025-2030 (%)

13.7.5 Turkey - Market size and forecast 2025-2030

Chart on Turkey - Market size and forecast 2025-2030 ($ million)
Data Table on Turkey - Market size and forecast 2025-2030 ($ million)
Chart on Turkey - Year-over-year growth 2025-2030 (%)
Data Table on Turkey - Year-over-year growth 2025-2030 (%)

13.8 Market opportunity by geography

Market opportunity by geography ($ million)
Data Tables on Market opportunity by geography ($ million)

14. Drivers, Challenges, and Opportunity

14.1 Market drivers

Demand for efficiency in lending operations
Increase in adoption of cloud-based loan servicing software offerings
Rising cost of loan servicing

14.2 Market challenges

Threat from open-source loan servicing software
Data privacy and security issues associated with cloud-based products and services
Compliance and regulatory challenges

14.3 Impact of drivers and challenges

Impact of drivers and challenges in 2025 and 2030

14.4 Market opportunities

Strategic partnerships and acquisitions between market participants
Use of advanced technologies
Utilization of analytics in lending industry

15. Competitive Landscape

15.1 Overview

15.2

Overview on criticality of inputs and factors of differentiation

15.3 Landscape disruption

Overview on factors of disruption

15.4 Industry risks

Impact of key risks on business

16. Competitive Analysis

16.1 Companies profiled

Companies covered

16.2 Company ranking index

16.3 Market positioning of companies

Matrix on companies position and classification

16.4 Baseline

Baseline - Overview
Baseline - Product / Service
Baseline - Key offerings
SWOT

16.5 Canopy Servicing

Canopy Servicing - Overview
Canopy Servicing - Product / Service
Canopy Servicing - Key offerings
SWOT

16.6 Fidelity National Information

Fidelity National Information - Overview
Fidelity National Information - Business segments
Fidelity National Information - Key offerings
Fidelity National Information - Segment focus
SWOT

16.7 Financial Industry Computer

Financial Industry Computer - Overview
Financial Industry Computer - Product / Service
Financial Industry Computer - Key offerings
SWOT

16.8 Finastra

Finastra - Overview
Finastra - Product / Service
Finastra - Key offerings
SWOT

16.9 Fiserv Inc.

Fiserv Inc. - Overview
Fiserv Inc. - Business segments
Fiserv Inc. - Key news
Fiserv Inc. - Key offerings
Fiserv Inc. - Segment focus
SWOT

16.10 Intercontinental Exchange Inc.

Intercontinental Exchange Inc. - Overview
Intercontinental Exchange Inc. - Business segments
Intercontinental Exchange Inc. - Key offerings
Intercontinental Exchange Inc. - Segment focus
SWOT

16.11 Jack Henry and Associates Inc.

Jack Henry and Associates Inc. - Overview
Jack Henry and Associates Inc. - Business segments
Jack Henry and Associates Inc. - Key offerings
Jack Henry and Associates Inc. - Segment focus
SWOT

16.12 LendingWise

LendingWise - Overview
LendingWise - Product / Service
LendingWise - Key offerings
SWOT

16.13 Margill Solutions

Margill Solutions - Overview
Margill Solutions - Product / Service
Margill Solutions - Key offerings
SWOT

16.14 Nucleus Software Exports Ltd.

Nucleus Software Exports Ltd. - Overview
Nucleus Software Exports Ltd. - Product / Service
Nucleus Software Exports Ltd. - Key offerings
SWOT

16.15 Peach Finance

Peach Finance - Overview
Peach Finance - Product / Service
Peach Finance - Key offerings
SWOT

16.16 Sagent M and C LLC

Sagent M and C LLC - Overview
Sagent M and C LLC - Product / Service
Sagent M and C LLC - Key offerings
SWOT

16.17 Temenos AG

Temenos AG - Overview
Temenos AG - Product / Service
Temenos AG - Key offerings
SWOT

16.18 TurnKey Lender Inc.

TurnKey Lender Inc. - Overview
TurnKey Lender Inc. - Product / Service
TurnKey Lender Inc. - Key offerings
SWOT

17. Appendix

17.1 Scope of the report

Market definition
Objectives
Notes and caveats

17.2 Inclusions and exclusions checklist

Inclusions checklist
Exclusions checklist

17.3 Currency conversion rates for US$

17.4 Research methodology

17.5 Data procurement

Information sources

17.6 Data validation

17.7 Validation techniques employed for market sizing

17.8 Data synthesis

17.9 360 degree market analysis

17.10 List of abbreviations

Research Methodology

Technavio presents a detailed picture of the market by way of study, synthesis, and summation of data from multiple sources. The analysts have presented the various facets of the market with a particular focus on identifying the key industry influencers. The data thus presented is comprehensive, reliable, and the result of extensive research, both primary and secondary.

INFORMATION SOURCES

Primary sources

  • Manufacturers and suppliers
  • Channel partners
  • Industry experts
  • Strategic decision makers

Secondary sources

  • Industry journals and periodicals
  • Government data
  • Financial reports of key industry players
  • Historical data
  • Press releases

DATA ANALYSIS

Data Synthesis

  • Collation of data
  • Estimation of key figures
  • Analysis of derived insights

Data Validation

  • Triangulation with data models
  • Reference against proprietary databases
  • Corroboration with industry experts

REPORT WRITING

Qualitative

  • Market drivers
  • Market challenges
  • Market trends
  • Five forces analysis

Quantitative

  • Market size and forecast
  • Market segmentation
  • Geographical insights
  • Competitive landscape

Interested in this report?

Get your sample now to see our research methodology and insights!

Download Now

Frequently Asked Questions

Loan Servicing Software market growth will increase by USD 4017.4 million during 2026-2030.

The Loan Servicing Software market is expected to grow at a CAGR of 13.9% during 2026-2030.

Loan Servicing Software market is segmented by Application (Banks, Credit unions, Mortgage lenders, Brokers, Others) Deployment (Cloud-based, On-premises) Component (Software, Services) Sector (Large enterprises, Small and medium enterprises)

AutoPal Software, Baseline, Bryt Software, Canopy Servicing, Constellation Mortgage Solutions, Fidelity National Information, Financial Industry Computer, Finastra, Fiserv Inc., GoldPoint Systems, HES FinTech, Intercontinental Exchange Inc., Jack Henry and Associates Inc., LendingWise, Margill Solutions, Nucleus Software Exports Ltd., Peach Finance, Sagent M and C LLC, Temenos AG, TurnKey Lender Inc. are a few of the key vendors in the Loan Servicing Software market.

North America will register the highest growth rate of 49.4% among the other regions. Therefore, the Loan Servicing Software market in North America is expected to garner significant business opportunities for the vendors during the forecast period.

US, Canada, Mexico, Germany, UK, France, Italy, Spain, The Netherlands, China, Japan, India, South Korea, Australia, Indonesia, Brazil, Argentina, Chile, Saudi Arabia, UAE, South Africa, Israel, Turkey

  • Demand for efficiency in lending operations is the driving factor this market.

The Loan Servicing Software market vendors should focus on grabbing business opportunities from the Application segment as it accounted for the largest market share in the base year.
RIA - Research AI Assistant
Ask RIA