
Low-Concentration Atropine Market Size 2024-2028
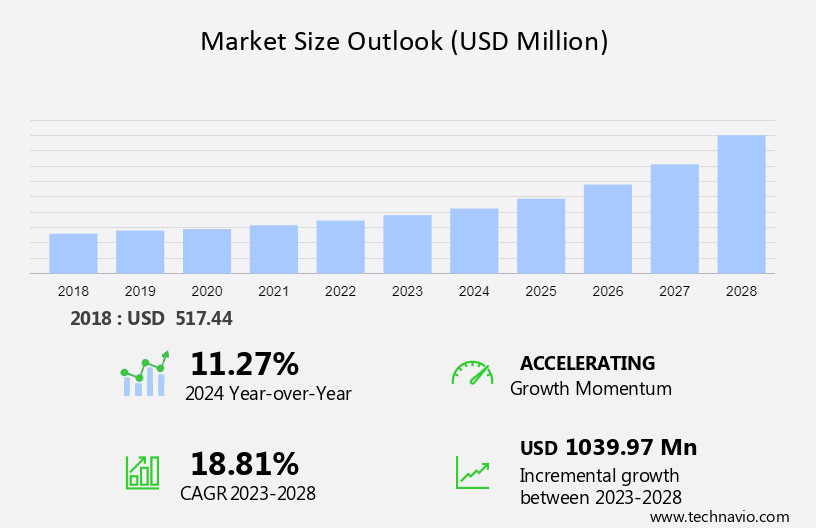
The low-concentration atropine market size is forecast to increase by USD 1.04 billion, at a CAGR of 18.81% between 2023 and 2028.
- The market is experiencing significant growth, driven by the increasing prevalence of myopia and presbyopia.. Myopia, or nearsightedness, is a refractive error that affects millions worldwide, leading to an escalating demand for effective treatments. Market companies are responding by conducting an increasing number of clinical trials to develop and refine low-concentration atropine as a potential solution. However, the market faces challenges. Side effects and uncertainty in the efficacy of low-concentration atropine remain obstacles to widespread adoption. Despite these challenges, the market holds immense potential for companies seeking to capitalize on the growing demand for myopia treatments. Strategic investments in research and development, as well as a focus on addressing the concerns surrounding side effects and efficacy, will be crucial for market success.
- Companies that can effectively navigate these challenges and deliver safe, effective low-concentration atropine treatments will be well-positioned to capture market share and drive growth in this dynamic and evolving market.
Quick Stats of Low-Concentration Atropine Market
- Incremental Value (2024-2028): USD 1.04 billion
- Forecast CAGR: 18.81%
- Historic Value (2018): USD 517.4 million
- Leading Market Segment in 2024: SUV Segment
- Key Growth Region: North America (fastest-growing market with a 31%)
What will be the Size of the Low-Concentration Atropine Market during the forecast period?
Explore in-depth regional segment analysis with market size data - historical 2018-2022 and forecasts 2024-2028 - in the full report.
Request Free Sample
The market continues to evolve, driven by the ongoing research and development in the ophthalmic sector. Atropine, a quaternary ammonium compound, is widely used for its mydriatic and cycloplegic effects in various applications. Its safety profile and ocular bioavailability make it an essential component in dry eye treatment and ophthalmic examinations. Regulatory compliance plays a crucial role in the market dynamics, with regulatory bodies ensuring the drug's safety and efficacy. Pupillary diameter and intraocular pressure are critical factors in determining the appropriate atropine concentration for specific applications. The dose-response relationship and patient demographics are essential considerations in clinical trials, which provide valuable data on visual acuity testing, refraction accuracy, and side effect profile.
Age-related changes and ocular toxicity are ongoing concerns in the market, with research focusing on minimizing side effects and improving patient compliance. The pharmacokinetic profile and photophobia incidence are essential factors in the development of eye drop formulations and drug delivery systems. The ongoing clinical trials data and prescribing information provide insights into the drug's efficacy and safety, shaping treatment guidelines and patient expectations. The market's continuous dynamism is reflected in the evolving patterns of patient demographics, treatment duration, and side effect profiles. Ongoing research into the drug's interaction with other medications and accommodation response further highlights the importance of regulatory compliance and clinical efficacy in the market.
How is this Low-Concentration Atropine Industry segmented?
The low-concentration atropine industry research report provides comprehensive data (region-wise segment analysis), with forecasts and estimates in "USD million" for the period 2024-2028, as well as historical data from 2018-2022 for the following segments.
- Type
- Atropine sulfate 0.01 percentage
- Atropine sulfate 0.025 percentage
- Atropine sulfate 0.05 percentage
- Application
- Child
- Adult
- Distribution Channel
- Hospital Pharmacies
- Retail Pharmacies
- Online Pharmacies
- Ophthalmology Clinics
- Geography
- North America
- US
- Canada
- Europe
- Germany
- APAC
- China
- Japan
- Rest of World (ROW)
- North America
By Type Insights
The atropine sulfate 0.01 percentage segment is estimated to witness significant growth during the forecast period.
The atropine sulfate 0.01% segment in the ophthalmic solutions market is experiencing growth due to ongoing clinical research focusing on its use to reduce progressive myopia among children and adults. Atropine sulfate 0.01% is an ophthalmic solution designed for topical use in the eye, primarily employed for pupil dilation prior to examinations, surgeries, or myopia treatment. This concentration has demonstrated minimal side effects in children aged 4 to 12 years during treatment, making it a preferred choice. The increasing concern regarding pathological myopia has fueled interest in research studies aiming to slow myopia progression among children, thereby driving market growth.
Atropine sulfate 0.01% is a crucial component in ophthalmic applications, with its mydriasis effect contributing to improved visual acuity testing and refraction accuracy. Its safety profile, including minimal ocular toxicity and age-related changes, adds to its appeal. Regulatory compliance is ensured through rigorous testing for pupillary diameter and ocular bioavailability, ensuring consistent clinical efficacy. The dose-response relationship of atropine sulfate 0.01% is well-established, with patient demographics and intraocular pressure influencing treatment duration and side effect profile. Patient compliance is crucial, with proper administration and regular testing for blurred vision, photophobia incidence, and accommodation response essential for optimal treatment outcomes.
In the realm of drug delivery systems, atropine sulfate 0.01% eye drops offer a convenient and effective method for administration. Its cycloplegic effect, which inhibits accommodation response, is a critical factor in enabling precise visual acuity testing and refraction accuracy. The pharmacokinetic profile of atropine sulfate 0.01% is well-understood, with ongoing research focusing on improving patient outcomes and expanding its therapeutic applications.
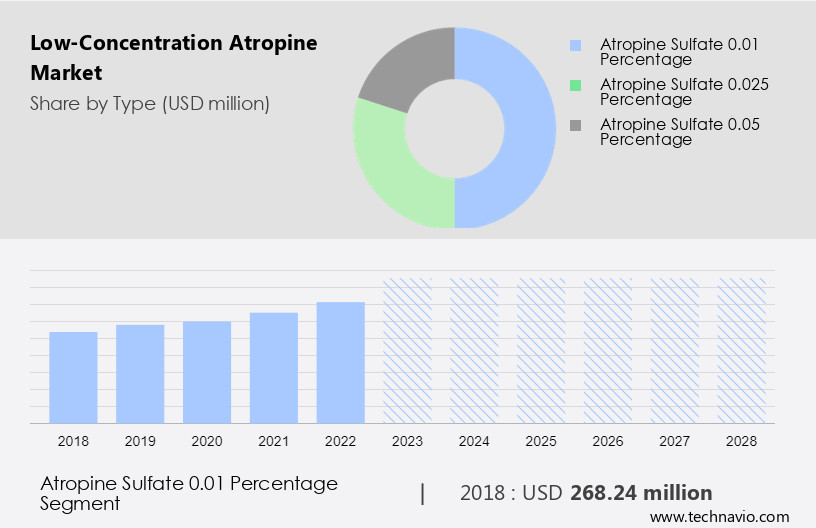
The Atropine sulfate 0.01 percentage segment was valued at USD 268.24 billion in 2018 and showed a gradual increase during the forecast period.
Regional Analysis
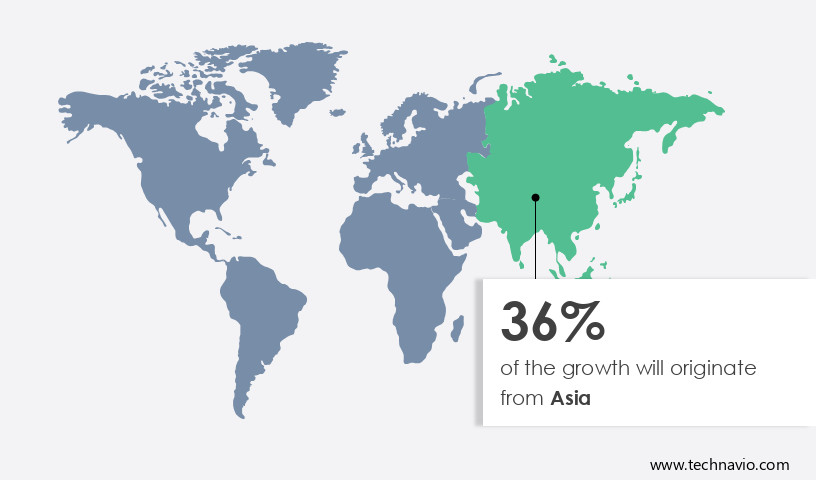
Asia is estimated to contribute 36% to the growth of the global market during the forecast period.Technavio's analysts have elaborately explained the regional trends and drivers that shape the market during the forecast period.
The market is experiencing notable growth due to the increasing prevalence of eye disorders, particularly myopia, and the rising awareness of their significance. In regions like Asia, the market is driven by the increasing burden of eye diseases and the poor healthcare infrastructure in countries such as China and India. However, the market is expected to face challenges due to the rising cost of therapeutics and the need for regulatory compliance. Ophthalmic applications, including mydriasis and cycloplegia, are the primary indications for low-concentration Atropine. The drug's safety profile, including its low incidence of photophobia and blurred vision, makes it a preferred choice for patients.
However, drug interactions and age-related changes in ocular bioavailability and intraocular pressure require careful consideration in treatment guidelines. Clinical trials have demonstrated the clinical efficacy of low-concentration Atropine in improving visual acuity and refraction accuracy. The drug's dose-response relationship and patient demographics, including those with dry eyes, are crucial factors in determining its effectiveness. Patient compliance and treatment duration are also essential considerations, as is the drug's side effect profile, which includes ocular accommodation and accommodation response. Regulatory compliance and safety concerns, including ocular toxicity, are critical factors in the market. Prescribing information and pharmacokinetic profiles are essential for ensuring safe and effective use.
The market is expected to witness continued growth due to the increasing demand for effective ophthalmic solutions and the ongoing development of innovative drug delivery systems.
Market Dynamics
Our researchers analyzed the data with 2023 as the base year, along with the key drivers, trends, and challenges. A holistic analysis of drivers will help companies refine their marketing strategies to gain a competitive advantage.
B2B atropine supply solutions leverage advanced ophthalmic formulation technologies for efficacy. Low-concentration atropine market growth opportunities 2025 include atropine for myopia control and pediatric atropine eye drops, meeting rising demand. Atropine supply chain software optimizes operations, while low-concentration atropine market competitive analysis highlights key players like Bausch Lomb and Santen Pharmaceutical. Sustainable atropine production practices align with eco-friendly pharmaceutical trends. Low-concentration atropine regulations 2024-2028 shape atropine demand in Asia-Pacific 2025. Premium atropine solutions and low-concentration atropine market insights boost adoption. Atropine for pediatric optometry and customized atropine formulations target niches. Low-concentration atropine market challenges and solutions address side effects, with direct procurement strategies for atropine and atropine pricing optimization enhancing profitability. Data-driven atropine market analytics and myopia management trends drive innovation.
What are the key market drivers leading to the rise in the adoption of Low-Concentration Atropine Industry?
- The rising prevalence of myopia serves as the primary market driver. The global prevalence of refractive errors, particularly myopia, is experiencing a significant increase, with approximately 2.2 billion people currently affected by near or distant vision impairment according to the World Health Organization (WHO). Uncorrected refractive errors, including myopia, remain the leading cause of distance vision impairment worldwide. Myopia, also known as nearsightedness, has seen a three-fold increase in prevalence between 2020 and is projected to affect half of the global population by 2050. In addressing this growing health concern, ophthalmic solutions and drug delivery systems have emerged as critical treatment options. Clinical efficacy is a crucial factor in the selection of ophthalmic solutions for myopia treatment.
- Low-concentration atropine, an ophthalmic drug, has gained attention due to its potential long-term effects on myopia progression. However, it is essential to consider drug interactions and treatment guidelines when prescribing and administering low-concentration atropine through eye drop formulations. Visual acuity testing is a necessary component of monitoring the effectiveness and safety of the treatment. In summary, the increasing prevalence of myopia necessitates the development and implementation of effective treatment options, such as low-concentration atropine eye drops. Ensuring clinical efficacy, considering drug interactions, and implementing proper treatment guidelines are essential in maintaining the safety and efficacy of this ophthalmic application.
What are the market trends shaping the Low-Concentration Atropine Industry?
- The increasing prevalence of clinical trials conducted by market companies represents a significant market trend. This trend underscores the growing importance of innovation and research in the industry.
- The market is witnessing significant growth due to the increasing focus on developing new therapeutics for dry eyes and myopia. Pharmaceutical and biopharmaceutical companies are investing heavily in research and development to create advanced treatments for various eye diseases. One such development is the ongoing clinical trials for low-dose atropine solutions, including Vyluma's NVK002. In October 2023, Vyluma announced the second stage results of Phase III of the CHAMP Study, which demonstrated the efficacy of NVK002 in myopia progression. The New Drug Application for NVK002 is currently under FDA review, with a decision anticipated in January 2024.
- The safety profile and mydriasis effect of low-concentration atropine solutions make them an attractive option for treating eye conditions. Regulatory compliance and understanding the dose-response relationship, pupillary diameter, and ocular bioavailability are crucial factors influencing market dynamics. Patient demographics and intraocular pressure are also essential considerations for market growth. Despite the challenges, companies are emphasizing harmonious collaborations and immersive research to strike a balance between safety and efficacy.
What challenges does the Low-Concentration Atropine Industry face during its growth?
- The challenge of addressing side effects and uncertainty in the efficacy of low-concentration atropine is a significant issue impeding the growth of the industry.
- Low-concentration atropine is an emerging therapy for myopia progression, yet the optimal concentration for effective results remains uncertain. A 0.01% concentration of atropine exhibited limited efficacy. Ocular side effects, including mydriasis leading to photophobia, blurred near vision, and local allergic responses, are primary concerns. Prolonged use of low-concentration atropine can cause dilated pupils, dry or irritated eyes, headaches, altered mental status, dry mouth, urinary retention, constipation, and flushing skin. These side effects may deter patients from adopting low-concentration atropine and instead opt for alternatives with fewer severe side effects.
- Clinical trials data and pharmacokinetic profile studies are essential to establish the safety and efficacy of low-concentration atropine. Prescribing information should clearly outline potential side effects and their management. Near vision testing and refraction accuracy are crucial to monitor the progression of myopia and ensure proper dosage adjustments. Patient compliance is vital for successful treatment outcomes.
Exclusive Customer Landscape
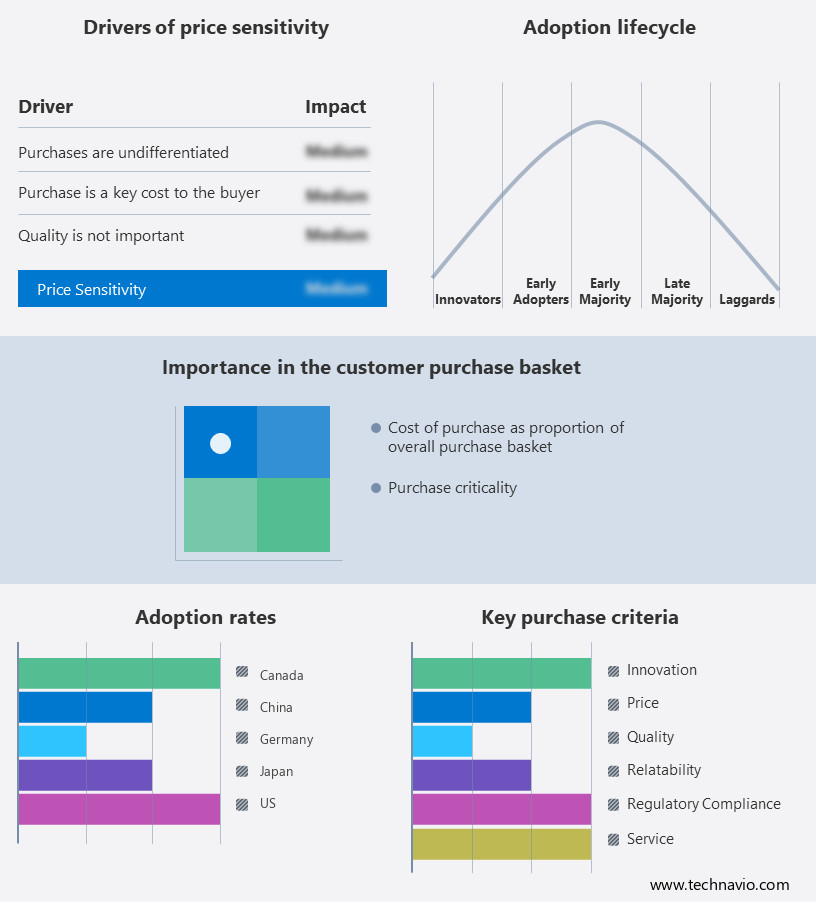
The low-concentration atropine market forecasting report includes the adoption lifecycle of the market, covering from the innovator's stage to the laggard's stage. It focuses on adoption rates in different regions based on penetration. Furthermore, the low-concentration atropine market report also includes key purchase criteria and drivers of price sensitivity to help companies evaluate and develop their market growth analysis strategies.
Customer Landscape
Key Companies & Market Insights
Companies are implementing various strategies, such as strategic alliances, low-concentration atropine market forecast, partnerships, mergers and acquisitions, geographical expansion, and product/service launches, to enhance their presence in the industry.
AdvaCare Pharma - The company specializes in providing low concentration atropine solutions, including AtroCare, for various medical applications. This medication offers therapeutic benefits for patients, contributing to improved healthcare outcomes. The research analyst perspective highlights the potential value of these offerings in the global healthcare market.
The industry research and growth report includes detailed analyses of the competitive landscape of the market and information about key companies, including:
- AdvaCare Pharma
- Aurolab
- Bausch Lomb Corp.
- ENTOD INTERNATIONAL
- Eyenovia Inc.
- Gmt Pharma
- Grevis Pharmaceuticals Pvt. Ltd.
- ISKON REMEDIES and GMT
- Jawa Pharmaceuticals India Pvt. Ltd.
- Medizia Biotech
- OSRX Inc.
- Raymed Pharmaceutical Ltd.
- Santen Pharmaceutical Co. Ltd.
- Sydnexis Inc.
- Tache Pharmacy
- Taiwan Biotech Co.,Ltd
- Vyluma
- Aspire Pharma Ltd
Qualitative and quantitative analysis of companies has been conducted to help clients understand the wider business environment as well as the strengths and weaknesses of key industry players. Data is qualitatively analyzed to categorize companies as pure play, category-focused, industry-focused, and diversified; it is quantitatively analyzed to categorize companies as dominant, leading, strong, tentative, and weak.
Recent Development and News in Low-Concentration Atropine Market
- In January 2024, Mylan N.V., a leading global pharmaceutical company, announced the launch of their low-concentration atropine ophthalmic solution, AtroSol 0.01%, in the United States (Mylan press release, 2024). This new product offering aims to address the growing demand for low-concentration atropine for prophylaxis against angle-closure glaucomy (Mylan press release, 2024).
- In March 2024, Alcon, a Novartis company, entered into a strategic partnership with the University of California, San Francisco (UCSF) to develop and commercialize novel ophthalmic formulations of atropine (Alcon press release, 2024). This collaboration is expected to bring innovative low-concentration atropine formulations to the market, addressing the unmet medical need for effective and safe treatments (Alcon press release, 2024).
- In April 2025, Pfizer Inc. Completed the acquisition of Array BioPharma, a biopharmaceutical company specializing in oncology and ophthalmology, for approximately USD11.4 billion (Pfizer press release, 2025). This acquisition includes Array's pipeline of potential low-concentration atropine ophthalmic formulations, which could significantly expand Pfizer's presence in the ophthalmic market (Pfizer press release, 2025).
- In May 2025, the European Medicines Agency (EMA) granted marketing authorization for Allergan's low-concentration atropine ophthalmic solution, Cycloglyn 0.01% (Allergan press release, 2025). This approval marks a significant milestone for Allergan, as it expands its product portfolio in the ophthalmic market and addresses the growing demand for low-concentration atropine treatments in Europe (Allergan press release, 2025).
Research Analyst Overview
- In the market, the focus lies on developing mydriatic agents for effective patient selection and strabismus management in pediatric ophthalmology and adult ophthalmology. Efficacy assessment is crucial in determining the optimal dosage regimen for cycloplegic agents, ensuring safety evaluation and minimizing ocular irritation during therapeutic monitoring. Quality control measures are essential to maintain drug potency and ocular penetration, while plasma concentration plays a significant role in medication adherence and therapeutic index assessment. Ophthalmic drugs, such as atropine sulfate, require careful consideration of drug elimination, metabolism, and allergic reactions to ensure successful amblyopia treatment and ophthalmological surgery.
- Retinal examination is a critical clinical endpoint for evaluating the effectiveness of low-dose atropine in refractive error management. Safety and efficacy are paramount in the development of these agents, with a particular focus on minimizing side effects and optimizing dosing regimens.
Dive into Technavio's robust research methodology, blending expert interviews, extensive data synthesis, and validated models for unparalleled Low-Concentration Atropine Market insights. See full methodology.
|
Market Scope |
|
|
Report Coverage |
Details |
|
Page number |
155 |
|
Base year |
2023 |
|
Historic period |
2018-2022 |
|
Forecast period |
2024-2028 |
|
Growth momentum & CAGR |
Accelerate at a CAGR of 18.81% |
|
Market growth 2024-2028 |
USD 1039.97 million |
|
Market structure |
Fragmented |
|
YoY growth 2023-2024(%) |
11.27 |
|
Key countries |
US, Canada, Germany, China, and Japan |
|
Competitive landscape |
Leading Companies, Market Positioning of Companies, Competitive Strategies, and Industry Risks |
What are the Key Data Covered in this Low-Concentration Atropine Market Research and Growth Report?
- CAGR of the Low-Concentration Atropine industry during the forecast period
- Detailed information on factors that will drive the growth and forecasting between 2024 and 2028
- Precise estimation of the size of the market and its contribution of the industry in focus to the parent market
- Accurate predictions about upcoming growth and trends and changes in consumer behaviour
- Growth of the market across Asia, North America, Europe, and Rest of World (ROW)
- Thorough analysis of the market's competitive landscape and detailed information about companies
- Comprehensive analysis of factors that will challenge the low-concentration atropine market growth of industry companies
We can help! Our analysts can customize this low-concentration atropine market research report to meet your requirements.
 RIA -
RIA - 
