
Low-Power Wide Area Networks Market Size 2025-2029
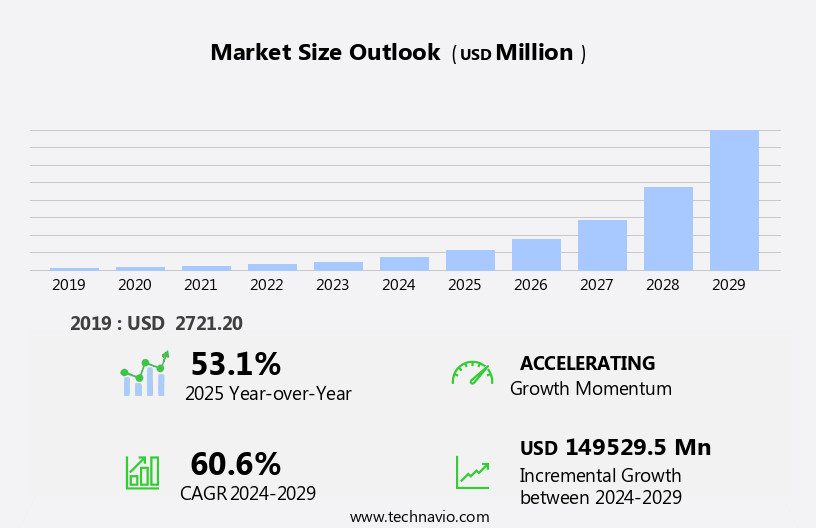
The low-power wide area networks market size is forecast to increase by USD 149.53 billion, at a CAGR of 60.6% between 2024 and 2029.
- The Low-Power Wide Area Networks (LPWAN) market is experiencing significant growth, driven by the increasing adoption of Internet of Things (IoT) devices. LPWAN's ability to provide extended battery life and wide coverage makes it an ideal solution for IoT applications. Deep learning and machine learning algorithms enhance network performance and provide valuable insights from the collected data. Furthermore, the convergence of LPWAN with 5G and edge computing is expected to accelerate market growth, enabling real-time data processing and communication. However, the market faces challenges, primarily in the form of spectrum and regulatory constraints.
- Additionally, collaboration with regulatory bodies and industry associations could help facilitate the development of standardized LPWAN technologies and policies. Data security is a significant concern in LPWAN applications, with data encryption ensuring the protection of sensitive information. Overall, the LPWAN market presents significant opportunities for growth, driven by the IoT revolution and the convergence with advanced technologies. Companies must stay informed of regulatory developments and invest in innovative solutions to overcome spectrum constraints and maintain a competitive edge.
What will be the Size of the Low-Power Wide Area Networks Market during the forecast period?
Explore in-depth regional segment analysis with market size data - historical 2019-2023 and forecasts 2025-2029 - in the full report.
Request Free Sample
The low-power wide area networks (LPWAN) market continues to evolve, driven by the increasing demand for connectivity in various sectors, including agriculture, industry, and urban infrastructure. LPWAN technologies, such as those utilizing low-power microcontrollers and wireless sensors, enable real-time data collection and transmission with minimal power consumption. These networks are finding applications in smart agriculture, where they facilitate edge computing and improve crop yield through environmental monitoring and precision farming. In industry, LPWANs support the Industrial Internet of Things (IIoT) by providing reliable, low-power connectivity for asset tracking and supply chain visibility.
Network infrastructure, including LPWAN gateways and network optimization, plays a crucial role in ensuring seamless data transmission. Frequency hopping and data compression techniques further contribute to power savings and network efficiency. The integration of LPWANs with technologies like fog computing, network slicing, and blockchain technology enhances their capabilities and potential use cases. The market's continuous dynamism is reflected in the ongoing development of network protocols, antenna design, and modulation techniques to address evolving requirements and improve quality of service. Neuromorphic chips, which utilize memristors as their primary building blocks, offer high-density memory and fast processing speeds, making them an ideal solution for applications requiring real-time processing and pattern recognition, including image recognition and data mining.
How is this Low-Power Wide Area Networks Industry segmented?
The low-power wide area networks industry research report provides comprehensive data (region-wise segment analysis), with forecasts and estimates in "USD million" for the period 2025-2029, as well as historical data from 2019-2023 for the following segments.
- Technology
- NB-IoT
- LTE-M
- LoRa
- Sigfox
- Connectivity
- Cellular
- Non-cellular
- End-user
- Smart buildings
- Agriculture
- Utilities
- Industrial manufacturing
- Others
- Geography
- North America
- US
- Canada
- Europe
- France
- Germany
- Italy
- UK
- APAC
- China
- India
- Japan
- South Korea
- Rest of World (ROW)
- North America
By Technology Insights
The NB-IoT segment is estimated to witness significant growth during the forecast period. The Low-Power Wide Area Networks (LPWAN) market encompasses various applications, including smart agriculture, industrial IoT, and edge computing. LPWANs utilize RF modules and wireless sensors, which require minimal power consumption and long battery life. Antenna design and modulation techniques are crucial for optimizing network coverage and ensuring real-time data transmission. Speech recognition and machine translation benefit from recurrent neural networks and deep belief networks, while cognitive computing enhances time series analysis and machine learning. Fog computing and data analytics platforms enable decentralized processing and analysis, while data security and encryption are essential for safeguarding sensitive information. Asset tracking and supply chain visibility are significant use cases for LPWANs, with network slicing and blockchain technology enhancing security and efficiency.
Deep learning and machine learning algorithms facilitate data compression and error correction, enabling efficient device management. LPWANs employ various technologies, such as frequency hopping, data compression, and location tracking, to optimize network performance. Smart cities and network protocols leverage LPWANs for remote monitoring and quality of service, while cloud connectivity and artificial intelligence enable advanced applications. Edge computing and system integrators are enabling the deployment of smart homes and cities. Spread spectrum technology and network infrastructure enhance network reliability and scalability. Narrowband IoT (NB-IoT) is a cellular-based LPWAN technology, standardized by the 3GPP, which offers ultra-narrowband communication and deep indoor penetration. NB-IoT's low power consumption and suitability for static, low-throughput applications make it an ideal choice for various industries, including agriculture and manufacturing.
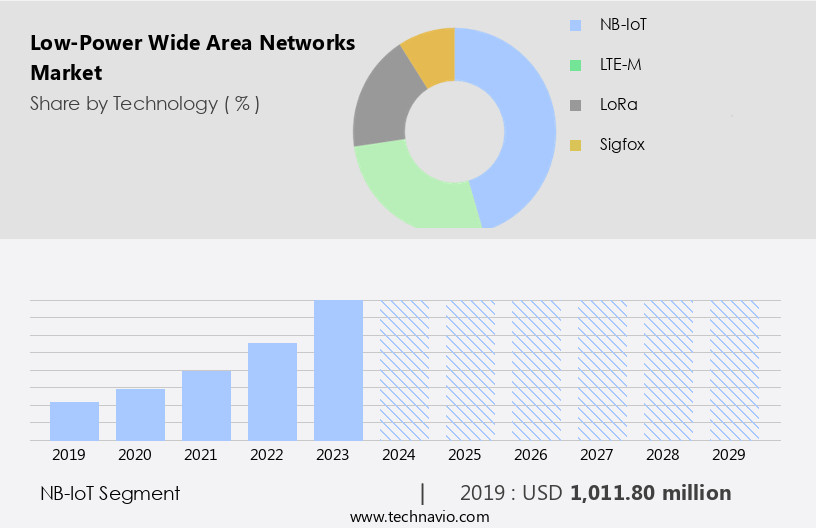
The NB-IoT segment was valued at USD 1.01 billion in 2019 and showed a gradual increase during the forecast period.
Regional Analysis
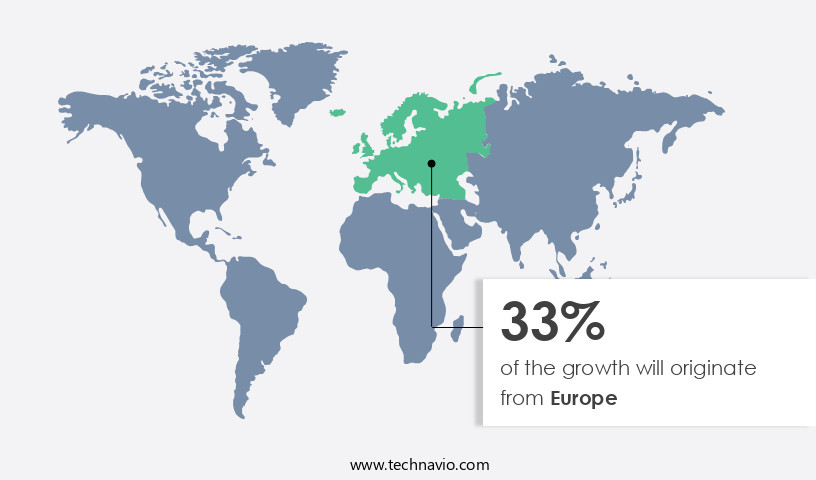
Europe is estimated to contribute 33% to the growth of the global market during the forecast period.Technavio's analysts have elaborately explained the regional trends and drivers that shape the market during the forecast period.
The European low-power wide area networks (LPWAN) market is experiencing significant growth due to regulatory support, early technology adoption, and strategic infrastructure investments. The market is characterized by a balanced deployment of cellular (NB-IoT, LTE-M) and non-cellular (LoRaWAN, Sigfox) technologies. LoRaWAN, known for its decentralized, low-cost deployment model, dominates applications in sectors like smart buildings, precision agriculture, and environmental monitoring. Its versatility makes it suitable for both rural and urban environments. In the competitive landscape, manufacturers are innovating to develop advanced neuromorphic chips, integrating edge and quantum computing, robotics, and synchronicity with other devices. NB-IoT, backed by telecom giants, is widely adopted in smart metering for water, gas, and electricity due to its deep indoor coverage and carrier-grade reliability.
Edge computing and fog computing enhance real-time data processing, while data security, error correction, and device management ensure data integrity. Industrial IoT, asset tracking, and supply chain visibility benefit from LPWAN's long battery life and low-power microcontrollers. Network slicing, blockchain technology, and sensor integration optimize network performance and security. Deep learning, machine learning, and data analytics platforms facilitate intelligent decision-making. LPWAN gateways, location tracking, frequency hopping, and data compression improve network coverage and efficiency. Smart cities, network protocols, and cloud connectivity are integral to the market's evolution. Spread spectrum, quality of service, and remote monitoring ensure network reliability and performance.
Market Dynamics
Our researchers analyzed the data with 2024 as the base year, along with the key drivers, trends, and challenges. A holistic analysis of drivers will help companies refine their marketing strategies to gain a competitive advantage.
What are the key market drivers leading to the rise in the adoption of Low-Power Wide Area Networks Industry?
- The increasing implementation of Internet of Things (IoT) devices serves as the primary catalyst for market growth. The global market for Low-Power Wide Area Networks (LPWAN) is experiencing significant growth due to the increasing deployment of Internet of Things (IoT) devices across various industries. By 2024, the number of IoT devices connected globally is projected to reach approximately 18.5 billion, up from around 16.5 billion in 2023. This growth is driven by enterprises and governments accelerating their digital transformation initiatives, leading to a heightened demand for connectivity solutions that are energy-efficient, long-range, and cost-effective. Additionally, neuromorphic computing is revolutionizing data centers, data analysis, and autonomous vehicles through swarm intelligence, learning algorithms, and neural plasticity.
- These technologies enable thousands of devices to connect over vast geographic areas while maintaining minimal power consumption. Furthermore, LPWAN networks offer error correction, device management, data analytics platforms, network slicing, blockchain technology, and sensor integration capabilities, making them an attractive choice for asset tracking and supply chain visibility applications. Network optimization is another key benefit, as LPWAN networks can extend battery life for IoT devices, reducing the need for frequent battery replacements. LPWAN technologies, including LoRaWAN, Narrowband IoT (NB-IoT), and LTE for Machines (LTE-M), are well-positioned to support this rise in IoT adoption.
What are the market trends shaping the Low-Power Wide Area Networks Industry?
- The convergence of Low-Power Wide Area Networks (LPWANs) with 5G technology and edge computing represents a significant market trend. This fusion of technologies is expected to optimize network efficiency, reduce latency, and enhance the capabilities of the Internet of Things (IoT) devices. The low-power wide area networks (LPWAN) market is experiencing significant growth due to its integration with fifth-generation (5G) mobile networks and edge computing technologies. This convergence is revolutionizing the Internet of Things (IoT) connectivity landscape by combining LPWAN's energy efficiency and long-range capabilities with 5G's enhanced reliability, lower latency, and massive machine-type communications (mMTC) support.
- LPWAN's wireless sensors, often using low-power microcontrollers, are essential in these applications. Data encryption ensures security, while data compression minimizes bandwidth requirements. Location tracking and frequency hopping further enhance LPWAN's capabilities. Deep learning algorithms can analyze the data generated by these networks, providing valuable insights. LPWAN gateways act as intermediaries between LPWAN networks and the internet, ensuring seamless data transfer. Technologies like Narrowband IoT (NB-IoT) and LTE for Machines (LTE-M) are being optimized for 5G environments, enabling ultra-dense device deployments and supporting use cases requiring both wide-area coverage and near real-time responsiveness. Applications such as smart factory automation and connected vehicle infrastructure are benefiting from this hybrid architecture.
What challenges does the Low-Power Wide Area Networks Industry face during its growth?
-
Spectrum limitations and regulatory constraints present complex challenges that significantly impact the growth of the industry. These constraints limit the availability and utilization of essential resources, thereby hindering the expansion and innovation within the sector. Low-Power Wide Area Networks (LPWANs), including technologies like LoRaWAN and Sigfox, face challenges in global deployment and scalability due to spectrum limitations and regulatory disparities. Operating primarily in unlicensed Industrial, Scientific, and Medical (ISM) bands, such as 868 MHz in Europe and 915 MHz in North America, these networks are increasingly congested due to the growing number of IoT devices. This congestion results in signal interference and reduced transmission reliability, particularly in urban areas.
- LPWANs' spread spectrum technology enables long-range, low-power communication, making them ideal for IoT applications. However, addressing the challenges of spectrum limitations and regulatory disparities is crucial for the widespread adoption and successful implementation of these networks. Regulatory frameworks also vary across regions, imposing different spectrum policies, transmission power limits, duty cycle restrictions, and frequency hopping requirements. These factors complicate LPWAN implementation and may hinder the growth of smart cities and other applications that rely on machine learning, artificial intelligence, and cloud connectivity for remote monitoring and quality of service.
Exclusive Customer Landscape
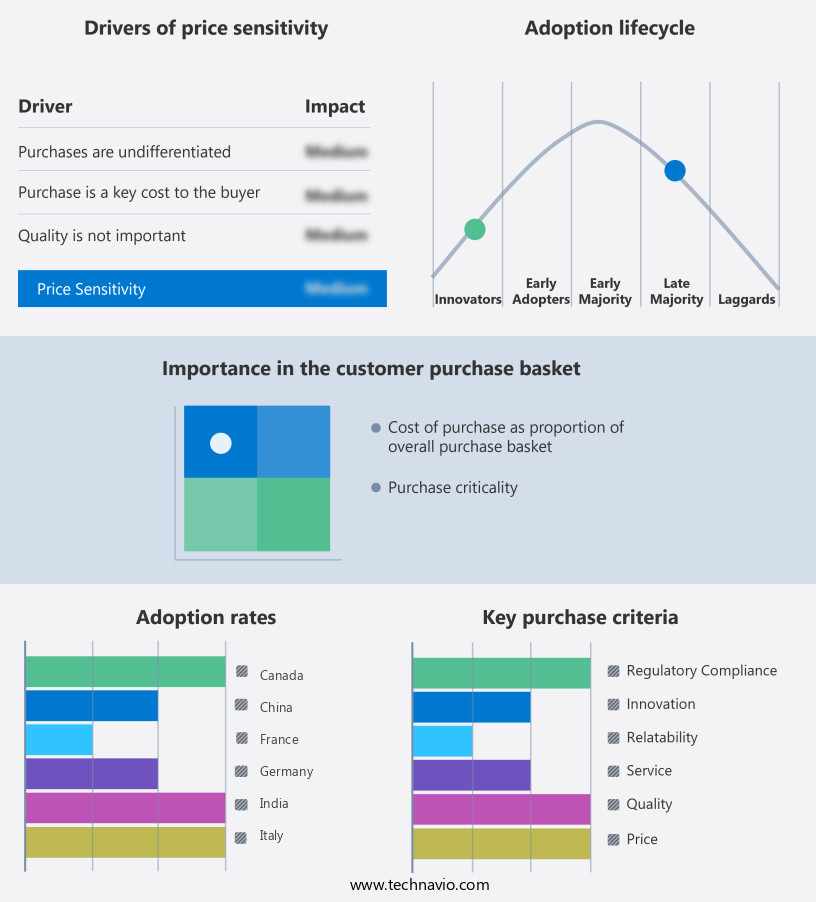
The low-power wide area networks market forecasting report includes the adoption lifecycle of the market, covering from the innovator's stage to the laggard's stage. It focuses on adoption rates in different regions based on penetration. Furthermore, the low-power wide area networks market report also includes key purchase criteria and drivers of price sensitivity to help companies evaluate and develop their market growth analysis strategies.
Customer Landscape
Key Companies & Market Insights
Companies are implementing various strategies, such as strategic alliances, low-power wide area networks market forecast, partnerships, mergers and acquisitions, geographical expansion, and product/service launches, to enhance their presence in the industry.
Actility SA - This company specializes in low-power wide area networks, enabling long-distance device connectivity with minimal power consumption for enhanced IoT applications.
The industry research and growth report includes detailed analyses of the competitive landscape of the market and information about key companies, including:
- Actility SA
- AT and T Inc.
- BOUYGUES
- Cisco Systems Inc.
- Huawei Technologies Co. Ltd.
- Ingenu Inc.
- Kerlink
- Link Labs Inc.
- Loriot AG
- Orange SA
- Qualcomm Inc.
- Semtech Corp.
- Senet Inc.
- Sierra Wireless Inc.
- SIGFOX
- Telefonica SA
- Thales Group
- Verizon Communications Inc.
- Vodafone Group Plc
- WAVIoT
Qualitative and quantitative analysis of companies has been conducted to help clients understand the wider business environment as well as the strengths and weaknesses of key industry players. Data is qualitatively analyzed to categorize companies as pure play, category-focused, industry-focused, and diversified; it is quantitatively analyzed to categorize companies as dominant, leading, strong, tentative, and weak.
Recent Development and News in Low-Power Wide Area Networks Market
- In January 2024, Sigfox, a leading provider of Low-Power Wide Area Networks (LPWAN), announced the launch of its new IoT platform, Sigfox 3, which supports advanced features like geolocation and real-time data processing (Sigfox Press Release, 2024).
- In March 2024, Telefonica and Nokia joined forces to deploy Nokia's Worldwide IoT Network Grid (WING) on Telefonica's LPWAN infrastructure, aiming to connect over 1 billion IoT devices by 2027 (Telefonica Press Release, 2024).
- In May 2024, the European Union approved the Horizon Europe research and innovation program, which includes a ⬠1.5 billion investment in 5G and LPWAN technologies, accelerating the deployment of these networks across Europe (European Commission Press Release, 2024).
- In February 2025, Senet, a US-based LPWAN provider, raised USD 110 million in a Series D funding round, enabling the company to expand its network coverage and enhance its IoT platform offerings (Senet Press Release, 2025).
Research Analyst Overview
The Low-Power Wide Area Networks (LPWAN) market is witnessing significant growth, driven by the increasing adoption of GPS tracking in various industries. Network simulators play a crucial role in testing and optimizing LPWAN deployments for precision agriculture, fleet management, and logistics optimization. Firmware updates ensure seamless integration of alerting systems and interoperability standards, enabling real-time data visualization for healthcare applications and smart grids. Cost optimization through power management ICs and energy harvesting technologies is a key trend, along with spectrum allocation and air quality monitoring for environmental sustainability.
Privacy regulations necessitate security certifications, while Bluetooth Low Energy and proprietary protocols facilitate remote control of devices. Soil moisture sensors, smart metering, and water quality monitoring contribute to building automation and data interpretation in diverse sectors. Open-source platforms foster innovation and collaboration, driving the LPWAN market forward. The limited availability of spectrum and stringent regulations may hinder the widespread adoption of LPWAN technologies. The semiconductor roadmap includes the development of advanced materials like gallium nitride and silicon carbide for power electronics and the integration of cleanroom technology and semiconductor manufacturing equipment into electronic design automation.
Dive into Technavio's robust research methodology, blending expert interviews, extensive data synthesis, and validated models for unparalleled Low-Power Wide Area Networks Market insights. See full methodology.
|
Market Scope |
|
|
Report Coverage |
Details |
|
Page number |
235 |
|
Base year |
2024 |
|
Historic period |
2019-2023 |
|
Forecast period |
2025-2029 |
|
Growth momentum & CAGR |
Accelerate at a CAGR of 60.6% |
|
Market growth 2025-2029 |
USD 149.53 billion |
|
Market structure |
Fragmented |
|
YoY growth 2024-2025(%) |
53.1 |
|
Key countries |
US, China, Germany, UK, Japan, France, India, Canada, Italy, and South Korea |
|
Competitive landscape |
Leading Companies, Market Positioning of Companies, Competitive Strategies, and Industry Risks |
What are the Key Data Covered in this Low-Power Wide Area Networks Market Research and Growth Report?
- CAGR of the Low-Power Wide Area Networks industry during the forecast period
- Detailed information on factors that will drive the growth and forecasting between 2025 and 2029
- Precise estimation of the size of the market and its contribution of the industry in focus to the parent market
- Accurate predictions about upcoming growth and trends and changes in consumer behaviour
- Growth of the market across Europe, North America, APAC, Middle East and Africa, and South America
- Thorough analysis of the market's competitive landscape and detailed information about companies
- Comprehensive analysis of factors that will challenge the low-power wide area networks market growth of industry companies
We can help! Our analysts can customize this low-power wide area networks market research report to meet your requirements.
 RIA -
RIA - 
