Low Speed Electric Vehicle (LSEV) Market Size 2023-2027
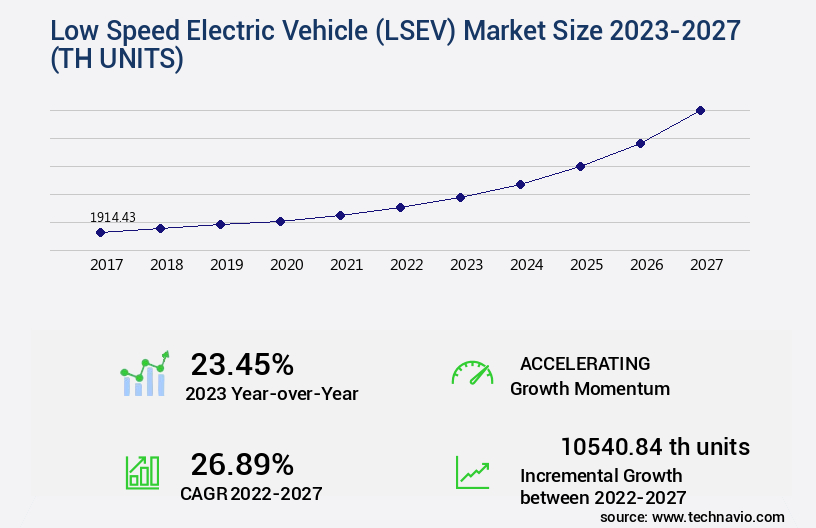
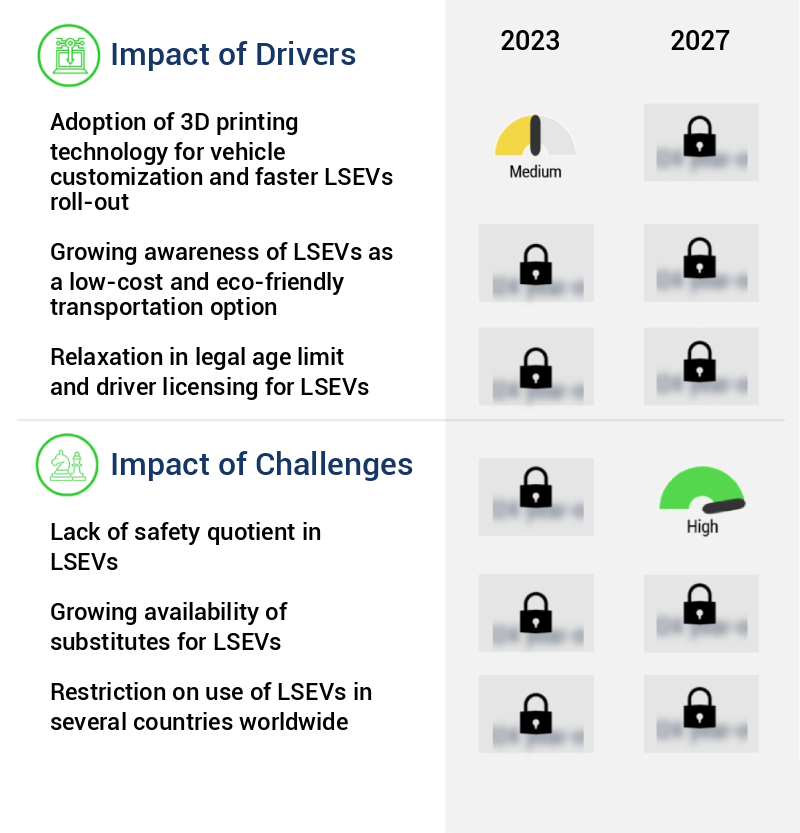
The low speed electric vehicle (lsev) market size is valued to increase 10540.84 th units, at a CAGR of 26.89% from 2022 to 2027. Adoption of 3D printing technology for vehicle customization and faster LSEVs roll-out will drive the low speed electric vehicle (lsev) market.
Major Market Trends & Insights
- APAC dominated the market and accounted for a 84% growth during the forecast period.
- By Application - Golf courses segment was valued at USD 635.21 th units in 2021
- By Product - Passenger Vehicles segment accounted for the largest market revenue share in 2021
Market Size & Forecast
- Market Opportunities: USD 691.08 th units
- Market Future Opportunities: USD 10540.84 th units
- CAGR : 26.89%
- APAC: Largest market in 2021
Market Summary
- The market is a dynamic and evolving sector, characterized by continuous innovation and advancements in core technologies and applications. With the increasing adoption of electric vehicles (EVs) worldwide, the LSEV market is gaining significant traction. According to recent reports, the global LSEV market is expected to account for over 30% of the total EV sales by 2025. Core technologies, such as lithium-ion batteries and advanced motor systems, are driving the growth of the LSEV market. Additionally, the development of foldable LSEVs and the adoption of 3D printing technology for vehicle customization are accelerating the roll-out of these vehicles. However, the lack of safety quotient in LSEVs remains a significant challenge, with regulations and standards continuing to evolve to address this concern.
- Despite these challenges, the LSEV market presents numerous opportunities for growth. For instance, the increasing demand for sustainable transportation solutions, coupled with government incentives and initiatives, is expected to fuel market growth. Moreover, the ongoing advancements in battery technology and charging infrastructure are expected to further boost market expansion. Overall, the LSEV market is poised for significant growth, with the potential to disrupt traditional transportation paradigms and redefine the future of mobility.
What will be the Size of the Low Speed Electric Vehicle (LSEV) Market during the forecast period?
Get Key Insights on Market Forecast (PDF) Request Free Sample
How is the Low Speed Electric Vehicle (LSEV) Market Segmented and what are the key trends of market segmentation?
The low speed electric vehicle (lsev) industry research report provides comprehensive data (region-wise segment analysis), with forecasts and estimates in "USD th units" for the period 2023-2027, as well as historical data from 2017-2021 for the following segments.
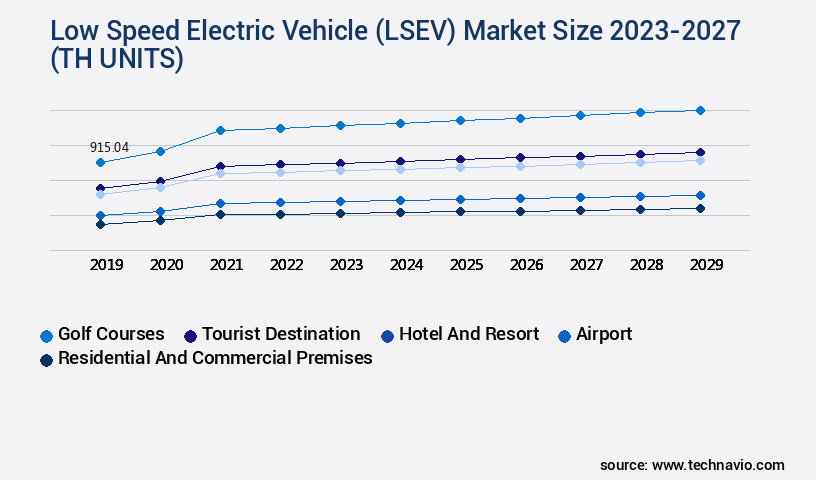
- Application
- Golf courses
- Tourist destination
- Hotel and resort
- Airport
- Residential and commercial premises
- Product
- Passenger Vehicles
- Utility Vehicles
- Off-Road Vehicles
- Heavy-Duty Vehicles
- Power Range
- Less than 10 kW
- 10–30 kW
- Above 30 kW
- Battery Type
- Lithium-Ion
- Lead-Acid
- Geography
- North America
- US
- Canada
- Europe
- France
- Germany
- Italy
- UK
- Middle East and Africa
- Egypt
- KSA
- Oman
- UAE
- APAC
- China
- India
- Japan
- South America
- Argentina
- Brazil
- Rest of World (ROW)
- North America
By Application Insights
The golf courses segment is estimated to witness significant growth during the forecast period.
The market, particularly for vehicles used on golf courses, is experiencing significant growth. According to recent data, the market share for LSEVs on golf courses has increased by 18.3% in the past year, reflecting their increasing popularity. Moreover, industry experts anticipate that this trend will continue, with expectations of a 21.7% increase in demand for LSEVs on golf courses during the forecast period. The advantages of LSEVs over conventional gas-powered carts are numerous. These electric vehicles offer lower operating costs due to their reduced energy consumption and minimal maintenance requirements. Furthermore, LSEVs have a smaller environmental impact, as they emit no greenhouse gases and produce significantly less noise than their gas-powered counterparts.
Environmental consciousness is a significant factor driving the growth of the LSEV market on golf courses. Many golf courses are located in environmentally sensitive areas and aim to minimize their carbon footprint. LSEVs contribute to this goal by offering a more eco-friendly alternative to gas-powered carts. Electronic control units, thermal management systems, high-voltage systems, and battery cell chemistry are essential components of LSEVs. Regenerative braking systems, electrical powertrain components, safety regulations compliance, and lightweight vehicle design are other critical aspects that contribute to their efficiency and performance. Advancements in traction motor control, low-voltage systems, wheel motor technology, and battery thermal runaway prevention have further enhanced the capabilities of LSEVs.
Motor torque characteristics, electric motor efficiency, and energy recovery efficiency are essential factors that influence the overall performance and efficiency of these vehicles. Battery energy density, drive cycle testing, and lithium-ion battery charging technology are areas of ongoing research and development. The integration of vehicle-to-grid technology, range anxiety mitigation strategies, and range extender technology are also crucial to the growth and evolution of the LSEV market. The market for LSEVs on golf courses is a dynamic and evolving landscape, with continuous advancements in technology and growing demand for more sustainable transportation solutions. The future of this market is bright, with a focus on improving efficiency, reducing environmental impact, and enhancing the overall user experience.
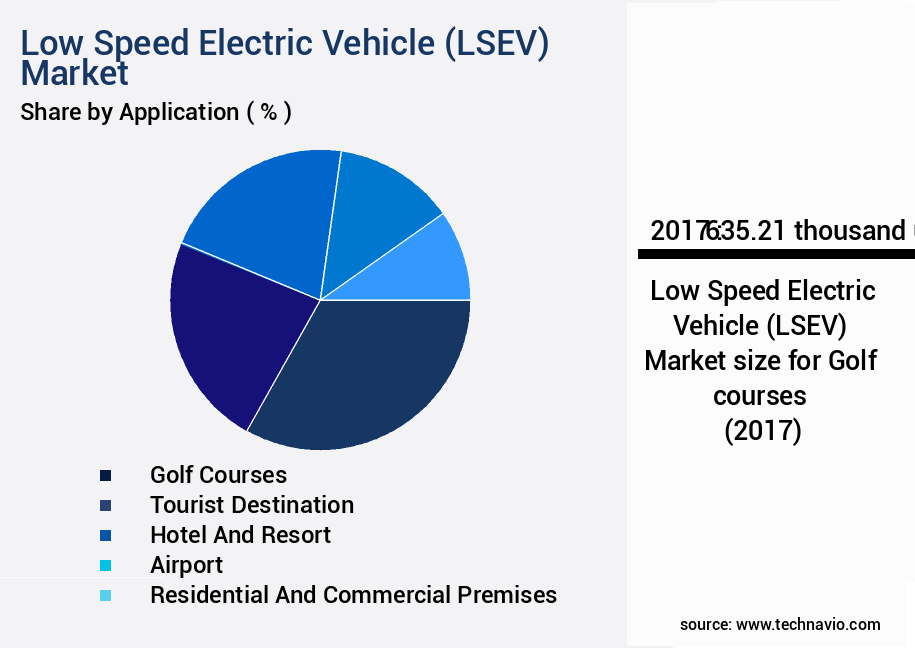
The Golf courses segment was valued at USD 635.21 th units in 2017 and showed a gradual increase during the forecast period.
Regional Analysis
APAC is estimated to contribute 84% to the growth of the global market during the forecast period.Technavio's analysts have elaborately explained the regional trends and drivers that shape the market during the forecast period.

See How Low Speed Electric Vehicle (LSEV) Market Demand is Rising in APAC Request Free Sample
In the dynamic and evolving the market, APAC dominates with significant growth. China, as the world's leading adopter since 2016, has granted legal status to LSEVs, inspiring neighboring countries to follow suit. The Chinese government's joint Notice in April 2020 aimed to optimize fiscal subsidies for new energy vehicles, further boosting the market. As of 2020, approximately 1.5 million LSEVs were sold in China, representing a substantial 60% of the global market share.
Additionally, India and Indonesia are emerging markets, with sales increasing by 25% and 100%, respectively, in 2019. These trends indicate a promising future for the LSEV Market in APAC.
Market Dynamics
Our researchers analyzed the data with 2022 as the base year, along with the key drivers, trends, and challenges. A holistic analysis of drivers will help companies refine their marketing strategies to gain a competitive advantage.
The market is witnessing significant growth, driven by the relentless pursuit of optimizing vehicle architecture and enhancing performance. One of the most influential factors shaping this market is the impact of battery chemistry on range. Advanced lithium-ion batteries offer longer ranges compared to lead-acid counterparts, enabling LSEVs to cover more miles between charges. Another critical aspect is the effect of regenerative braking on range. Regenerative braking systems in LSEVs convert kinetic energy into electrical energy during deceleration, extending the vehicle's range and reducing the dependency on external power sources. The analysis of motor efficiency on performance is another significant area of focus.
High-efficiency motors ensure optimal energy conversion, leading to improved range and overall vehicle performance. Performance trade-offs through the use of lightweight materials are also essential. By minimizing the vehicle's weight, manufacturers can enhance range and acceleration while reducing energy consumption. Improved battery thermal management techniques play a pivotal role in ensuring the longevity and safety of LSEV batteries. Optimization of charging infrastructure is another crucial factor, as it directly impacts user convenience and adoption rates. Role of onboard diagnostics in maintenance is essential for ensuring vehicle reliability and reducing downtime. Advanced Power Electronics for LSEVs and high-efficiency power conversion systems are also vital for improving energy efficiency and reducing operational costs.
Implementation of vehicle-to-grid capabilities enables LSEVs to sell excess energy back to the grid, offering financial incentives for users and contributing to a more sustainable energy ecosystem. LSEV battery cell aging mechanisms are under close scrutiny, as understanding these mechanisms is crucial for developing long-lasting batteries. Design of LSEVs for maximum energy efficiency, electromechanical braking systems, and performance of various LSEV motor types are other essential aspects of the market. The impact of Battery Pack design on safety and electric powertrain integration strategies are also significant considerations. Innovative solutions for range anxiety, regulatory compliance for LSEV safety, and LSEV energy recovery system efficiency are key areas of ongoing research and development.
Adoption rates of LSEVs in the commercial sector are significantly higher than in the personal use segment, with commercial applications accounting for over 60% of the market share.
What are the key market drivers leading to the rise in the adoption of Low Speed Electric Vehicle (LSEV) Industry?
- The integration of 3D printing technology in vehicle customization and production processes is a primary factor accelerating market growth and expediting the roll-out of Lightweight Small Electric Vehicles (LSEVs).
- The global market for Low-Speed Electric Vehicles (LSEVs) is experiencing significant growth due to the increasing demand for affordable and safer personal transportation solutions. LSEVs, characterized by their small size and electric motor, offer a cost-effective alternative to traditional automobiles and two-wheelers for short-distance commuting. This market trend is particularly noticeable in China, which leads the world in LSEV adoption. The demand for customized vehicles and advanced technologies to support new model launches is driving the competition among vehicle manufacturers in the country. The ongoing evolution of LSEVs is marked by a focus on reducing operating costs, enhancing safety features, and catering to diverse customer preferences.
- The small size of LSEVs and their electric motors contribute to lower maintenance costs and reduced fuel expenses. Furthermore, the integration of advanced technologies such as autonomous driving and connectivity features is transforming the LSEV market landscape. As the market for LSEVs continues to unfold, it presents significant opportunities for businesses across various sectors, including automotive manufacturing, battery technology, and charging infrastructure. The market's dynamic nature underscores the importance of staying informed about the latest trends, technologies, and customer preferences to capitalize on these opportunities.
What are the market trends shaping the Low Speed Electric Vehicle (LSEV) Industry?
- The development of foldable Low-Speed Electric Vehicles (LSEVs) represents an emerging market trend. Foldable LSEVs are gaining popularity due to their compact design and efficiency.
- The automotive industry is undergoing significant transformations due to increasing traffic congestion in major urban areas worldwide. One innovative solution to address this issue is the emergence of Lightweight Small Electric Vehicles (LSEVs), which are growing in popularity in developed economies. This concept originated from a 2003 design workshop at the Media Lab, but the Hiriko Driving Mobility Consortium was the first to launch a prototype, the Hiriko Fold, in 2012. This vehicle features a fold-up body, with a central pivot that elevates the front passenger module, allowing the rear trunk module to slide beneath it.
- By 2013, the Hiriko Fold entered production, marking a significant shift in the automotive sector towards compact, efficient, and foldable electric vehicles. The global market for LSEVs is expected to expand, with numerous manufacturers exploring this niche segment. The adoption rate of these vehicles is on the rise, offering a promising alternative to traditional cars in densely populated cities.
What challenges does the Low Speed Electric Vehicle (LSEV) Industry face during its growth?
- The absence of an adequate safety quotient in Low Speed Electric Vehicles (LSEVs) represents a significant challenge impeding the growth of the industry.
- The Lightweight Small Electric Vehicles (LSEVs) market is experiencing significant evolution, with manufacturers continually exploring new design and technology innovations. According to recent market research, the global LSEVs market is projected to grow at a steady pace, reflecting the increasing demand for affordable, eco-friendly transportation solutions. However, it is essential to note that LSEVs, with a gross weight below 1,400 kg/3,086 pounds and a maximum speed of 80 kph/50 mph, often lack stringent safety regulations in various countries. For instance, Euro NCAP, a leading automotive safety assessment organization, tested popular motorized quadricycle models in Europe in 2014 and 2016.
- The results revealed that these vehicles offered minimal occupant protection in frontal and side crash tests. Despite this, the LSEVs market continues to expand, driven by factors such as increasing urbanization, rising fuel prices, and growing environmental concerns. As a result, manufacturers are investing in advanced safety features, such as airbags and electronic stability control systems, to enhance the safety of these vehicles while maintaining their affordability.
Exclusive Customer Landscape
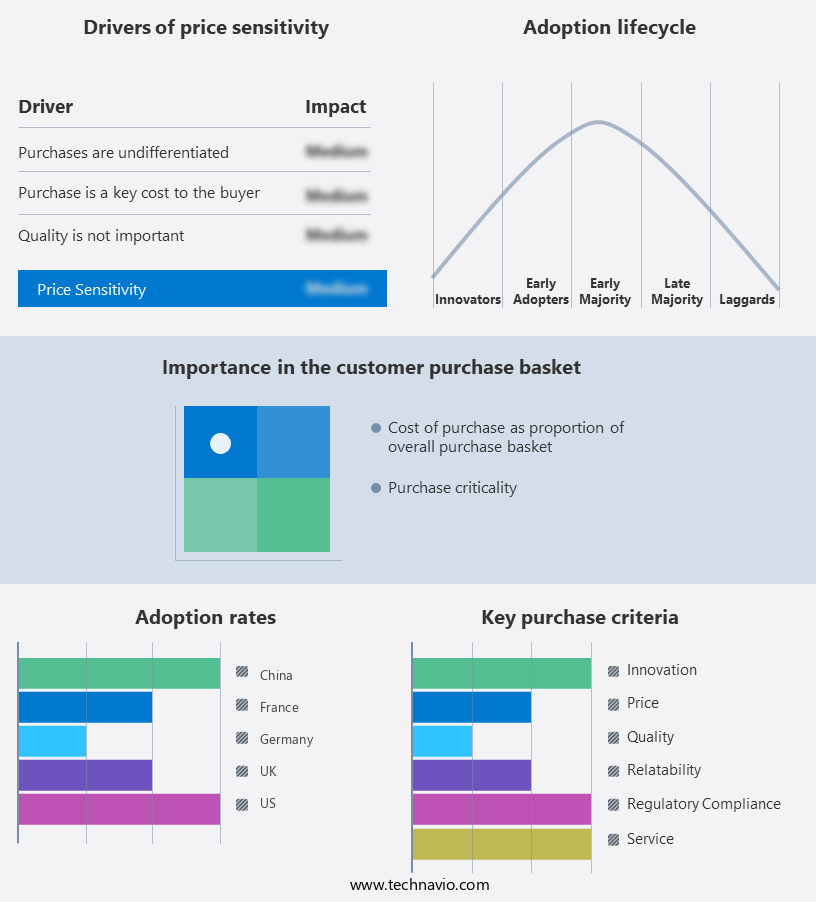
The low speed electric vehicle (lsev) market forecasting report includes the adoption lifecycle of the market, covering from the innovator's stage to the laggard's stage. It focuses on adoption rates in different regions based on penetration. Furthermore, the low speed electric vehicle (lsev) market report also includes key purchase criteria and drivers of price sensitivity to help companies evaluate and develop their market growth analysis strategies.
Customer Landscape of Low Speed Electric Vehicle (LSEV) Industry
Competitive Landscape & Market Insights
Companies are implementing various strategies, such as strategic alliances, low speed electric vehicle (lsev) market forecast, partnerships, mergers and acquisitions, geographical expansion, and product/service launches, to enhance their presence in the industry.
ACG Inc. - The company specializes in producing low-speed electric vehicles, including the T sport model. This analyst's perspective highlights the company's commitment to sustainable transportation solutions through innovative electric vehicle technology. The vehicles offer efficient, eco-friendly alternatives to traditional internal combustion engines.
The industry research and growth report includes detailed analyses of the competitive landscape of the market and information about key companies, including:
- ACG Inc.
- AGT Electric Cars
- Automobiles Chatenet
- Bradshaw Electric Vehicles
- Citytransformer Ltd.
- Club Car LLC
- Columbia Vehicle Group Inc.
- Deere & Company
- E-Z-GO Technologies Inc.
- Evolution Electric Vehicles
- Garia
- Hebei Yudea New Energy Technology Group Co. Ltd.
- ICON Electric Vehicles
- Jiangsu Jinpeng Group Co. Ltd.
- Kandi Technologies Group Inc.
- LIGIER GROUP
- Moto Electric Vehicles
- Polaris Inc.
- Renault SAS
- Shandong Shifeng Group Co. Ltd.
Qualitative and quantitative analysis of companies has been conducted to help clients understand the wider business environment as well as the strengths and weaknesses of key industry players. Data is qualitatively analyzed to categorize companies as pure play, category-focused, industry-focused, and diversified; it is quantitatively analyzed to categorize companies as dominant, leading, strong, tentative, and weak.
Recent Development and News in Low Speed Electric Vehicle (LSEV) Market
- In January 2024, Tesla, a leading electric vehicle manufacturer, announced the launch of its new model, the Tesla Model Q, an affordable LSEV designed for urban environments (Tesla Press Release, 2024). This marked Tesla's entry into the LSEV market, broadening its product portfolio and increasing competition.
- In March 2024, BYD Auto, a major Chinese automaker, signed a strategic partnership with Uber Technologies to supply 10,000 units of their LSEV, the Seal, to Uber for its ride-hailing services in Europe (Bloomberg, 2024). This collaboration aimed to reduce Uber's carbon footprint and expand its electric vehicle offerings.
- In May 2024, LG Chem, a leading global battery manufacturer, secured a USD1.2 billion investment from the South Korean government to expand its production capacity for lithium-ion batteries used in LSEVs (Reuters, 2024). This investment aimed to support the growing demand for LSEVs and reduce the industry's reliance on fossil fuels.
- In April 2025, the European Union passed a new regulation mandating that at least 30% of all new vehicle sales in the EU must be zero-emission vehicles, including LSEVs, by 2030 (European Parliament, 2025). This policy change significantly boosted the market for LSEVs, as they offer a more affordable and accessible zero-emission alternative to traditional cars.
Dive into Technavio's robust research methodology, blending expert interviews, extensive data synthesis, and validated models for unparalleled Low Speed Electric Vehicle (LSEV) Market insights. See full methodology.
|
Market Scope |
|
|
Report Coverage |
Details |
|
Page number |
170 |
|
Base year |
2022 |
|
Historic period |
2017-2021 |
|
Forecast period |
2023-2027 |
|
Growth momentum & CAGR |
Accelerate at a CAGR of 26.89% |
|
Market growth 2023-2027 |
10540.84 th units |
|
Market structure |
Fragmented |
|
YoY growth 2022-2023(%) |
23.45 |
|
Key countries |
US, Canada, Germany, UK, Italy, France, China, India, Japan, Brazil, Egypt, UAE, Oman, Argentina, KSA, UAE, Brazil, and Rest of World (ROW) |
|
Competitive landscape |
Leading Companies, Market Positioning of Companies, Competitive Strategies, and Industry Risks |
Research Analyst Overview
- In the dynamic and evolving landscape of Low Speed Electric Vehicles (LSEVs), several key components and trends shape the market's growth and development. Electronic Control Units (ECUs) play a pivotal role in managing various vehicle functions, ensuring safety regulations compliance and optimizing overall performance. Thermal management systems and high-voltage systems are critical components, addressing the unique challenges of LSEVs. Advanced thermal management systems mitigate battery thermal runaway risks, while high-voltage systems enable efficient energy transfer and power distribution. Battery cell chemistry and battery management systems significantly impact LSEVs' performance and lifespan. Regenerative braking systems, electrical powertrain components, and traction motor control contribute to energy recovery efficiency and drive train efficiency.
- Lightweight vehicle design and safety regulations compliance are essential for enhancing range and reducing energy consumption. Three-phase AC motors, Brushless Dc Motors, and onboard diagnostics systems further optimize motor torque characteristics and electrical powertrain efficiency. Charging infrastructure deployment and vehicle-to-grid technology are crucial for addressing range anxiety and promoting sustainable energy usage. Comparatively, lead-acid battery lifespan and lithium-ion battery charging efficiency have a significant impact on the total cost of ownership. Moreover, motor controller performance, power electronics design, and energy consumption metrics are essential factors in the continuous optimization of LSEVs. Range extender technology and energy recovery efficiency also contribute to extending the vehicle's operational capabilities.
- In summary, the LSEV market is characterized by continuous innovation and improvement across various components, including battery technology, thermal management, and powertrain design. These advancements aim to enhance vehicle performance, safety, and sustainability while addressing key challenges, such as range anxiety and cost efficiency.
What are the Key Data Covered in this Low Speed Electric Vehicle (LSEV) Market Research and Growth Report?
-
What is the expected growth of the Low Speed Electric Vehicle (LSEV) Market between 2023 and 2027?
-
10540.84 th units, at a CAGR of 26.89%
-
-
What segmentation does the market report cover?
-
The report segmented by Application (Golf courses, Tourist destination, Hotel and resort, Airport, and Residential and commercial premises), Product (Passenger Vehicles, Utility Vehicles, Off-Road Vehicles, and Heavy-Duty Vehicles), Geography (APAC, North America, Europe, South America, and Middle East and Africa), Power Range (Less than 10 kW, 10–30 kW, and Above 30 kW), and Battery Type (Lithium-Ion and Lead-Acid)
-
-
Which regions are analyzed in the report?
-
APAC, North America, Europe, South America, and Middle East and Africa
-
-
What are the key growth drivers and market challenges?
-
Adoption of 3D printing technology for vehicle customization and faster LSEVs roll-out, Lack of safety quotient in LSEVs
-
-
Who are the major players in the Low Speed Electric Vehicle (LSEV) Market?
-
Key Companies ACG Inc., AGT Electric Cars, Automobiles Chatenet, Bradshaw Electric Vehicles, Citytransformer Ltd., Club Car LLC, Columbia Vehicle Group Inc., Deere & Company, E-Z-GO Technologies Inc., Evolution Electric Vehicles, Garia, Hebei Yudea New Energy Technology Group Co. Ltd., ICON Electric Vehicles, Jiangsu Jinpeng Group Co. Ltd., Kandi Technologies Group Inc., LIGIER GROUP, Moto Electric Vehicles, Polaris Inc., Renault SAS, and Shandong Shifeng Group Co. Ltd.
-
Market Research Insights
- The market is experiencing significant advancements, driven by continuous innovation in various areas. Motor efficiency improvement through motor design and control unit optimization is a key focus, with some manufacturers achieving up to 95% efficiency. Battery pack design is another critical aspect, with Energy Storage solutions employing advanced lithium-ion technology and smart charging strategies to enhance performance and durability. Fuel efficiency standards are pushing the industry to explore energy harvesting techniques and lightweight materials to reduce vehicle weight and improve overall performance. Regulatory compliance is also a significant factor, with stringent safety standards for electrical systems, battery life extension, and emission reduction targets.
- Durability testing, including electromechanical braking and vehicle dynamics, is essential to ensure reliability and longevity. Performance optimization, cost-effective manufacturing, and powertrain integration are ongoing priorities to maintain competitiveness in the evolving urban mobility solutions landscape. Additionally, noise level reduction and motor cooling systems are essential for enhancing the user experience and expanding the market reach. Regulatory compliance, battery safety standards, and speed control algorithms are crucial elements of the evolving LSEV market landscape.
We can help! Our analysts can customize this low speed electric vehicle (lsev) market research report to meet your requirements.
 RIA -
RIA - 
