Lupin Protein Market Size 2024-2028
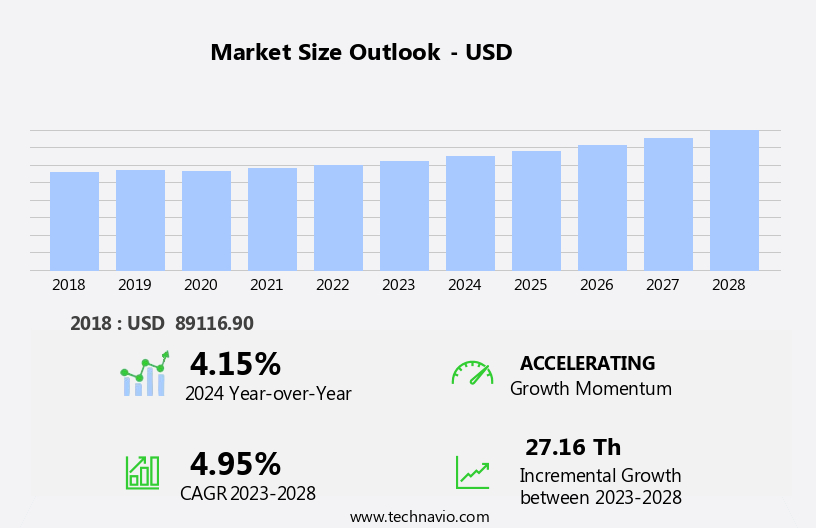
The lupin protein market size is forecast to increase by USD 27.16 th at a CAGR of 4.95% between 2023 and 2028. The market is experiencing significant growth due to the increasing recognition of lupin protein's health benefits.
Major Market Trends & Insights
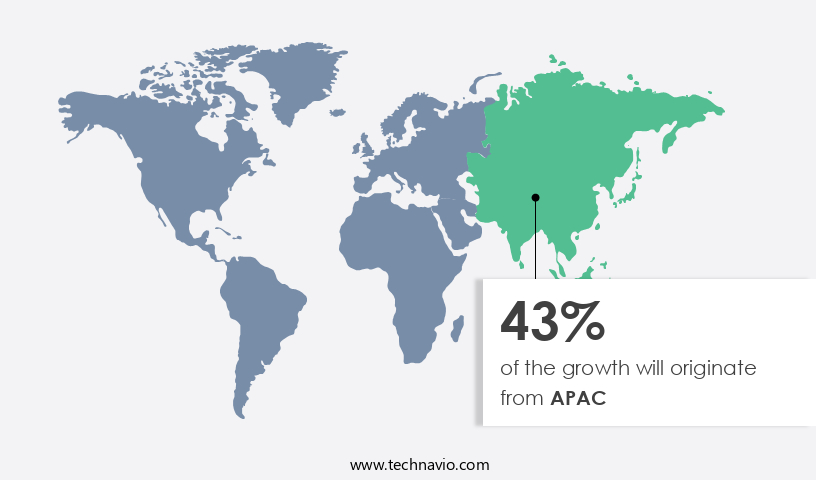
- APAC dominated the market and accounted for a 43% share in 2022.
- The market is expected to grow significantly in APAC region as well over the forecast period.
- Based on the Application, the animal feed segment led the market and was valued at USD 81.45 th of the global revenue in 2022.
- Based on the Source, the conventional segment accounted for the largest market revenue share in 2022.
Market Size & Forecast
- 2024 Market Size: USD 103.62 Th
- Future Opportunities: USD 27.16 Th
- CAGR (2023-2028): 4.95%
- APAC: Largest market in 2022
The market continues to evolve, driven by the increasing demand for plant-based proteins and the ongoing quest for soy-free alternatives. Quality control is a critical factor, with stringent regulatory standards ensuring the safety and efficacy of lupin protein isolate and concentrate. Product innovation is a key trend, with companies exploring new applications in functional foods, nutritional supplements, and meat alternatives. Lupin protein processing and protein extraction techniques are advancing, leading to improved functionality and taste. Genetic modification is a topic of ongoing discussion, with non-GMO lupin gaining traction due to consumer preferences. Lupin flour and lupin meal are finding use in various industries, from food service to retail sales.
What will be the Size of the Lupin Protein Market during the forecast period?
- Distribution channels are expanding, with online sales and direct-to-consumer models gaining popularity. Agricultural practices and sustainability concerns are also influencing market dynamics, with a focus on lupin cultivation and supply chain management. Consumer education and food labeling regulations are important considerations, as dietary preferences and food allergies shape market trends. Functional foods, protein shakes, protein bars, and vegan protein are popular categories, with veganism and health consciousness driving demand. Dairy alternatives and meat substitutes are also gaining ground, as consumers seek plant-based options. Market penetration is a significant challenge, with competition from established players in the protein market, such as hemp protein, pea protein, rice protein, and sunflower seed protein. The nutraceutical segment is the second largest segment of the application and was valued at USD 6.22 million in 2022.
- Pricing strategies and brand awareness are crucial factors in gaining a competitive edge. The environmental impact of lupin cultivation and food processing is another area of focus, with sustainability concerns shaping market dynamics. In the realm of food technology, lupin protein is being explored for its potential in food safety and food allergies. The future of the market is bright, with continued innovation and growth expected in this dynamic and evolving industry.
-
Lupin, a nutrient-dense legume, is rich in essential amino acids, protein, fiber, and minerals, making it an attractive alternative to traditional protein sources. This trend is further bolstered by the rising popularity of sustainable agriculture, as lupin is a nitrogen-fixing crop that improves soil health and reduces the need for synthetic fertilizers. However, the market faces challenges, including the wide availability of substitute products for lupin protein, such as soy and pea protein. Companies seeking to capitalize on the opportunities in this market must focus on differentiating their offerings through unique value propositions, such as superior nutritional profiles or sustainable production methods.
- Additionally, addressing the challenges posed by substitute products will require strategic marketing and competitive pricing to attract and retain customers. Overall, the market's strategic landscape is characterized by growing demand, increasing competition, and the need for innovation to meet evolving consumer preferences.
How is this Lupin Protein Industry segmented?
The lupin protein industry research report provides comprehensive data (region-wise segment analysis), with forecasts and estimates in "USD thousand" for the period 2024-2028, as well as historical data from 2018-2022 for the following segments.
- Application
- Animal feed
- Nutraceutical
- Food and beverages
- Others
- Source
- Conventional
- Organic
- End-User
- Vegan Consumers
- Fitness Enthusiasts
- Food Manufacturers
- Distribution Channel
- B2B
- B2C
- Online Retail
- Product Type
- Lupin Protein Isolate
- Lupin Protein Concentrate
- Lupin Flour
- Geography
- North America
- US
- Mexico
- Europe
- France
- Germany
- Italy
- UK
- Middle East and Africa
- UAE
- APAC
- Australia
- China
- India
- Japan
- South Korea
- South America
- Brazil
- Rest of World (ROW)
- North America
By Application Insights
The animal feed segment is estimated to witness significant growth during the forecast period. The segment was valued at USD 81.45 million in 2022. It continued to the largest segment at a CAGR of 3.28%.
The market experiences growth, particularly in the animal feed segment, due to the increasing demand for nutritious, plant-based proteins. Lupin protein, with its well-balanced amino acid profile and high digestibility, is an attractive alternative to traditional protein sources like soy, fishmeal, and others. Applications of lupin protein in animal feed span across pet food, poultry feed, swine feed, and aquaculture feed. This protein is utilized to partially or fully replace these protein sources, contributing to improved nutritional value in animal feed products. Product innovation is a significant trend in the market, with companies focusing on developing soy-free protein options and allergen-free varieties to cater to diverse dietary preferences.
Regulatory standards play a crucial role in market dynamics, ensuring food safety and adherence to labeling regulations. Protein extraction and processing techniques are continually evolving to optimize yield and improve the functionality of lupin protein. Lupin protein isolate and concentrate are popular forms of this protein, while lupin meal and flour find applications in various industries. Distribution channels are expanding to include retail sales, food service, and nutritional supplements. Agricultural practices and sustainability concerns are also influencing market trends, with a focus on non-GMO lupin and the exploration of alternative protein sources like sunflower seed protein and hemp protein.
Food technology and consumer education are essential factors driving market penetration, with brands investing in supply chain management and brand awareness to meet the growing demand for plant-based protein options. Market penetration is further fueled by the development of functional foods, meat alternatives, protein shakes, and protein bars, catering to the health-conscious consumer. Pricing strategies and environmental impact are key considerations for market participants, as they navigate the complexities of The market.
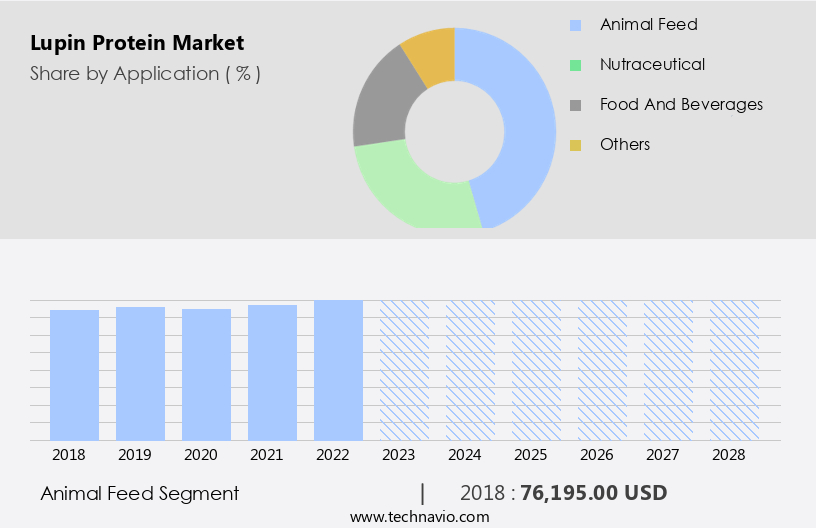
The Animal feed segment was valued at USD 76195.00 th in 2018 and showed a gradual increase during the forecast period.
Regional Analysis
APAC is estimated to contribute 43% to the growth of the global market during the forecast period.Technavio's analysts have elaborately explained the regional trends and drivers that shape the market during the forecast period.
The European the market is experiencing consistent growth due to the increasing demand for plant-based proteins in various industries. Lupin protein, derived from lupin seeds, is gaining popularity for its health benefits and versatility. Data suggests that the future opportunities for growth in the APAC region estimates to be around USD 27.16 Th. It is used extensively in animal feed, food and beverages, and personal care products. Lupin protein is available in various forms, including oil, isolates, concentrates, meal, and flour. Quality control is crucial in the production of lupin protein, ensuring regulatory standards are met. Product innovation is a key trend, with lupin protein being used in new applications such as meat alternatives, protein shakes, and protein bars.
Soy-free protein is another driver, as consumers seek alternatives to soy-based products due to dietary preferences and allergies. Lupin protein extraction and processing techniques have advanced, making it possible to produce high-quality protein isolates and concentrates. These are used in functional foods, retail sales, and food service, contributing to market penetration. Lupin breeding and agricultural practices are also evolving to increase supply and improve sustainability. Genetically modified lupin is a topic of debate, with non-GMO lupin gaining favor among consumers. Allergen-free and gluten-free lupin protein are also in demand, catering to specific dietary needs. Hemp protein and pea protein are competitors, but lupin protein's unique nutritional profile sets it apart.
Lupin protein's environmental impact is a concern, but its production has a lower carbon footprint compared to animal-derived proteins. Rice protein and dairy alternatives are other competitors, but lupin protein's nutritional value and functional properties make it a preferred choice for many consumers. Food labeling regulations and consumer education are essential for brand awareness and transparency in the market. Food safety is a priority, with food technology and food processing techniques ensuring the safety and quality of lupin protein products. Food allergies are a concern, but lupin protein is generally considered safe for those with soy and nut allergies.
Nutritional supplements and meat alternatives are growing markets for lupin protein, with pricing strategies playing a significant role in market penetration. In conclusion, the European the market is dynamic, with various factors influencing its growth and trends. From animal feed to functional foods, lupin protein's versatility and health benefits make it a preferred choice for many consumers and industries.
Market Dynamics
Our researchers analyzed the data with 2023 as the base year, along with the key drivers, trends, and challenges. A holistic analysis of drivers will help companies refine their marketing strategies to gain a competitive advantage.
What are the key market drivers leading to the rise in the adoption of Lupin Protein Industry?
- The increasing recognition of lupin protein's health advantages serves as the primary catalyst for market growth.
ai_driver_content_dynamics_gai.multili
What are the market trends shaping the Lupin Protein Industry?
- The increasing preference for sustainable agriculture practices is a notable market trend. Sustainable agriculture, which focuses on environmentally friendly farming methods, is gaining significant attention and popularity.
ai_trends_content_dynamics_gai.multili
What challenges does the Lupin Protein Industry face during its growth?
- The expansion of the lupin protein industry is constrained by the extensive accessibility of substitute products in the market.
ai_challenge_content_dynamic_gai.multili
Exclusive Customer Landscape
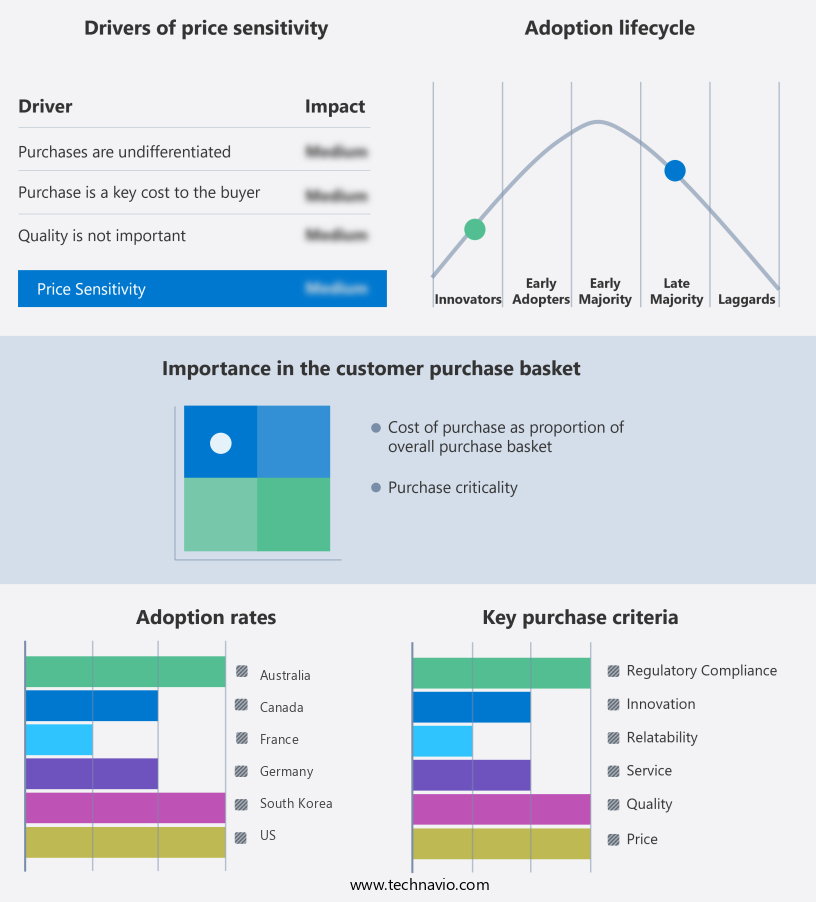
The lupin protein market forecasting report includes the adoption lifecycle of the market, covering from the innovator's stage to the laggard's stage. It focuses on adoption rates in different regions based on penetration. Furthermore, the lupin protein market report also includes key purchase criteria and drivers of price sensitivity to help companies evaluate and develop their market growth analysis strategies.
Customer Landscape
Key Companies & Market Insights
Companies are implementing various strategies, such as strategic alliances, lupin protein market forecast, partnerships, mergers and acquisitions, geographical expansion, and product/service launches, to enhance their presence in the industry.
ADM - The company specializes in the production and supply of high-quality lupin protein products, including Lupin Peptide and Lupin Protein Hydrolysate. These innovative offerings are derived from lupin beans, a sustainable and nutrient-dense legume. Lupin proteins provide essential amino acids, making them an excellent alternative to traditional animal-derived proteins. Our lupin protein products undergo rigorous processing to ensure optimal nutritional value and functionality for various industries, such as food and beverage, pharmaceuticals, and animal nutrition. By choosing our lupin protein solutions, clients can enhance their offerings with a unique, plant-based protein source while reducing their environmental footprint.
The industry research and growth report includes detailed analyses of the competitive landscape of the market and information about key companies, including:
- ADM
- Agrana Beteiligungs
- Archer Daniels Midland
- Barentz
- Burcon NutraScience
- Cargill Incorporated
- Cosucra Groupe Warcoing
- DuPont
- ETChem
- Frank Food Products
- Glanbia PLC
- Ingredion Incorporated
- Kerry Group
- NOW Foods
- Prolupin GmbH
- Roquette Freres
- Soja Austria
- The Scoular Company
- Yantai Shuangta Food
- Zhejiang Yiwan Bio
Qualitative and quantitative analysis of companies has been conducted to help clients understand the wider business environment as well as the strengths and weaknesses of key industry players. Data is qualitatively analyzed to categorize companies as pure play, category-focused, industry-focused, and diversified; it is quantitatively analyzed to categorize companies as dominant, leading, strong, tentative, and weak.
Recent Development and News in Lupin Protein Market
- In January 2024, Lupin Limited, an Indian pharmaceutical company, announced the launch of its new plant-based protein ingredient, LupinPro, derived from lupin beans. This non-GMO, high-protein ingredient is suitable for various food applications, including plant-based meat alternatives and nutritional supplements (Lupin Limited Press Release, 2024).
- In March 2025, Lupin signed a strategic partnership with Danone, a leading global food company, to co-develop and commercialize plant-based dairy products using LupinPro. This collaboration is expected to strengthen Lupin's position in the rapidly growing plant-based protein market (Danone Press Release, 2025).
- In July 2024, Lupin raised approximately USD50 million in a funding round led by S2G Ventures, a sustainable food and agriculture investment firm. The funds will be used to expand Lupin's production capacity and research and development efforts for its plant-based protein business (PE Hub, 2024).
- In October 2025, the European Commission approved the use of LupinPro as a novel food ingredient, allowing Lupin to enter the European market with its plant-based protein offerings. This approval marks a significant expansion for Lupin in the global plant-based protein market (European Commission Press Release, 2025).
Research Analyst Overview
Lupin protein, a high-protein, nutrient-dense legume, is gaining traction in the global food industry due to its unique functional and nutritional properties. The market for lupin protein is influenced by various factors, including food formulation trends, flavor enhancement, and social media marketing. The glycemic index of lupin protein makes it an attractive alternative to traditional high-glycemic index ingredients, aligning with consumer preferences for healthier food options. Market volatility, driven by import/export regulations and global trade, poses challenges for lupin protein producers. Sustainability certifications, such as fair trade and organic farming, are increasingly important for consumer trust and product differentiation.
Lupin protein hydrolysate, with its emulsifying properties and texture modification capabilities, offers competitive advantages in various food applications. Fiber content, amino acid profile, and nutritional value are key factors influencing the adoption of lupin protein in food formulation. Innovation strategies, data analytics, and customer relationship management are essential for companies to stay competitive in this dynamic market. Pricing fluctuations and protein solubility are critical considerations for manufacturers. Customer segmentation and public relations are crucial for reaching diverse consumer groups. Antioxidant properties and water binding capacity are additional benefits that can enhance the appeal of lupin protein in the food industry.
Overall, the market is characterized by continuous innovation and adaptation to consumer demands and market trends.
Dive into Technavio's robust research methodology, blending expert interviews, extensive data synthesis, and validated models for unparalleled Lupin Protein Market insights. See full methodology.
|
Market Scope |
|
|
Report Coverage |
Details |
|
Page number |
193 |
|
Base year |
2023 |
|
Historic period |
2018-2022 |
|
Forecast period |
2024-2028 |
|
Growth momentum & CAGR |
Accelerate at a CAGR of 4.95% |
|
Market growth 2024-2028 |
USD 27.16 thousand |
|
Market structure |
Fragmented |
|
YoY growth 2023-2024(%) |
4.15 |
|
Key countries |
US, China, Germany, Japan, UK, Australia, India, France, Brazil, UAE, Rest of World (ROW), Saudi Arabia, France, South Korea, Mexico, and Italy |
|
Competitive landscape |
Leading Companies, Market Positioning of Companies, Competitive Strategies, and Industry Risks |
What are the Key Data Covered in this Lupin Protein Market Research and Growth Report?
- CAGR of the Lupin Protein industry during the forecast period
- Detailed information on factors that will drive the growth and forecasting between 2024 and 2028
- Precise estimation of the size of the market and its contribution of the industry in focus to the parent market
- Accurate predictions about upcoming growth and trends and changes in consumer behaviour
- Growth of the market across Europe, APAC, North America, South America, and Middle East and Africa
- Thorough analysis of the market's competitive landscape and detailed information about companies
- Comprehensive analysis of factors that will challenge the lupin protein market growth of industry companies
We can help! Our analysts can customize this lupin protein market research report to meet your requirements.
 RIA -
RIA - 
