Luxury E-tailing Market Analysis APAC, North America, Europe, Middle East and Africa, South America - China, US, Japan, Italy, France - Size and Forecast 2024-2028

Luxury E-tailing Market Analysis APAC, North America, Europe, Middle East and Africa, South America - China, US, Japan, Italy, France - Size and Forecast 2024-2028

Published: May 2024 171 Pages SKU: IRTNTR70588

Market Overview at a Glance

$32.48 B
Market Opportunity
9.12%
CAGR
8.15
YoY growth 2023-2024(%)

Luxury E-Tailing Market Size 2024-2028

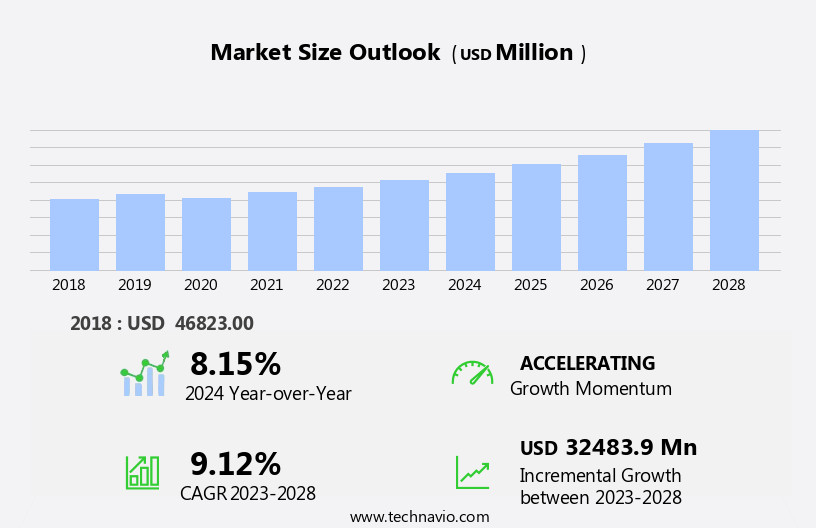
The luxury e-tailing market size is forecast to increase by USD 32.48 billion, at a CAGR of 9.12% between 2023 and 2028.

  • The market is experiencing significant growth, driven by the rising trend of online spending and the increasing penetration of smartphones. These factors have led to an increase in consumer preference for purchasing luxury goods through digital channels. However, the market faces stiff competition from offline retailers, who continue to dominate the luxury goods sector. To remain competitive, luxury e-tailers must focus on multichannel marketing strategies, leveraging both online and offline channels to reach consumers. Additionally, providing exceptional customer service and ensuring product authenticity are crucial challenges for luxury e-tailers, as consumers demand a seamless shopping experience and assurance of authenticity when purchasing high-end items online.
  • Brands such as Net-a-Porter, Farfetch, and Yoox have successfully navigated these challenges by offering personalized shopping experiences, expedited shipping, and robust authentication processes. To capitalize on the market's potential, companies must continue to innovate and differentiate themselves through superior customer service, authenticity guarantees, and strategic multichannel marketing initiatives.

What will be the Size of the Luxury E-Tailing Market during the forecast period?

Luxury E-Tailing Market Size

Explore in-depth regional segment analysis with market size data - historical 2018-2022 and forecasts 2024-2028 - in the full report.  
 Request Free Sample

  • The market continues to evolve, driven by advancements in technology and shifting consumer preferences. Customer service chatbots facilitate seamless interactions, while mobile commerce optimization caters to the growing number of shoppers using mobile devices. Customer relationship management systems enable personalized engagement, and fraud detection systems ensure secure transactions. Shipping and logistics are optimized through order management systems and data analytics dashboards, providing real-time visibility into inventory levels and delivery statuses. International shipping options expand reach, and omnichannel retail strategies offer a seamless shopping experience across channels. Virtual try-on technology and augmented reality shopping enhance the customer experience, while luxury product photography showcases offerings in high definition.
  • Personalization engines and e-commerce personalization cater to individual preferences, driving conversion rate optimization. Influencer marketing strategies and social commerce integration broaden reach, and AI-powered recommendations suggest relevant products. Website performance monitoring ensures a smooth shopping journey, and high-value product display captures attention. Luxury brand storytelling and secure payment gateways build trust, and customer loyalty programs retain shoppers. Supply chain optimization and returns management processes streamline operations, and search engine optimization increases visibility. Three-dimensional product visualization and luxury packaging solutions complete the luxury shopping experience, setting the stage for continued innovation in the dynamic luxury e-commerce landscape.

How is this Luxury E-Tailing Industry segmented?

The luxury e-tailing industry research report provides comprehensive data (region-wise segment analysis), with forecasts and estimates in "USD million" for the period 2024-2028, as well as historical data from 2018-2022 for the following segments.

  • Product
    • Personal luxury
    • Food and wine
    • Home accessories
  • Channel
    • Multibrand
    • Monobrand
  • Geography
    • North America
      • US
    • Europe
      • France
      • Italy
    • APAC
      • China
      • Japan
    • Rest of World (ROW)

    By Product Insights

    The personal luxury segment is estimated to witness significant growth during the forecast period.

    In the market, customer service chatbots facilitate seamless interactions, enhancing the shopping experience. Mobile commerce optimization is a priority, catering to the growing number of smartphone users. Customer relationship management systems enable personalized engagement, while fraud detection ensures secure transactions. Shipping and logistics solutions optimize delivery times, and international shipping options expand reach. An omnichannel retail strategy integrates online and offline channels, with order management systems streamlining operations. Data analytics dashboards provide valuable insights, informing supply chain optimization and inventory management. Virtual try-on technology and 3D product visualization offer immersive shopping experiences. Luxury e-commerce platforms prioritize personalization engines and e-commerce personalization.

    Customer loyalty programs and conversion rate optimization strategies retain customers. Influencer marketing and luxury brand storytelling boost sales, while secure payment gateways assure customer confidence. Search engine optimization and returns management processes enhance customer service. Augmented reality shopping and luxury packaging solutions add value to the overall experience. AI-powered recommendations and website performance monitoring ensure a seamless user journey. Luxury goods inventory is managed efficiently, and email marketing automation maintains consistent communication. Overall, the market is evolving, with a focus on enhancing customer experience, optimizing operations, and ensuring security.

    Luxury E-Tailing Market Size

    Request Free Sample

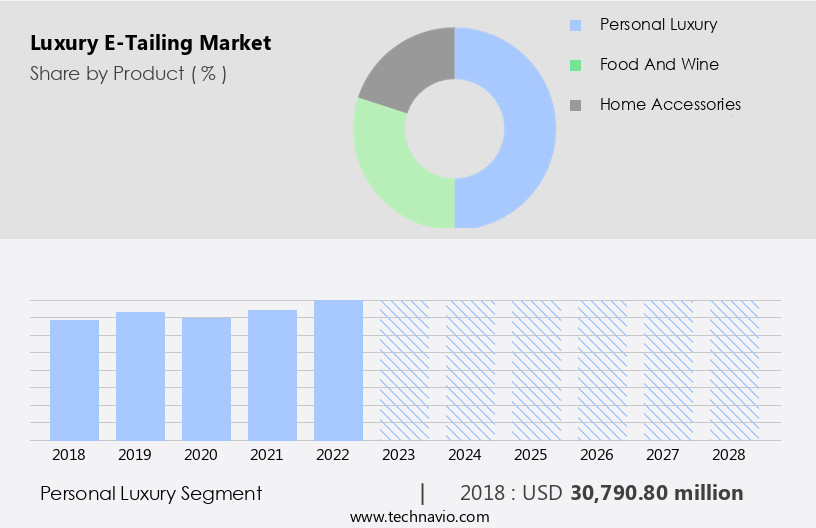
    The Personal luxury segment was valued at USD 30.79 billion in 2018 and showed a gradual increase during the forecast period.

    Regional Analysis

    APAC is estimated to contribute 51% to the growth of the global market during the forecast period.Technavio’s analysts have elaborately explained the regional trends and drivers that shape the market during the forecast period.

    Luxury E-Tailing Market Share by Geography

     Request Free Sample

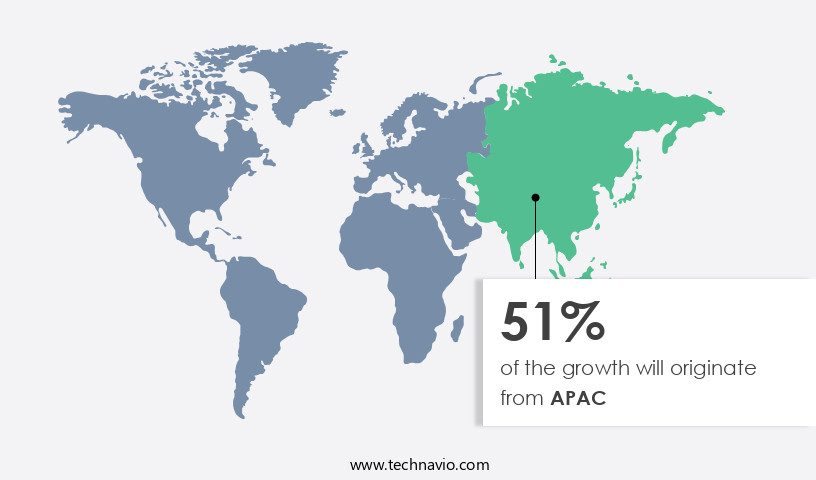
    The market in the Asia Pacific region is poised for substantial growth during the forecast period. Globalization has facilitated the trade of luxury goods worldwide, creating numerous avenues for their import and export. The expansion of the real estate sector, particularly in the residential and commercial spheres, serves as a significant catalyst for the market's growth in this region. Japan, China, and South Korea are the leading contributors to the market's revenue.

    China, the world's most populous country, is undergoing rapid urbanization, leading to a surge in demand for real estate. Consequently, the online furniture market in China is expected to thrive, contributing to the overall growth of the market in the Asia Pacific region.

    Market Dynamics

    Our researchers analyzed the data with 2023 as the base year, along with the key drivers, trends, and challenges. A holistic analysis of drivers will help companies refine their marketing strategies to gain a competitive advantage.

    The market, a significant and continually evolving segment of the retail industry, encompasses the sale of high-end, premium products through digital channels. This market caters to consumers seeking a refined shopping experience, focusing on convenience, personalization, and exclusivity. With considerations like expedited shipping, secure payment gateways, and seamless user experiences becoming increasingly important, luxury e-tailers employ various strategies to meet these demands. Key areas involve the implementation of advanced technologies such as artificial intelligence and machine learning to enhance customer service and personalization. Through methods such as chatbots and recommendation engines, these technologies help luxury e-tailers deliver tailored shopping experiences that cater to each customer's unique preferences. Furthermore, luxury e-tailers often invest in high-quality visual content and immersive product presentations to showcase their offerings in the best possible light. Moreover, the market players focus on providing a sense of exclusivity by offering limited-edition collections, collaborations, and personalized services. These initiatives aim to create a strong emotional connection with customers, fostering brand loyalty and repeat purchases. Additionally, luxury e-tailers often partner with logistics companies to ensure swift and discreet delivery, further enhancing the overall shopping experience. In conclusion, the market continues to grow and adapt to the changing needs of affluent consumers. By embracing advanced technologies, offering personalized services, and delivering an exclusive shopping experience, luxury e-tailers can differentiate themselves from their competitors and thrive in this dynamic market.

    What are the key market drivers leading to the rise in the adoption of Luxury E-Tailing Industry?

    • The concurrent increase in online spending and smartphone penetration serves as the primary catalyst for market growth. 

    ai_test_driver_explanation_gai.multili

    What are the market trends shaping the Luxury E-Tailing Industry?

    • Multichannel marketing is an emerging trend in marketing, which involves reaching customers through multiple channels to provide a seamless and integrated customer experience. This approach allows businesses to engage with their audience in a more comprehensive and effective manner.

    • Influencer marketing strategies have become essential for luxury brands looking to increase their online presence and reach a wider audience. Social media platforms, such as Facebook, Twitter, Instagram, and YouTube, serve as valuable tools for companies to showcase their premium cosmetics products and engage with consumers. For instance, Nykaa's successful influencer marketing campaign in February 2023, aimed at launching and promoting its clay it cool mask range, demonstrates the power of influencer collaborations. The growing popularity of social commerce integration and the increasing use of AI-powered recommendations further enhance the shopping experience for consumers. companies prioritize high-value product display, ensuring website performance monitoring to maintain a seamless user experience.
    • Luxury goods inventory management is crucial for companies to maintain stock levels and meet consumer demand. Email marketing automation is another effective strategy for engaging with customers and driving sales. Augmented reality shopping experiences offer an immersive and harmonious shopping journey, allowing consumers to virtually try on products before making a purchase. These strategies, coupled with the increasing penetration of the Internet and smartphones, have contributed significantly to the sales volume and revenue growth of market companies.

    What challenges does the Luxury E-Tailing Industry face during its growth?

    • The growth of the industry is significantly impacted by rigorous competition from traditional sales channels, which poses a substantial challenge. 

    • The market encompasses high-value product categories such as personal care, wine, spirits, home décor, home furnishings, and furniture. Consumers often prefer purchasing these items from physical stores due to the ability to inspect products before buying and address queries on the spot. However, the shift to online shopping is gaining momentum, driven by innovative strategies like influencer marketing and social commerce integration. Luxury product photography, a crucial aspect of e-commerce, showcases items in an immersive and harmonious manner, enabling consumers to make informed decisions. AI-powered recommendations based on browsing and purchase history further enhance the shopping experience.
    • Social media platforms are increasingly being used for luxury product promotion and sales, with social commerce integration allowing seamless transactions. Website performance monitoring ensures a seamless shopping experience, while high-value product display and email marketing automation cater to the unique needs of luxury consumers. Augmented reality shopping is also gaining popularity, allowing consumers to virtually try on or visualize products before purchasing. Despite concerns around cybersecurity, the convenience and accessibility offered by online shopping continue to attract consumers. The market is dynamic, with trends such as these shaping its growth.

    Exclusive Customer Landscape

    The luxury e-tailing market forecasting report includes the adoption lifecycle of the market, covering from the innovator’s stage to the laggard’s stage. It focuses on adoption rates in different regions based on penetration. Furthermore, the luxury e-tailing market report also includes key purchase criteria and drivers of price sensitivity to help companies evaluate and develop their market growth analysis strategies.
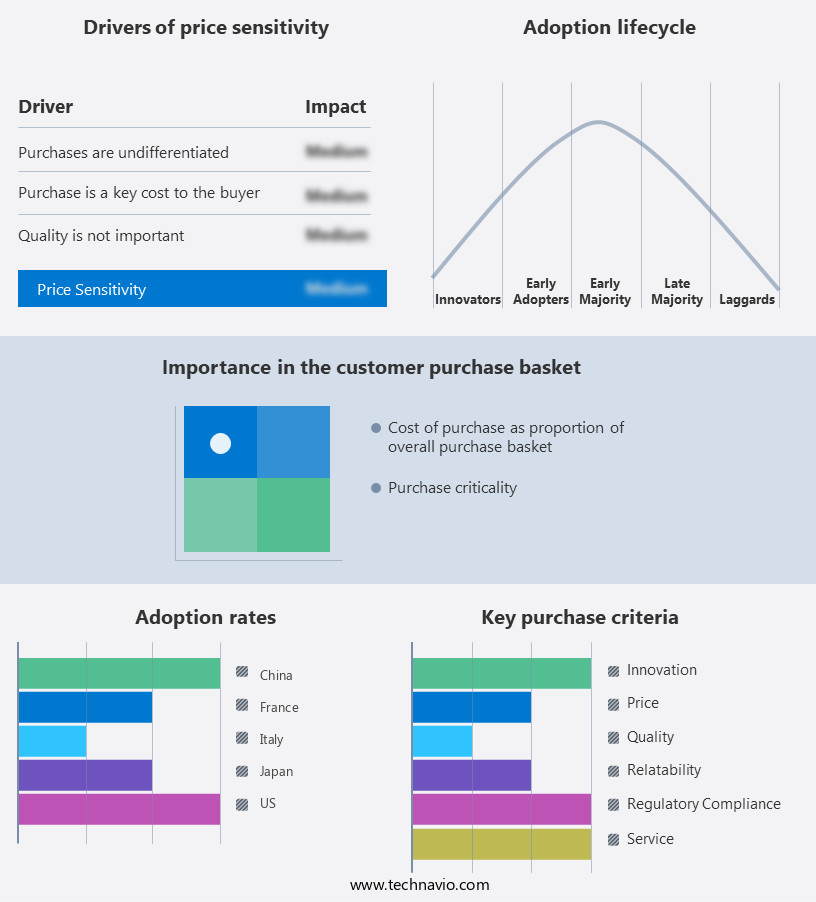
    Luxury E-Tailing Market Share by Geography

     Customer Landscape

    Key Companies & Market Insights

    Companies are implementing various strategies, such as strategic alliances, luxury e-tailing market forecast, partnerships, mergers and acquisitions, geographical expansion, and product/service launches, to enhance their presence in the industry.

    ASOS Plc - This luxury e-commerce platform specializes in the online sale of men's and women's clothing, providing a premium shopping experience for global consumers. Through extensive research, I've identified the company's focus on high-end fashion, exceptional customer service, and strategic marketing efforts that differentiate it from competitors.

    The industry research and growth report includes detailed analyses of the competitive landscape of the market and information about key companies, including:

    • ASOS Plc
    • Authentic Brands Group LLC
    • Bed Bath and Beyond Inc.
    • Burberry Group Plc
    • Chanel Ltd.
    • Charms and Chains
    • Compagnie Financiere Richemont SA
    • Crate and Barrel
    • Harrods Ltd.
    • Hennes and Mauritz AB
    • Hermes International SA
    • Hudsons Bay Co.
    • Inter IKEA Holding B.V.
    • Kering SA
    • Luxuryperfume.com Inc
    • LVMH Group.
    • Moda Operandi Inc.
    • Nordstrom Inc.
    • Ralph Lauren Corp.
    • SDI (Brands 2) Ltd.

    Qualitative and quantitative analysis of companies has been conducted to help clients understand the wider business environment as well as the strengths and weaknesses of key industry players. Data is qualitatively analyzed to categorize companies as pure play, category-focused, industry-focused, and diversified; it is quantitatively analyzed to categorize companies as dominant, leading, strong, tentative, and weak.

    Recent Development and News in Luxury E-Tailing Market

    • In January 2024, Neiman Marcus, a leading luxury department store, announced the launch of its revamped digital platform, "NM Marketplace," in collaboration with Shopify Plus. This partnership aimed to bring over 100 independent luxury brands to Neiman Marcus' online shoppers, expanding their product offerings and enhancing the customer experience (Neiman Marcus Press Release).
    • In March 2024, Farfetch, the luxury fashion platform, secured a strategic investment of USD800 million from Alibaba Group, strengthening its position in the global luxury e-commerce market. This partnership allowed Farfetch to leverage Alibaba's logistics network and reach a broader customer base (Bloomberg).
    • In May 2024, Richemont, the Swiss luxury goods conglomerate, acquired a 40% stake in Yoox Net-A-Porter Group for €2.1 billion. This acquisition allowed Richemont to expand its digital presence and bolster its e-commerce capabilities, merging Yoox Net-A-Porter's expertise with its own luxury brands (Reuters).
    • In April 2025, Gucci, the iconic Italian luxury fashion brand, unveiled its new virtual store on Roblox, a popular gaming platform. This innovative move allowed Gucci to reach a younger demographic and showcase its products in a unique, interactive way, marking a significant step forward in luxury e-tailing's technological advancements (Gucci Press Release).

    Research Analyst Overview

    The market continues to evolve, with innovative applications emerging across various sectors. E-commerce security protocols and customer data privacy remain paramount, ensuring a secure and private shopping experience. High-end fashion e-tailers invest in virtual styling services and mobile app development to enhance the personalized shopping journey. Global e-commerce strategies encompass search engine optimization, luxury product catalogs, and sales conversion funnels to reach a wider audience. Luxury retail technology, such as inventory management tools and luxury customer support, streamline operations and elevate the brand reputation. Online luxury retailers leverage rich media content and exclusive brand experiences to engage customers, while premium customer service and digital marketing analytics drive sales.

    Omnichannel customer journeys integrate website accessibility features and luxury goods distribution, creating seamless shopping experiences. Social media marketing and brand reputation management further expand reach and influence. E-commerce website design plays a crucial role in the success of luxury brands, with a focus on luxury market segmentation and branding. Sales conversion funnels and luxury retail technology optimize the customer experience, while online luxury retailers continually refine their strategies to cater to evolving consumer preferences. The ongoing unfolding of market activities and evolving patterns underscores the dynamic nature of the luxury e-tailing landscape.

    Dive into Technavio’s robust research methodology, blending expert interviews, extensive data synthesis, and validated models for unparalleled Luxury E-Tailing Market insights. See full methodology.

    Market Scope

    Report Coverage

    Details

    Page number

    171

    Base year

    2023

    Historic period

    2018-2022

    Forecast period

    2024-2028

    Growth momentum & CAGR

    Accelerate at a CAGR of 9.12%

    Market growth 2024-2028

    USD 32483.9 million

    Market structure

    Fragmented

    YoY growth 2023-2024(%)

    8.15

    Key countries

    China, US, Japan, Italy, and France

    Competitive landscape

    Leading Companies, Market Positioning of Companies, Competitive Strategies, and Industry Risks

    Request Free Sample

    What are the Key Data Covered in this Luxury E-Tailing Market Research and Growth Report?

    • CAGR of the Luxury E-Tailing industry during the forecast period
    • Detailed information on factors that will drive the growth and forecasting between 2024 and 2028
    • Precise estimation of the size of the market and its contribution of the industry in focus to the parent market
    • Accurate predictions about upcoming growth and trends and changes in consumer behaviour
    • Growth of the market across APAC, North America, Europe, Middle East and Africa, and South America
    • Thorough analysis of the market’s competitive landscape and detailed information about companies
    • Comprehensive analysis of factors that will challenge the luxury e-tailing market growth of industry companies

    We can help! Our analysts can customize this luxury e-tailing market research report to meet your requirements.

    Get in touch


    1 Executive Summary

    • 1.1 Market overview
      • Executive Summary - Chart on Market Overview
      • Executive Summary - Data Table on Market Overview
      • Executive Summary - Chart on Global Market Characteristics
      • Executive Summary - Chart on Market by Geography
      • Executive Summary - Chart on Market Segmentation by Product
      • Executive Summary - Chart on Market Segmentation by Channel
      • Executive Summary - Chart on Incremental Growth
      • Executive Summary - Data Table on Incremental Growth
      • Executive Summary - Chart on Company Market Positioning

    2 Market Landscape

    • 2.1 Market ecosystem
      • Parent Market
      • Data Table on - Parent Market
    • 2.2 Market characteristics
      • Market characteristics analysis
    • 2.3 Value chain analysis
      • Value Chain Analysis

    3 Market Sizing

    • 3.1 Market definition
      • Offerings of companies included in the market definition
    • 3.2 Market segment analysis
      • Market segments
    • 3.3 Market size 2023
      • 3.4 Market outlook: Forecast for 2023-2028
        • Chart on Global - Market size and forecast 2023-2028 ($ million)
        • Data Table on Global - Market size and forecast 2023-2028 ($ million)
        • Chart on Global Market: Year-over-year growth 2023-2028 (%)
        • Data Table on Global Market: Year-over-year growth 2023-2028 (%)

      4 Historic Market Size

      • 4.1 Global Luxury E-Tailing Market 2018 - 2022
        • Historic Market Size - Data Table on Global Luxury E-Tailing Market 2018 - 2022 ($ million)
      • 4.2 Product segment analysis 2018 - 2022
        • Historic Market Size - Product Segment 2018 - 2022 ($ million)
      • 4.3 Channel segment analysis 2018 - 2022
        • Historic Market Size - Channel Segment 2018 - 2022 ($ million)
      • 4.4 Geography segment analysis 2018 - 2022
        • Historic Market Size - Geography Segment 2018 - 2022 ($ million)
      • 4.5 Country segment analysis 2018 - 2022
        • Historic Market Size - Country Segment 2018 - 2022 ($ million)

      5 Five Forces Analysis

      • 5.1 Five forces summary
        • Five forces analysis - Comparison between 2023 and 2028
      • 5.2 Bargaining power of buyers
        • Bargaining power of buyers - Impact of key factors 2023 and 2028
      • 5.3 Bargaining power of suppliers
        • Bargaining power of suppliers - Impact of key factors in 2023 and 2028
      • 5.4 Threat of new entrants
        • Threat of new entrants - Impact of key factors in 2023 and 2028
      • 5.5 Threat of substitutes
        • Threat of substitutes - Impact of key factors in 2023 and 2028
      • 5.6 Threat of rivalry
        • Threat of rivalry - Impact of key factors in 2023 and 2028
      • 5.7 Market condition
        • Chart on Market condition - Five forces 2023 and 2028

      6 Market Segmentation by Product

      • 6.1 Market segments
        • Chart on Product - Market share 2023-2028 (%)
        • Data Table on Product - Market share 2023-2028 (%)
      • 6.2 Comparison by Product
        • Chart on Comparison by Product
        • Data Table on Comparison by Product
      • 6.3 Personal luxury - Market size and forecast 2023-2028
        • Chart on Personal luxury - Market size and forecast 2023-2028 ($ million)
        • Data Table on Personal luxury - Market size and forecast 2023-2028 ($ million)
        • Chart on Personal luxury - Year-over-year growth 2023-2028 (%)
        • Data Table on Personal luxury - Year-over-year growth 2023-2028 (%)
      • 6.4 Food and wine - Market size and forecast 2023-2028
        • Chart on Food and wine - Market size and forecast 2023-2028 ($ million)
        • Data Table on Food and wine - Market size and forecast 2023-2028 ($ million)
        • Chart on Food and wine - Year-over-year growth 2023-2028 (%)
        • Data Table on Food and wine - Year-over-year growth 2023-2028 (%)
      • 6.5 Home accessories - Market size and forecast 2023-2028
        • Chart on Home accessories - Market size and forecast 2023-2028 ($ million)
        • Data Table on Home accessories - Market size and forecast 2023-2028 ($ million)
        • Chart on Home accessories - Year-over-year growth 2023-2028 (%)
        • Data Table on Home accessories - Year-over-year growth 2023-2028 (%)
      • 6.6 Market opportunity by Product
        • Market opportunity by Product ($ million)
        • Data Table on Market opportunity by Product ($ million)

      7 Market Segmentation by Channel

      • 7.1 Market segments
        • Chart on Channel - Market share 2023-2028 (%)
        • Data Table on Channel - Market share 2023-2028 (%)
      • 7.2 Comparison by Channel
        • Chart on Comparison by Channel
        • Data Table on Comparison by Channel
      • 7.3 Multibrand - Market size and forecast 2023-2028
        • Chart on Multibrand - Market size and forecast 2023-2028 ($ million)
        • Data Table on Multibrand - Market size and forecast 2023-2028 ($ million)
        • Chart on Multibrand - Year-over-year growth 2023-2028 (%)
        • Data Table on Multibrand - Year-over-year growth 2023-2028 (%)
      • 7.4 Monobrand - Market size and forecast 2023-2028
        • Chart on Monobrand - Market size and forecast 2023-2028 ($ million)
        • Data Table on Monobrand - Market size and forecast 2023-2028 ($ million)
        • Chart on Monobrand - Year-over-year growth 2023-2028 (%)
        • Data Table on Monobrand - Year-over-year growth 2023-2028 (%)
      • 7.5 Market opportunity by Channel
        • Market opportunity by Channel ($ million)
        • Data Table on Market opportunity by Channel ($ million)

      8 Customer Landscape

      • 8.1 Customer landscape overview
        • Analysis of price sensitivity, lifecycle, customer purchase basket, adoption rates, and purchase criteria

      9 Geographic Landscape

      • 9.1 Geographic segmentation
        • Chart on Market share by geography 2023-2028 (%)
        • Data Table on Market share by geography 2023-2028 (%)
      • 9.2 Geographic comparison
        • Chart on Geographic comparison
        • Data Table on Geographic comparison
      • 9.3 APAC - Market size and forecast 2023-2028
        • Chart on APAC - Market size and forecast 2023-2028 ($ million)
        • Data Table on APAC - Market size and forecast 2023-2028 ($ million)
        • Chart on APAC - Year-over-year growth 2023-2028 (%)
        • Data Table on APAC - Year-over-year growth 2023-2028 (%)
      • 9.4 North America - Market size and forecast 2023-2028
        • Chart on North America - Market size and forecast 2023-2028 ($ million)
        • Data Table on North America - Market size and forecast 2023-2028 ($ million)
        • Chart on North America - Year-over-year growth 2023-2028 (%)
        • Data Table on North America - Year-over-year growth 2023-2028 (%)
      • 9.5 Europe - Market size and forecast 2023-2028
        • Chart on Europe - Market size and forecast 2023-2028 ($ million)
        • Data Table on Europe - Market size and forecast 2023-2028 ($ million)
        • Chart on Europe - Year-over-year growth 2023-2028 (%)
        • Data Table on Europe - Year-over-year growth 2023-2028 (%)
      • 9.6 Middle East and Africa - Market size and forecast 2023-2028
        • Chart on Middle East and Africa - Market size and forecast 2023-2028 ($ million)
        • Data Table on Middle East and Africa - Market size and forecast 2023-2028 ($ million)
        • Chart on Middle East and Africa - Year-over-year growth 2023-2028 (%)
        • Data Table on Middle East and Africa - Year-over-year growth 2023-2028 (%)
      • 9.7 South America - Market size and forecast 2023-2028
        • Chart on South America - Market size and forecast 2023-2028 ($ million)
        • Data Table on South America - Market size and forecast 2023-2028 ($ million)
        • Chart on South America - Year-over-year growth 2023-2028 (%)
        • Data Table on South America - Year-over-year growth 2023-2028 (%)
      • 9.8 China - Market size and forecast 2023-2028
        • Chart on China - Market size and forecast 2023-2028 ($ million)
        • Data Table on China - Market size and forecast 2023-2028 ($ million)
        • Chart on China - Year-over-year growth 2023-2028 (%)
        • Data Table on China - Year-over-year growth 2023-2028 (%)
      • 9.9 US - Market size and forecast 2023-2028
        • Chart on US - Market size and forecast 2023-2028 ($ million)
        • Data Table on US - Market size and forecast 2023-2028 ($ million)
        • Chart on US - Year-over-year growth 2023-2028 (%)
        • Data Table on US - Year-over-year growth 2023-2028 (%)
      • 9.10 Japan - Market size and forecast 2023-2028
        • Chart on Japan - Market size and forecast 2023-2028 ($ million)
        • Data Table on Japan - Market size and forecast 2023-2028 ($ million)
        • Chart on Japan - Year-over-year growth 2023-2028 (%)
        • Data Table on Japan - Year-over-year growth 2023-2028 (%)
      • 9.11 Italy - Market size and forecast 2023-2028
        • Chart on Italy - Market size and forecast 2023-2028 ($ million)
        • Data Table on Italy - Market size and forecast 2023-2028 ($ million)
        • Chart on Italy - Year-over-year growth 2023-2028 (%)
        • Data Table on Italy - Year-over-year growth 2023-2028 (%)
      • 9.12 France - Market size and forecast 2023-2028
        • Chart on France - Market size and forecast 2023-2028 ($ million)
        • Data Table on France - Market size and forecast 2023-2028 ($ million)
        • Chart on France - Year-over-year growth 2023-2028 (%)
        • Data Table on France - Year-over-year growth 2023-2028 (%)
      • 9.13 Market opportunity by geography
        • Market opportunity by geography ($ million)
        • Data Tables on Market opportunity by geography ($ million)

      10 Drivers, Challenges, and Opportunity/Restraints

      • 10.1 Market drivers
        • 10.2 Market challenges
          • 10.3 Impact of drivers and challenges
            • Impact of drivers and challenges in 2023 and 2028
          • 10.4 Market opportunities/restraints

            11 Competitive Landscape

            • 11.1 Overview
              • 11.2 Competitive Landscape
                • Overview on criticality of inputs and factors of differentiation
              • 11.3 Landscape disruption
                • Overview on factors of disruption
              • 11.4 Industry risks
                • Impact of key risks on business

              12 Competitive Analysis

              • 12.1 Companies profiled
                • Companies covered
              • 12.2 Market positioning of companies
                • Matrix on companies position and classification
              • 12.3 ASOS Plc
                • ASOS Plc - Overview
                • ASOS Plc - Business segments
                • ASOS Plc - Key news
                • ASOS Plc - Key offerings
                • ASOS Plc - Segment focus
              • 12.4 Authentic Brands Group LLC
                • Authentic Brands Group LLC - Overview
                • Authentic Brands Group LLC - Product / Service
                • Authentic Brands Group LLC - Key offerings
              • 12.5 Bed Bath and Beyond Inc.
                • Bed Bath and Beyond Inc. - Overview
                • Bed Bath and Beyond Inc. - Product / Service
                • Bed Bath and Beyond Inc. - Key news
                • Bed Bath and Beyond Inc. - Key offerings
              • 12.6 Burberry Group Plc
                • Burberry Group Plc - Overview
                • Burberry Group Plc - Business segments
                • Burberry Group Plc - Key news
                • Burberry Group Plc - Key offerings
                • Burberry Group Plc - Segment focus
              • 12.7 Chanel Ltd.
                • Chanel Ltd. - Overview
                • Chanel Ltd. - Product / Service
                • Chanel Ltd. - Key offerings
              • 12.8 Compagnie Financiere Richemont SA
                • Compagnie Financiere Richemont SA - Overview
                • Compagnie Financiere Richemont SA - Business segments
                • Compagnie Financiere Richemont SA - Key news
                • Compagnie Financiere Richemont SA - Key offerings
                • Compagnie Financiere Richemont SA - Segment focus
              • 12.9 Crate and Barrel
                • Crate and Barrel - Overview
                • Crate and Barrel - Product / Service
                • Crate and Barrel - Key offerings
              • 12.10 Harrods Ltd.
                • Harrods Ltd. - Overview
                • Harrods Ltd. - Product / Service
                • Harrods Ltd. - Key offerings
              • 12.11 Hennes and Mauritz AB
                • Hennes and Mauritz AB - Overview
                • Hennes and Mauritz AB - Product / Service
                • Hennes and Mauritz AB - Key news
                • Hennes and Mauritz AB - Key offerings
              • 12.12 Hermes International SA
                • Hermes International SA - Overview
                • Hermes International SA - Business segments
                • Hermes International SA - Key news
                • Hermes International SA - Key offerings
                • Hermes International SA - Segment focus
              • 12.13 Hudsons Bay Co.
                • Hudsons Bay Co. - Overview
                • Hudsons Bay Co. - Product / Service
                • Hudsons Bay Co. - Key offerings
              • 12.14 Inter IKEA Holding B.V.
                • Inter IKEA Holding B.V. - Overview
                • Inter IKEA Holding B.V. - Product / Service
                • Inter IKEA Holding B.V. - Key news
                • Inter IKEA Holding B.V. - Key offerings
              • 12.15 Luxuryperfume.com Inc
                • Luxuryperfume.com Inc - Overview
                • Luxuryperfume.com Inc - Product / Service
                • Luxuryperfume.com Inc - Key offerings
              • 12.16 Moda Operandi Inc.
                • Moda Operandi Inc. - Overview
                • Moda Operandi Inc. - Product / Service
                • Moda Operandi Inc. - Key offerings
              • 12.17 SDI (Brands 2) Ltd.
                • SDI (Brands 2) Ltd. - Overview
                • SDI (Brands 2) Ltd. - Product / Service
                • SDI (Brands 2) Ltd. - Key offerings

              13 Appendix

              • 13.1 Scope of the report
                • 13.2 Inclusions and exclusions checklist
                  • Inclusions checklist
                  • Exclusions checklist
                • 13.3 Currency conversion rates for US$
                  • Currency conversion rates for US$
                • 13.4 Research methodology
                  • Research methodology
                • 13.5 Data procurement
                  • Information sources
                • 13.6 Data validation
                  • Data validation
                • 13.7 Validation techniques employed for market sizing
                  • Validation techniques employed for market sizing
                • 13.8 Data synthesis
                  • Data synthesis
                • 13.9 360 degree market analysis
                  • 360 degree market analysis
                • 13.10 List of abbreviations
                  • List of abbreviations

                Research Methodology

                Technavio presents a detailed picture of the market by way of study, synthesis, and summation of data from multiple sources. The analysts have presented the various facets of the market with a particular focus on identifying the key industry influencers. The data thus presented is comprehensive, reliable, and the result of extensive research, both primary and secondary.

                INFORMATION SOURCES

                Primary sources

                • Manufacturers and suppliers
                • Channel partners
                • Industry experts
                • Strategic decision makers

                Secondary sources

                • Industry journals and periodicals
                • Government data
                • Financial reports of key industry players
                • Historical data
                • Press releases

                DATA ANALYSIS

                Data Synthesis

                • Collation of data
                • Estimation of key figures
                • Analysis of derived insights

                Data Validation

                • Triangulation with data models
                • Reference against proprietary databases
                • Corroboration with industry experts

                REPORT WRITING

                Qualitative

                • Market drivers
                • Market challenges
                • Market trends
                • Five forces analysis

                Quantitative

                • Market size and forecast
                • Market segmentation
                • Geographical insights
                • Competitive landscape

                Interested in this report?

                Get your sample now to see our research methodology and insights!

                Download Now

                Frequently Asked Questions

                Luxury E-Tailing market growth will increase by $ 32483.9 mn during 2024-2028.

                The Luxury E-Tailing market is expected to grow at a CAGR of 9.12% during 2024-2028.

                Luxury E-Tailing market is segmented by Product( Personal luxury, Food and wine, Home accessories) Channel( Multibrand, Monobrand, Europe, Middle East and Africa, South America)

                ASOS Plc, Authentic Brands Group LLC, Bed Bath and Beyond Inc., Burberry Group Plc, Chanel Ltd., Charms and Chains, Compagnie Financiere Richemont SA, Crate and Barrel, Harrods Ltd., Hennes and Mauritz AB, Hermes International SA, Hudsons Bay Co., Inter IKEA Holding B.V., Kering SA, Luxuryperfume.com Inc, LVMH Group., Moda Operandi Inc., Nordstrom Inc., Ralph Lauren Corp., SDI (Brands 2) Ltd. are a few of the key vendors in the Luxury E-Tailing market.

                APAC will register the highest growth rate of 51% among the other regions. Therefore, the Luxury E-Tailing market in APAC is expected to garner significant business opportunities for the vendors during the forecast period.

                China, US, Japan, Italy, France

                • Rise in online spending and smartphone penetrationAn increase in Internet penetration has been a key driver for the growth of the global luxury e-tailing market. Online shopping through smart devices has gained popularity over the years because of the high penetration of Internet services is the driving factor this market.
                • improved economic growth is the driving factor this market.
                • and the fluid interface of mobile applications. For instance is the driving factor this market.
                • tablets that offer larger and more tangible interfaces and are frequently used are more suitable for purchasing products online is the driving factor this market.
                • as they ease the decision-making process. Websites provide detailed information on products is the driving factor this market.
                • including quality is the driving factor this market.
                • safety measures is the driving factor this market.
                • and user guidance is the driving factor this market.
                • which has increased the demand for e-retailing. Consumers also feel more comfortable about purchasing products on the go.Security features of online payments is the driving factor this market.
                • free delivery is the driving factor this market.
                • improved online customer services is the driving factor this market.
                • and the customer-friendly designs of online shopping websites are also contributing to the growth of the market. Rising online sales act as a key market driver.The increasing emphasis on m-commerce is mainly driven by the purchase of millions of new smartphones and the creation of more opportunities for buyers to shop. A few of the major retailers is the driving factor this market.
                • such as THE NET is the driving factor this market.
                • serif;">?A is the driving factor this market.
                • serif;">?PORTER GROUP LIMITED is the driving factor this market.
                • The Neiman Marcus Group LLC is the driving factor this market.
                • Nordstrom Inc. is the driving factor this market.
                • and Saks Fifth Avenue is the driving factor this market.
                • have their own mobile applications. eBay and Amazon are the two major vendors in the online space and have mobile applications that are compatible with Windows is the driving factor this market.
                • Blackberry is the driving factor this market.
                • iOS is the driving factor this market.
                • Android is the driving factor this market.
                • and other operating systems. These platforms help users shop conveniently using their mobile devices. This will drive the growth of market in focus during the forecast period. is the driving factor this market.

                The Luxury E-Tailing market vendors should focus on grabbing business opportunities from the Personal luxury segment as it accounted for the largest market share in the base year.
                RIA - Research AI Assistant
                Ask RIA