
Manifolds Market Size 2024-2028
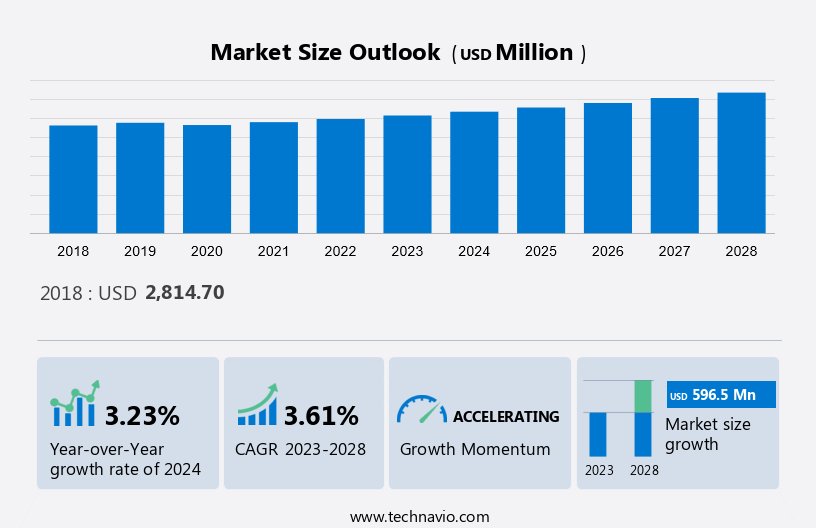
The manifolds market size is estimated to grow by USD 596.5 million, at a CAGR of 3.61% between 2023 and 2028. The escalating demand for oil and natural gas, fueled by rising energy consumption and industrialization, necessitates intensified exploration and production endeavors. Concurrently, stringent regulatory standards regarding vehicular emissions propel the transition towards cleaner fuels, spurring a heightened preference for natural gas as a more environmentally friendly alternative to conventional fossil fuels. Moreover, the surge in deepwater and ultra-deepwater exploration and production activities is motivated by the imperative to access unexplored reserves and counterbalance diminishing output from onshore and shallow-water fields. This trend underscores the industry's strategic shift towards tapping into previously untapped resources and adapting to evolving market dynamics, emphasizing sustainability and efficiency in energy production and consumption practices.
What will be the size of the Market During the Forecast Period?
To learn more about this report, View Report Sample
Market Segmentation
By Application
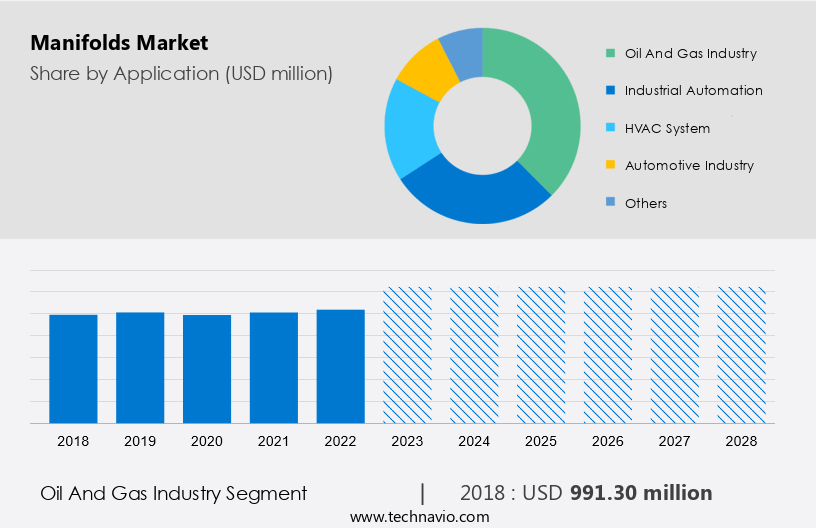
The oil and gas industry segment is estimated to witness significant growth during the forecast period. In the oil and gas industry, manifolds can be used when liquids need to be transferred from a well to a test line or from a storage tank to a production line. The common manifold has a hollow structure and is equipped with valves, fittings (te, elbows, and plugs), pipes, tubes, and pressure machines. The hollow shape of the manifold allows fluid to pass freely through its many ports and onto the production line.
Get a glance at the market contribution of various segments View the PDF Sample
The oil and gas industry segment was the largest and was valued at USD 991.30 million in 2018. The oil and gas industry is undergoing an evolution supported by technological advancements driving increased production capacity and big data integration for real-time data tracking to make informed decisions about the oil and gas industry. Such advances support increased oil and gas production, and growing investment in offshore E&P operations is driving the growth of the oil and gas industry. Thus, this scenario is expected to drive the growth of the market during the forecast period.
By Region
For more insights on the market share of various regions Download PDF Sample now!
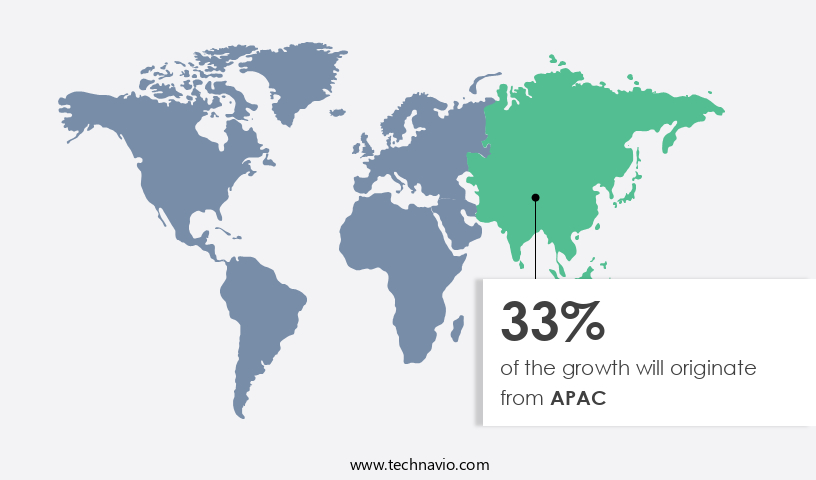
APAC is estimated to contribute 33% to the growth of the global market during the forecast period. Technavio’s analysts have elaborately explained the regional trends and drivers that shape the market during the forecast period. In APAC, Japan, China, and India are the main contributors to the market. Undersea collection projects are expected to increase in the APAC region due to increasing fuel consumption, especially in countries such as India, China, Japan, Korea, and Indonesia. It is estimated that the increase in drilling activity in APAC will lead to strong growth of the market in the future.
Furthermore, stringent vehicle emission standards in countries such as Japan, Korea, China, and Australia are helping to generate revenue from the regional market. The implementation of these regulations led to improvements in the design and components of automotive systems, including manifolds. Thus, such factors will drive the growth of the market in this region during the forecast period.
Market Dynamics and Customer Landscape
In the ever-evolving landscape of the market, key industries such as the Medical Industry, Food Industry, Life Sciences, and Personal Care drive demand for versatile manifold systems. However, market dynamics are also influenced by political factors and social scenarios, reflecting the need for adaptability and resilience. Initiatives like the Survival and Flourishing Fund, spearheaded by individuals like Stephen Grugett and organizations like the Lunar Society, underscore the importance of innovation and collaboration in this sector. With manifold systems playing a pivotal role in various applications across these industries, the market witnesses a continuous evolution to meet the ever-changing demands and challenges of modern society.
Key Market Driver
Growth in demand for oil and natural gas is the key driver for the growth of the market. As the global demand for oil and gas rises, there is a growing need to explore and exploit new reservoirs, leading to increased drilling activities. This has resulted in the drilling of new wells in countries that are not major producers. Additionally, the oil and gas industry is increasingly focusing on offshore exploration and production (E&P) activities due to the larger size and longer lifespan of offshore oil and gas reservoirs compared to onshore ones. This shift towards offshore operations has led to advancements in subsea technologies, subsea production systems, manifolds, control systems, and template manifold designs.
Furthermore, the increasing global demand for oil and natural gas is expected to drive growth in the oil and gas E&P sector. While the costs of offshore drilling are higher, offshore wells typically have larger reserves than onshore wells, allowing upstream companies to extract oil and gas from these significant reserves. This increase in demand for oil and gas is anticipated to lead to increased drilling activities in offshore locations, thereby driving the demand for collectors and boosting market growth in the forecast period.
Significant Market Trends
The growing use of 3D printing is the trend shaping the growth of the market. Various manifold manufacturers are leveraging 3D printing technology in their products, helping to improve energy and design efficiency. 3D printing also reduces manufacturing costs and provides lighter and less expensive manifolds. Removing more metal than necessary is expensive, and often excess metal does not chip, resulting in heavier weights.
In a metal 3D printing process, such as selective laser sintering, a laser traces a micron-thick cross-section of a part, selectively fusing and melting the metal powder layer by layer. This allows engineers to control the amount of material entering the part, using less amount of metal than is required for computer numerical control (CNC) machining. Market players are leveraging these developments to improve efficiency. Hence, such benefits are anticipated to drive the growth of the market during the forecast period.
Major Market Challenge
Threat from counterfeit products affects market growth. Counterfeit products are in the gray market category where the product is genuine, but the sale and distribution are not done by an authorized distributor. Counterfeit and fraudulent hydraulic manifolds are often of poor quality, which means that these products can fail or malfunction under high pressure, affecting the safety and quality of the installation where they are deployed. For original equipment manufacturers (OEMs), counterfeiting and fraud not only lead to potential loss of revenue but can also damage their brand image.
Furthermore, manufacturers of these counterfeit manifold products offer inexpensive manifolds. The challenge is that on the outside, these valves look like exact replicas of the original valve, complete with logos, tampering numbers, patents, serial and serial numbers, and nameplates. As a result, many counterfeit products emerge as a threat to the players operating in the market. Thus, such factors are expected to impede the growth of the market during the forecast period.
Market Customer Landscape
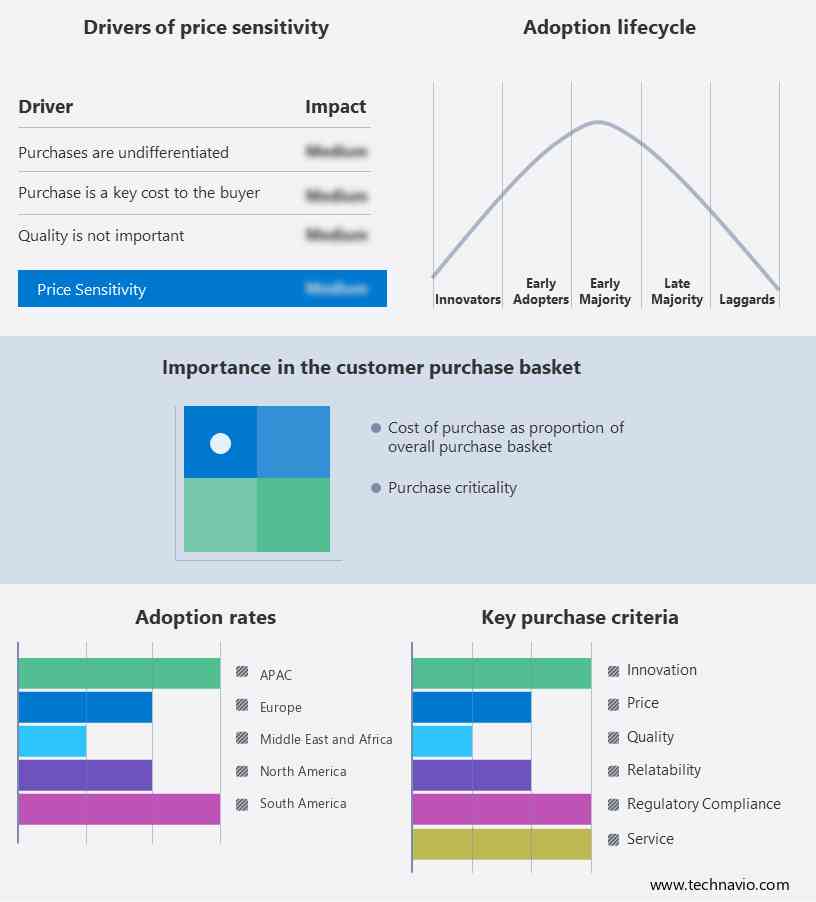
The market research report includes the adoption lifecycle of the market, covering from the innovator’s stage to the laggard’s stage. The market report focuses on adoption rates in different regions based on penetration. Furthermore, the market forecasting report also includes key purchase criteria and drivers of price sensitivity to help companies evaluate and develop their growth strategies.
Global Market Customer Landscape
Who are the Major Market Companies?
Companies are implementing various strategies, such as strategic alliances, partnerships, mergers and acquisitions, geographical expansion, and product/service launches, to enhance their presence in the market.
- Schlumberger Ltd.: The company offers manifolds such as drilling manifolds and chokes, MPD manifolds, and cement manifolds.
The research report also includes detailed analyses of the competitive landscape of the market and information about 20 market companies, including:
- ABB Ltd.
- Berendsen Fluid Power Pty Ltd.
- Dril Quip Inc.
- Eaton Corp. Plc
- Eurofluid Hydraulic S.r.l.
- Forum Energy Technologies Inc.
- General Electric Co.
- Hyspecs Hydraulics NZ
- M and W Hydraulics
- Moog Inc.
- NOV Inc.
- Oilpath Hydraulics Pty Ltd.
- RBV Energy Ltd.
- Parker Hannifin Corp.
- Renishaw Plc
- Robert Bosch GmbH
- TechnipFMC plc
- Weatherford International Plc
- Worldwide Oilfield Machine Inc.
Qualitative and quantitative analysis of companies has been conducted to help clients understand the wider business environment as well as the strengths and weaknesses of key market players. Data is qualitatively analyzed to categorize companies as pure play, category-focused, industry-focused, and diversified; it is quantitatively analyzed to categorize companies as dominant, leading, strong, tentative, and weak.
Segment Overview
The market research report provides comprehensive data (region-wise segment analysis), with forecasts and estimates in "USD Million" for the period 2024 to 2028, as well as historical data from 2018 to 2022 for the following segments.
- Application Outlook
- Oil and gas industry
- Industrial automation
- HVAC system
- Automotive
- Others
- Type Outlook
- Hydraulic
- Pneumatic
- HVAC
- Automotive
- Fluid distribution
- Region Outlook
- North America
- The U.S.
- Canada
- Europe
- The U.K.
- Germany
- France
- Rest of Europe
- APAC
- China
- India
- South America
- Chile
- Brazil
- Argentina
- Middle East & Africa
- Saudi Arabia
- South Africa
- Rest of the Middle East & Africa
- North America
You may also interested in below market reports:
- Automotive Exhaust Manifold Market- Automotive Exhaust Manifold Market Analysis APAC, North America, Europe, South America, Middle East and Africa - US, China, Japan, India, Germany - Size and Forecast
- Hydraulic Manifold Market in UK - Hydraulic Manifold Market in UK by Application, and Type - Forecast and Analysis
- Lyophilization Equipment and Services Market - Lyophilization Equipment and Services Market Analysis North America, Europe, Asia, Rest of World (ROW) - US, Germany, UK, France, Japan - Size and Forecast
Market Analyst Overview
In the market, the interplay of various factors, such as social factors, winning imperatives, and current focus and strategies shapes its trajectory. Companies strive to maintain a cutting-edge position by being an innovator in their product strategy and business strategy, utilizing tools like the Ace matrix and conducting cross-analysis across different industry verticals. With a strong sales network presence, they cater to diverse sectors including the oil and gas sector, focusing on hydrocarbons and surface applications. Moreover, manifold systems find applications in hospital labs for patient epidemiology studies and pipeline analysis, reflecting their versatility and importance across multiple domains. Additionally, initiatives like the Future Fund drive innovation and sustainability in this dynamic market.
|
Market Scope |
|
|
Report Coverage |
Details |
|
Page number |
172 |
|
Base year |
2023 |
|
Historic period |
2018 - 2022 |
|
Forecast period |
2024-2028 |
|
Growth momentum & CAGR |
Accelerate at a CAGR of 3.61% |
|
Market growth 2024-2028 |
USD 596.5 million |
|
Market structure |
Fragmented |
|
YoY growth 2023-2024(%) |
3.23 |
|
Regional analysis |
APAC, Europe, North America, Middle East and Africa, and South America |
|
Performing market contribution |
APAC at 33% |
|
Key countries |
US, China, Germany, India, and UK |
|
Competitive landscape |
Leading Companies, Market Positioning of Companies, Competitive Strategies, and Industry Risks |
|
Key companies profiled |
ABB Ltd., Berendsen Fluid Power Pty Ltd., Dril Quip Inc., Eaton Corp. Plc, Eurofluid Hydraulic S.r.l., Forum Energy Technologies Inc., General Electric Co., Hyspecs Hydraulics NZ, M and W Hydraulics, Moog Inc., NOV Inc., Oilpath Hydraulics Pty Ltd., Parker Hannifin Corp., RBV Energy Ltd., Renishaw Plc, Robert Bosch GmbH, Schlumberger Ltd., TechnipFMC plc, Weatherford International Plc, and Worldwide Oilfield Machine Inc. |
|
Market dynamics |
Parent market analysis, Market growth inducers and obstacles, Fast-growing and slow-growing segment analysis, Market growth and Forecasting, COVID 19 impact and recovery analysis and future consumer dynamics, Market condition analysis for the market forecast period |
|
Customization purview |
If our report has not included the data that you are looking for, you can reach out to our analysts and get segments customized. |
What are the Key Data Covered in this Market Research Report?
- CAGR of the market during the forecast period
- Detailed information on factors that will drive the market growth and forecasting of the market between 2023 and 2027
- Precise estimation of the market size and its contribution to the parent market
- Accurate predictions about upcoming market trends and analysis and changes in consumer behavior
- Growth of the market industry across Europe, North America, APAC, South America, and Middle East and Africa
- Thorough market growth analysis of the market’s competitive landscape and detailed information about companies
- Comprehensive market analysis and report on the factors that will challenge the market research and growth of market companies
We can help! Our analysts can customize this market research report to meet your requirements.
 RIA -
RIA - 
