Automotive Exhaust Manifold Market Analysis, Size, and Forecast 2026-2030: APAC (China, Japan, and India), North America (US, Canada, and Mexico), Europe (Germany, France, and UK), South America (Brazil, Argentina, and Colombia), Middle East and Africa (South Africa, Turkey, and Saudi Arabia), and Rest of World (ROW)

Automotive Exhaust Manifold Market Analysis, Size, and Forecast 2026-2030:
APAC (China, Japan, and India), North America (US, Canada, and Mexico), Europe (Germany, France, and UK), South America (Brazil, Argentina, and Colombia), Middle East and Africa (South Africa, Turkey, and Saudi Arabia), and Rest of World (ROW)

Published: May 2026 304 Pages SKU: IRTNTR72807

Market Overview at a Glance

$839.5 Mn
Market Opportunity
5.6%
CAGR 2025 - 2030
41.5%
APAC Growth
$1.91 B
Passenger car segment 2024

Automotive Exhaust Manifold Market Size 2026-2030

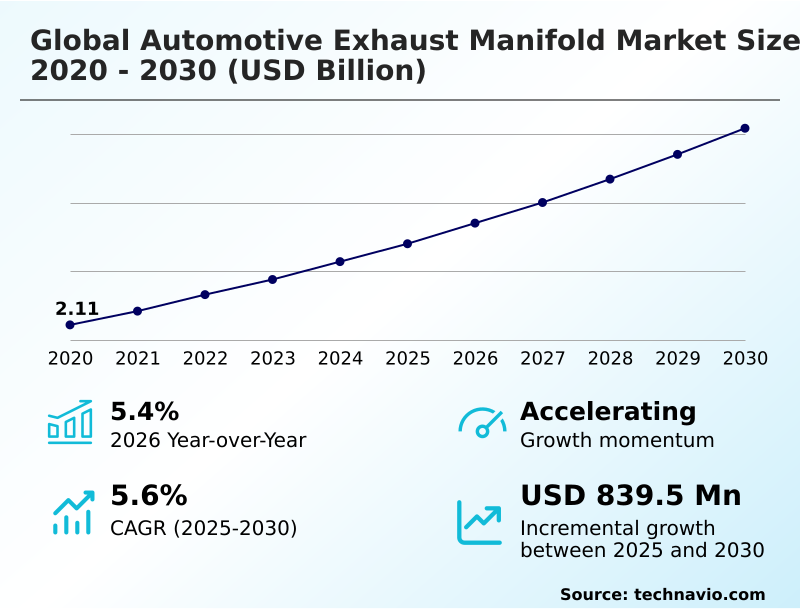
The automotive exhaust manifold market size is valued to increase by USD 839.5 million, at a CAGR of 5.6% from 2025 to 2030. Stringent emissions regulations and mandatory thermal efficiency standards will drive the automotive exhaust manifold market.

Major Market Trends & Insights

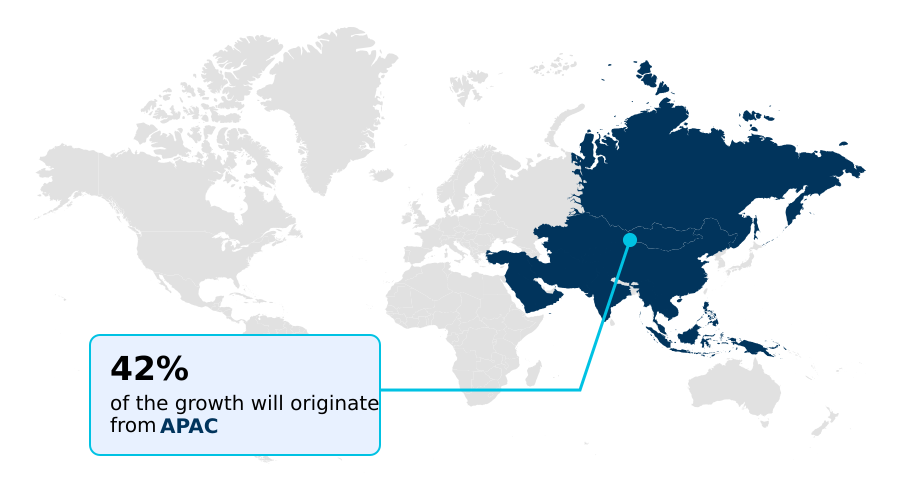
  • APAC dominated the market and accounted for a 41.5% growth during the forecast period.
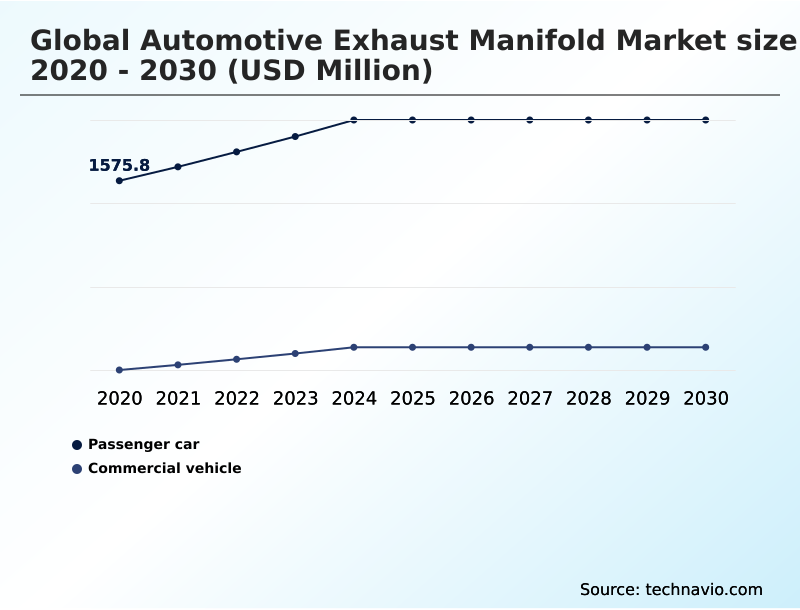
  • By Application - Passenger car segment was valued at USD 1.91 billion in 2024
  • By Fuel Type - Gasoline segment accounted for the largest market revenue share in 2024

Market Size & Forecast

  • Market Opportunities: USD 1.44 billion
  • Market Future Opportunities: USD 839.5 million
  • CAGR from 2025 to 2030 : 5.6%

Market Summary

  • The Automotive Exhaust Manifold Market is undergoing a rapid architectural evolution driven by the absolute necessity to minimize tailpipe emissions while maximizing engine performance. Stringent international emissions regulations compel automakers to replace heavy conventional castings with advanced thin-walled tubular designs that accelerate catalytic converter activation.
  • This regulatory pressure acts as the primary market driver, fueling massive procurement shifts toward high-grade alloys that resist extreme oxidation. In a real-world supply chain scenario, tier-one component manufacturers have upgraded their fabrication lines with automated robotic welding, reducing geometric defect rates by 18% during high-volume production runs.
  • This operational efficiency ensures that complex modular assemblies remain gas-tight under immense thermal stress. Conversely, the aggressive industry transition toward pure battery electric vehicles presents a critical structural challenge, as electric powertrains completely eliminate the need for traditional exhaust infrastructure, thereby shrinking the long-term addressable market.
  • Consequently, component suppliers are optimizing internal combustion architectures to sustain profitability while adapting to shifting macroeconomic vehicle production volumes.

What will be the Size of the Automotive Exhaust Manifold Market during the forecast period?

Get Key Insights on Market Forecast (PDF) Get Free Sample

How is the Automotive Exhaust Manifold Market Segmented?

The automotive exhaust manifold industry research report provides comprehensive data (region-wise segment analysis), with forecasts and estimates in "USD million" for the period 2026-2030, as well as historical data from 2020-2024 for the following segments.

  • Application
    • Passenger car
    • Commercial vehicle
  • Fuel type
    • Gasoline
    • Diesel
  • Material
    • Cast iron
    • Stainless steel
    • Others
  • Distribution channel
    • OEM
    • Aftermarket
  • Geography
    • APAC
      • China
      • Japan
      • India
      • South Korea
      • Thailand
      • Indonesia
    • North America
      • US
      • Canada
      • Mexico
    • Europe
      • Germany
      • France
      • UK
      • Italy
      • Spain
      • Poland
    • South America
      • Brazil
      • Argentina
      • Colombia
    • Middle East and Africa
      • South Africa
      • Turkey
      • Saudi Arabia
      • UAE
      • Egypt

By Application Insights

The passenger car segment is estimated to witness significant growth during the forecast period.

The passenger car application segment demands highly engineered configurations designed to operate as a precise thermal management component within modern engine bays.

Driven by ultra-strict environmental regulations and clean air standards, automakers are aggressively transitioning toward fabricated multi-layer stainless steel designs. This shift addresses corporate average fleet emissions by accelerating heat transfer to downstream emissions control systems.

The lower thermal mass of these advanced assemblies facilitates rapid catalyst light-off, which drastically curtails the release of toxic nitrogen oxides during the critical cold-start phase combustion cycle.

Implementing these lightweight structures has improved overall vehicle fuel efficiency by 12% in specific passenger models. By integrating a close-coupled catalytic converter directly into the manifold, OEM engineers minimize exhaust heat loss, maximizing conversion efficiency and supporting continuous legislative compliance.

Get Free Sample

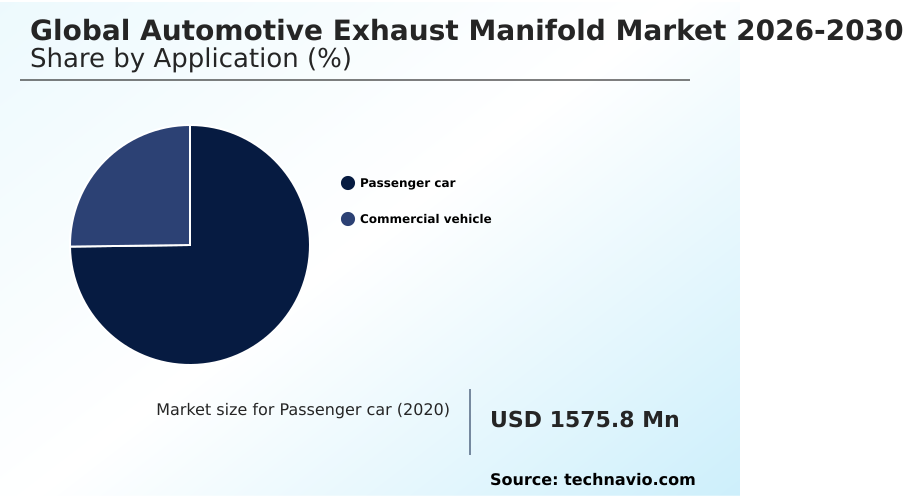
The Passenger car segment was valued at USD 1.91 billion in 2024 and showed a gradual increase during the forecast period.

Get Free Sample

Regional Analysis

APAC is estimated to contribute 41.5% to the growth of the global market during the forecast period.Technavio’s analysts have elaborately explained the regional trends and drivers that shape the market during the forecast period.

See How Automotive Exhaust Manifold Market Demand is Rising in APAC Get Free Sample

The geographic distribution of the Automotive Exhaust Manifold Market reveals stark contrasts in manufacturing adoption and regulatory pressures. While emerging regions favor cast iron, North America and Europe rapidly pivot toward lightweight assemblies to accommodate downsized turbocharged internal combustion engines.

This regional divergence is highlighted by European manufacturers improving catalytic efficiency by 25% through the deployment of complex hybrid-electric vehicle architectures.

To safely manage severe thermal expansion, European suppliers prioritize high-temperature oxidation resistance and structural warping prevention, reducing component warranty claims by 14% compared to traditional markets.

Furthermore, North American engineering facilities are prioritizing fluid dynamics optimization for high-pressure turbochargers to effectively neutralize particulate matter. These strategic material adaptations ensure strict compliance with regional greenhouse gas thresholds while satisfying diverse continental consumer performance expectations.

Market Dynamics

Our researchers analyzed the data with 2025 as the base year, along with the key drivers, trends, and challenges. A holistic analysis of drivers will help companies refine their marketing strategies to gain a competitive advantage.

  • As automotive engineering shifts toward maximizing thermal efficiency, manufacturers must continuously address complex hybrid vehicle thermal retention challenges. Hybrid powertrains experience frequent engine start-stop cycles, requiring advanced exhaust infrastructure that prevents critical heat from dissipating during electric-only operational phases. To mitigate these extreme temperature fluctuations, the industry is accelerating the deployment of dual wall fabricated stainless steel manifolds.
  • These highly sophisticated components feature an insulating air gap that effectively traps exhaust heat, ensuring immediate operational readiness. This thermal management directly supports close coupled catalyst rapid heating, which is absolutely vital for reducing hazardous tailpipe emissions during the initial seconds of combustion.
  • Compared to legacy single-wall cast iron components, these modern dual-wall architectures improve heat retention by nearly 30%, vastly enhancing the performance of downstream emissions control hardware. Furthermore, the rising integration of multi-stage turbocharging exhaust systems in both commercial and premium passenger segments demands absolute structural precision to handle intense backpressure and extreme gas velocities.
  • To achieve these rigorous aerodynamic and structural requirements, tier-one suppliers are heavily investing in automated robotic welding in component fabrication. This advanced manufacturing approach eliminates manual inconsistencies, reducing microscopic weld-seam defects and significantly lowering long-term component failure rates.
  • Through these targeted engineering strategies and advanced material applications, the supply chain continues to optimize internal combustion platforms against escalating international environmental mandates.

What are the key market drivers leading to the rise in the adoption of Automotive Exhaust Manifold Industry?

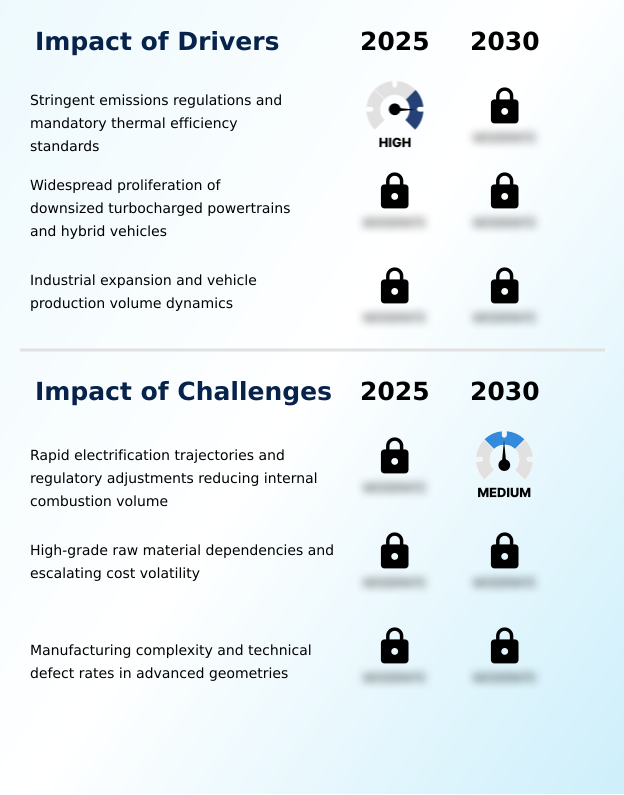
  • Stringent emissions regulations and mandatory thermal efficiency standards propel the industry by forcing automakers to adopt advanced materials that accelerate catalytic converter activation.

  • The aggressive expansion of localized emissions mandates acts as a paramount driver reshaping the Automotive Exhaust Manifold supply chain.
  • Automakers are increasingly securing multi-year procurement contracts for integrated hot-end modules that drastically compress the physical distance between the engine block and primary catalytic converters.
  • To manufacture these complex assemblies, tier-one suppliers leverage predictive machine learning design tools and advanced hydroforming manufacturing technologies. This technological synergy allows engineers to mitigate severe mechanical stresses effectively, improving downstream emissions neutralization by nearly 20%.
  • While traditional cast iron retains its position in sectors demanding extreme structural density, mass-market passenger vehicle production aggressively adopts advanced ferritic stainless steel solutions.
  • Fused seamlessly using robotic gas tungsten arc welding, these premium material structures ensure maximum durability and strict statutory compliance without inflating manufacturing overhead.

What are the market trends shaping the Automotive Exhaust Manifold Industry?

  • The rising integration of close-coupled catalytic converters and modular manifold designs represents a pivotal shift in automotive thermal management. This architectural evolution ensures rapid catalyst activation to strictly comply with escalating international clean air standards.

  • The rapid integration of advanced virtual simulation software is radically reshaping the engineering landscape of the Automotive Exhaust Manifold. Utilizing comprehensive digital twin simulations allows suppliers to evaluate fluid dynamics seamlessly, decreasing physical prototyping overhead by 25%. This digital transition supports the widespread adoption of double-walled manifold fabrications and insulated manifold fabrications designed specifically for modern compact high-efficiency powerplants.
  • By replacing outdated automated sand casting methods with highly precise thin-walled stainless steel architectures, manufacturers achieve critical internal geometries optimization that drastically improves engine backpressure reduction. Consequently, component assembly weight has decreased by up to 18%, significantly enhancing vehicle power-to-weight ratios.
  • Meanwhile, even the heavy-duty long-haul commercial trucks sector is selectively adopting these advanced lightweight configurations, ensuring that continuous thermal innovation aligns flawlessly with rigorous international sustainability targets.

What challenges does the Automotive Exhaust Manifold Industry face during its growth?

  • Rapid electrification trajectories and regulatory adjustments that reduce internal combustion engine volume significantly constrain long-term production forecasts for traditional exhaust infrastructure.

  • The immense manufacturing complexity required to produce modern exhaust infrastructure presents a severe operational challenge for the Automotive Exhaust Manifold industry. Designing aerodynamically optimized manifold geometries to eliminate engine lag demands intricate sheet metal assemblies that endure extreme thermodynamic loads.
  • To combat elevated geometric defect rates, manufacturers must invest heavily in advanced quality control protocols focused strictly on critical weld-seam thinning prevention and reliable micro-porosity reduction. Despite these costly technological upgrades, the integration of hybrid powertrains subjects expensive austenitic stainless steel alloys to high-intensity engine start-stop cycles, accelerating structural thermal fatigue.
  • Furthermore, replacing robust cast iron forces engineers to sacrifice natural vibration dampening qualities to achieve aggressive vehicular lightweighting targets. Implementing these rigorous geometric tolerances has increased localized manufacturing costs by 15%, heavily squeezing operational profit margins for tier-two supply chain participants.

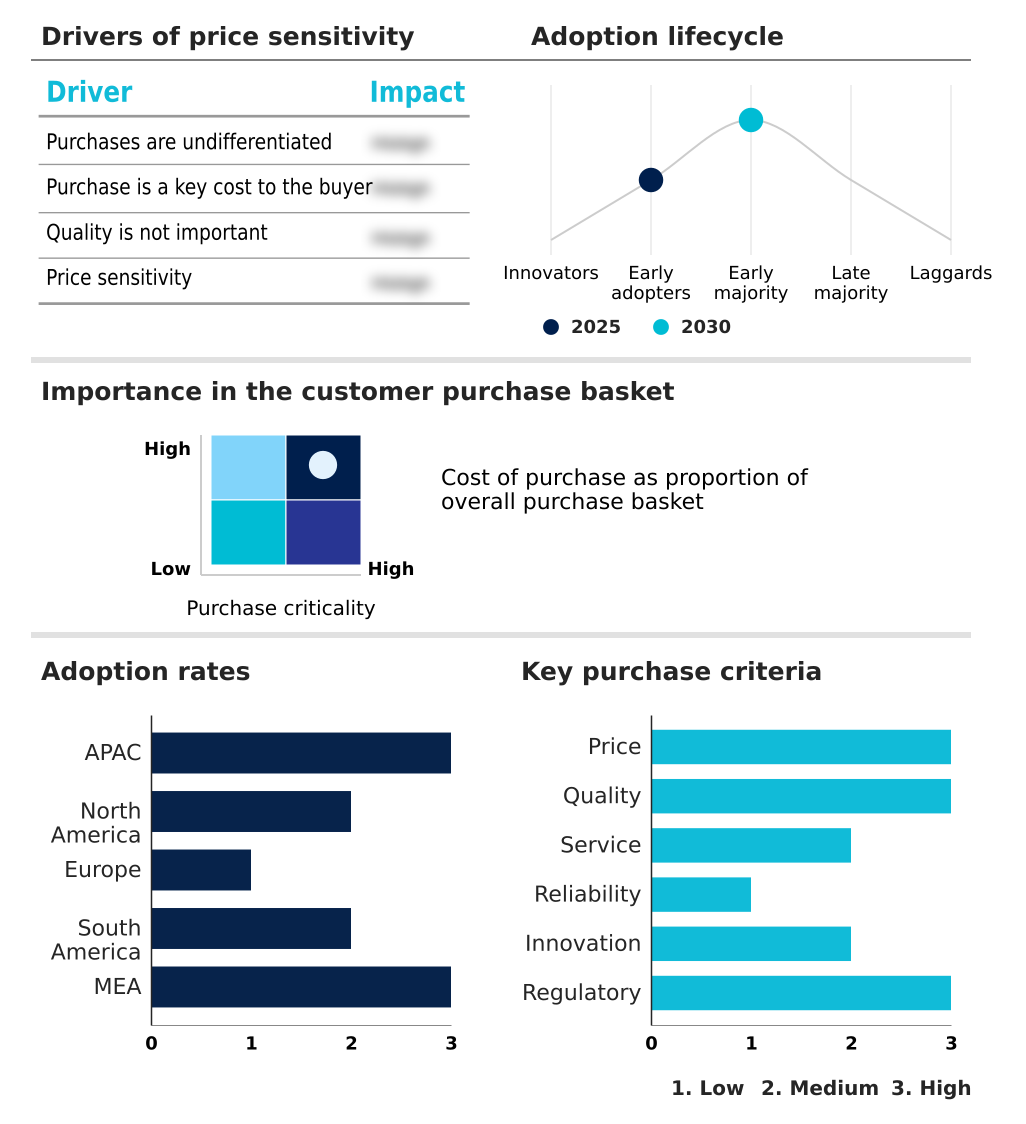
Exclusive Technavio Analysis on Customer Landscape

The automotive exhaust manifold market forecasting report includes the adoption lifecycle of the market, covering from the innovator’s stage to the laggard’s stage. It focuses on adoption rates in different regions based on penetration. Furthermore, the automotive exhaust manifold market report also includes key purchase criteria and drivers of price sensitivity to help companies evaluate and develop their market growth analysis strategies.

Customer Landscape of Automotive Exhaust Manifold Industry

Competitive Landscape

Companies are implementing various strategies, such as strategic alliances, automotive exhaust manifold market forecast, partnerships, mergers and acquisitions, geographical expansion, and product/service launches, to enhance their presence in the industry.

advanced FLOW engineering Inc. - The prominent vendor supplies highly engineered automotive exhaust manifold assemblies including lightweight tubular stainless steel headers and cast iron configurations designed to optimize exhaust flow and structural durability.

The industry research and growth report includes detailed analyses of the competitive landscape of the market and information about key companies, including:

  • advanced FLOW engineering Inc.
  • AP Emissions Technologies
  • Bellows Systems Inc.
  • Benteler International AG
  • Borla Performance Industries
  • Bosal Nederland BV
  • Dorman Products Inc.
  • Eberspacher Gruppe GmbH
  • Forvia SE
  • Friedrich Boysen GmbH and Co.
  • Futaba Industrial Co. Ltd.
  • GP Headers Inc.
  • Ilmor Engineering Inc.
  • Marelli Holdings Co. Ltd.
  • MetalTek International
  • SHARDA MOTOR INDUSTRIES LTD.
  • Stainless Works
  • Tenneco Inc.
  • Vibrant Power Inc.
  • Yutaka Giken Co. Ltd.

Qualitative and quantitative analysis of companies has been conducted to help clients understand the wider business environment as well as the strengths and weaknesses of key industry players. Data is qualitatively analyzed to categorize companies as pure play, category-focused, industry-focused, and diversified; it is quantitatively analyzed to categorize companies as dominant, leading, strong, tentative, and weak.

Recent Development and News in Automotive exhaust manifold market

  • In the Automotive Parts and Equipment industry, the aggressive implementation of Euro VII regulations mandated the integration of advanced thermal management systems, directly impacting Automotive Exhaust Manifold demand by forcing a structural shift toward rapid-heating stainless steel components.
  • The widespread adoption of predictive machine learning design tools optimized aerodynamic fluid routing across engine components, reducing internal airflow resistance by 15% and increasing the engineering complexity required for next-generation Automotive Exhaust Manifold geometries.
  • The continuous transition toward downsized turbocharged internal combustion engines increased average operating temperatures above 950 degrees Celsius, accelerating the Automotive Exhaust Manifold market shift from basic cast iron to highly durable austenitic stainless steel alloys.
  • The integration of multi-piece flexible hot-end modules reduced vehicle assembly line packaging footprints by 10%, heavily influencing Automotive Exhaust Manifold procurement strategies toward modular, pre-assembled catalytic converter configurations.

Dive into Technavio’s robust research methodology, blending expert interviews, extensive data synthesis, and validated models for unparalleled Automotive Exhaust Manifold Market insights. See full methodology.

Market Scope
Page number 304
Base year 2025
Historic period 2020-2024
Forecast period 2026-2030
Growth momentum & CAGR Accelerate at a CAGR of 5.6%
Market growth 2026-2030 USD 839.5 million
Market structure Fragmented
YoY growth 2025-2026(%) 5.4%
Key countries China, Japan, India, South Korea, Thailand, Indonesia, US, Canada, Mexico, Germany, France, UK, Italy, Spain, Poland, Brazil, Argentina, Colombia, South Africa, Turkey, Saudi Arabia, UAE and Egypt
Competitive landscape Leading Companies, Market Positioning of Companies, Competitive Strategies, and Industry Risks

Request Free Sample

Research Analyst Overview

  • The continuous evolution of the Automotive Exhaust Manifold relies heavily on addressing the intense thermal expansion and severe mechanical stresses generated by modern high-output powerplants. To withstand extreme thermodynamic loads frequently exceeding nine hundred degrees Celsius, component suppliers are systematically abandoning traditional heavy cast iron in favor of advanced ferritic stainless steel and premium austenitic stainless steel alloys.
  • This material substitution directly aligns with boardroom-level product strategies focused on aggressive vehicular weight reduction and long-term regulatory compliance. Incorporating these resilient materials allows engineers to develop aerodynamically optimized manifold geometries that smoothly channel exiting exhaust pulses, which effectively minimizes engine lag and maximizes turbocharger efficiency.
  • By adopting these complex fabricated architectures, automotive manufacturers have achieved a 20% reduction in total exhaust system mass, drastically improving fuel economy metrics. This technological transition ensures that internal combustion platforms remain viable amid tightening legislative frameworks, forcing tier-one suppliers to continuously refine automated manufacturing techniques and material procurement strategies to maintain their competitive industrial positioning.

What are the Key Data Covered in this Automotive Exhaust Manifold Market Research and Growth Report?

  • What is the expected growth of the Automotive Exhaust Manifold Market between 2026 and 2030?

    • USD 839.5 million, at a CAGR of 5.6%

  • What segmentation does the market report cover?

    • The report is segmented by Application (Passenger car, and Commercial vehicle), Fuel Type (Gasoline, and Diesel), Material (Cast iron, Stainless steel, and Others), Distribution Channel (OEM, and Aftermarket) and Geography (APAC, North America, Europe, South America, Middle East and Africa)

  • Which regions are analyzed in the report?

    • APAC, North America, Europe, South America and Middle East and Africa

  • What are the key growth drivers and market challenges?

    • Stringent emissions regulations and mandatory thermal efficiency standards, Rapid electrification trajectories and regulatory adjustments reducing internal combustion volume

  • Who are the major players in the Automotive Exhaust Manifold Market?

    • advanced FLOW engineering Inc., AP Emissions Technologies, Bellows Systems Inc., Benteler International AG, Borla Performance Industries, Bosal Nederland BV, Dorman Products Inc., Eberspacher Gruppe GmbH, Forvia SE, Friedrich Boysen GmbH and Co., Futaba Industrial Co. Ltd., GP Headers Inc., Ilmor Engineering Inc., Marelli Holdings Co. Ltd., MetalTek International, SHARDA MOTOR INDUSTRIES LTD., Stainless Works, Tenneco Inc., Vibrant Power Inc. and Yutaka Giken Co. Ltd.

Market Research Insights

  • The Automotive Exhaust Manifold Market is rapidly evolving to support compact high-efficiency powerplants that demand exceptional thermal stability. Automakers are prioritizing the critical cold-start phase combustion cycle by deploying components that rapidly transfer heat to downstream emissions control systems.
  • By utilizing advanced virtual simulation software, engineering teams have reduced prototype development times by 22%, allowing for faster compliance with stringent greenhouse gas thresholds. Furthermore, these optimized geometric designs have lowered exhaust backpressure, improving total engine operational efficiency by up to 14% across modern vehicle fleets.
  • This continuous digital transformation ensures that material innovations align perfectly with regulatory demands and advanced powertrain requirements without inflating manufacturing overhead.

We can help! Our analysts can customize this automotive exhaust manifold market research report to meet your requirements.

Get in touch

1. Executive Summary

1.1 Market overview

Executive Summary - Chart on Market Overview
Executive Summary - Data Table on Market Overview
Executive Summary - Chart on Global Market Characteristics
Executive Summary - Chart on Market by Geography
Executive Summary - Chart on Market Segmentation by Application
Executive Summary - Chart on Market Segmentation by Fuel Type
Executive Summary - Chart on Market Segmentation by Material
Executive Summary - Chart on Market Segmentation by Distribution Channel
Executive Summary - Chart on Incremental Growth
Executive Summary - Data Table on Incremental Growth
Executive Summary - Chart on Company Market Positioning

2. Technavio Analysis

2.1 Analysis of price sensitivity, lifecycle, customer purchase basket, adoption rates, and purchase criteria

2.2 Criticality of inputs and Factors of differentiation

Chart on Overview on criticality of inputs and factors of differentiation

2.3 Factors of disruption

Chart on Overview on factors of disruption

2.4 Impact of drivers and challenges

Chart on Impact of drivers and challenges in 2025 and 2030

3. Market Landscape

3.1 Market ecosystem

Chart on Parent Market
Data Table on - Parent Market

3.2 Market characteristics

Chart on Market characteristics analysis

3.3 Value chain analysis

Chart on Value chain analysis

4. Market Sizing

4.1 Market definition

Data Table on Offerings of companies included in the market definition

4.2 Market segment analysis

Market segments

4.3 Market size 2025

4.4 Market outlook: Forecast for 2025-2030

Chart on Global - Market size and forecast 2025-2030 ($ million)
Data Table on Global - Market size and forecast 2025-2030 ($ million)
Chart on Global Market: Year-over-year growth 2025-2030 (%)
Data Table on Global Market: Year-over-year growth 2025-2030 (%)

5. Historic Market Size

5.1 Global Automotive Exhaust Manifold Market 2020 - 2024

Historic Market Size - Data Table on Global Automotive Exhaust Manifold Market 2020 - 2024 ($ million)

5.2 Application segment analysis 2020 - 2024

Historic Market Size - Application Segment 2020 - 2024 ($ million)

5.3 Fuel Type segment analysis 2020 - 2024

Historic Market Size - Fuel Type Segment 2020 - 2024 ($ million)

5.4 Material segment analysis 2020 - 2024

Historic Market Size - Material Segment 2020 - 2024 ($ million)

5.5 Distribution Channel segment analysis 2020 - 2024

Historic Market Size - Distribution Channel Segment 2020 - 2024 ($ million)

5.6 Geography segment analysis 2020 - 2024

Historic Market Size - Geography Segment 2020 - 2024 ($ million)

5.7 Country segment analysis 2020 - 2024

Historic Market Size - Country Segment 2020 - 2024 ($ million)

6. Qualitative Analysis

6.1 Impact of AI on global automotive exhaust manifold market

6.2 Impact of geopolitical conflicts on global automotive exhaust manifold market

7. Five Forces Analysis

7.1 Five forces summary

Five forces analysis - Comparison between 2025 and 2030

7.2 Bargaining power of buyers

Bargaining power of buyers - Impact of key factors 2025 and 2030

7.3 Bargaining power of suppliers

Bargaining power of suppliers - Impact of key factors in 2025 and 2030

7.4 Threat of new entrants

Threat of new entrants - Impact of key factors in 2025 and 2030

7.5 Threat of substitutes

Threat of substitutes - Impact of key factors in 2025 and 2030

7.6 Threat of rivalry

Threat of rivalry - Impact of key factors in 2025 and 2030

7.7 Market condition

Chart on Market condition - Five forces 2025 and 2030

8. Market Segmentation by Application

8.1 Market segments

Chart on Application - Market share 2025-2030 (%)
Data Table on Application - Market share 2025-2030 (%)

8.2 Comparison by Application

Chart on Comparison by Application
Data Table on Comparison by Application

8.3 Passenger car - Market size and forecast 2025-2030

Chart on Passenger car - Market size and forecast 2025-2030 ($ million)
Data Table on Passenger car - Market size and forecast 2025-2030 ($ million)
Chart on Passenger car - Year-over-year growth 2025-2030 (%)
Data Table on Passenger car - Year-over-year growth 2025-2030 (%)

8.4 Commercial vehicle - Market size and forecast 2025-2030

Chart on Commercial vehicle - Market size and forecast 2025-2030 ($ million)
Data Table on Commercial vehicle - Market size and forecast 2025-2030 ($ million)
Chart on Commercial vehicle - Year-over-year growth 2025-2030 (%)
Data Table on Commercial vehicle - Year-over-year growth 2025-2030 (%)

8.5 Market opportunity by Application

Market opportunity by Application ($ million)
Data Table on Market opportunity by Application ($ million)

9. Market Segmentation by Fuel Type

9.1 Market segments

Chart on Fuel Type - Market share 2025-2030 (%)
Data Table on Fuel Type - Market share 2025-2030 (%)

9.2 Comparison by Fuel Type

Chart on Comparison by Fuel Type
Data Table on Comparison by Fuel Type

9.3 Gasoline - Market size and forecast 2025-2030

Chart on Gasoline - Market size and forecast 2025-2030 ($ million)
Data Table on Gasoline - Market size and forecast 2025-2030 ($ million)
Chart on Gasoline - Year-over-year growth 2025-2030 (%)
Data Table on Gasoline - Year-over-year growth 2025-2030 (%)

9.4 Diesel - Market size and forecast 2025-2030

Chart on Diesel - Market size and forecast 2025-2030 ($ million)
Data Table on Diesel - Market size and forecast 2025-2030 ($ million)
Chart on Diesel - Year-over-year growth 2025-2030 (%)
Data Table on Diesel - Year-over-year growth 2025-2030 (%)

9.5 Market opportunity by Fuel Type

Market opportunity by Fuel Type ($ million)
Data Table on Market opportunity by Fuel Type ($ million)

10. Market Segmentation by Material

10.1 Market segments

Chart on Material - Market share 2025-2030 (%)
Data Table on Material - Market share 2025-2030 (%)

10.2 Comparison by Material

Chart on Comparison by Material
Data Table on Comparison by Material

10.3 Cast iron - Market size and forecast 2025-2030

Chart on Cast iron - Market size and forecast 2025-2030 ($ million)
Data Table on Cast iron - Market size and forecast 2025-2030 ($ million)
Chart on Cast iron - Year-over-year growth 2025-2030 (%)
Data Table on Cast iron - Year-over-year growth 2025-2030 (%)

10.4 Stainless steel - Market size and forecast 2025-2030

Chart on Stainless steel - Market size and forecast 2025-2030 ($ million)
Data Table on Stainless steel - Market size and forecast 2025-2030 ($ million)
Chart on Stainless steel - Year-over-year growth 2025-2030 (%)
Data Table on Stainless steel - Year-over-year growth 2025-2030 (%)

10.5 Others - Market size and forecast 2025-2030

Chart on Others - Market size and forecast 2025-2030 ($ million)
Data Table on Others - Market size and forecast 2025-2030 ($ million)
Chart on Others - Year-over-year growth 2025-2030 (%)
Data Table on Others - Year-over-year growth 2025-2030 (%)

10.6 Market opportunity by Material

Market opportunity by Material ($ million)
Data Table on Market opportunity by Material ($ million)

11. Market Segmentation by Distribution Channel

11.1 Market segments

Chart on Distribution Channel - Market share 2025-2030 (%)
Data Table on Distribution Channel - Market share 2025-2030 (%)

11.2 Comparison by Distribution Channel

Chart on Comparison by Distribution Channel
Data Table on Comparison by Distribution Channel

11.3 OEM - Market size and forecast 2025-2030

Chart on OEM - Market size and forecast 2025-2030 ($ million)
Data Table on OEM - Market size and forecast 2025-2030 ($ million)
Chart on OEM - Year-over-year growth 2025-2030 (%)
Data Table on OEM - Year-over-year growth 2025-2030 (%)

11.4 Aftermarket - Market size and forecast 2025-2030

Chart on Aftermarket - Market size and forecast 2025-2030 ($ million)
Data Table on Aftermarket - Market size and forecast 2025-2030 ($ million)
Chart on Aftermarket - Year-over-year growth 2025-2030 (%)
Data Table on Aftermarket - Year-over-year growth 2025-2030 (%)

11.5 Market opportunity by Distribution Channel

Market opportunity by Distribution Channel ($ million)
Data Table on Market opportunity by Distribution Channel ($ million)

12. Customer Landscape

12.1 Customer landscape overview

Analysis of price sensitivity, lifecycle, customer purchase basket, adoption rates, and purchase criteria

13. Geographic Landscape

13.1 Geographic segmentation

Chart on Market share by geography 2025-2030 (%)
Data Table on Market share by geography 2025-2030 (%)

13.2 Geographic comparison

Chart on Geographic comparison
Data Table on Geographic comparison

13.3 APAC - Market size and forecast 2025-2030

Chart on APAC - Market size and forecast 2025-2030 ($ million)
Data Table on APAC - Market size and forecast 2025-2030 ($ million)
Chart on APAC - Year-over-year growth 2025-2030 (%)
Data Table on APAC - Year-over-year growth 2025-2030 (%)
Chart on Regional Comparison - APAC
Data Table on Regional Comparison - APAC

13.3.1 China - Market size and forecast 2025-2030

Chart on China - Market size and forecast 2025-2030 ($ million)
Data Table on China - Market size and forecast 2025-2030 ($ million)
Chart on China - Year-over-year growth 2025-2030 (%)
Data Table on China - Year-over-year growth 2025-2030 (%)

13.3.2 Japan - Market size and forecast 2025-2030

Chart on Japan - Market size and forecast 2025-2030 ($ million)
Data Table on Japan - Market size and forecast 2025-2030 ($ million)
Chart on Japan - Year-over-year growth 2025-2030 (%)
Data Table on Japan - Year-over-year growth 2025-2030 (%)

13.3.3 India - Market size and forecast 2025-2030

Chart on India - Market size and forecast 2025-2030 ($ million)
Data Table on India - Market size and forecast 2025-2030 ($ million)
Chart on India - Year-over-year growth 2025-2030 (%)
Data Table on India - Year-over-year growth 2025-2030 (%)

13.3.4 South Korea - Market size and forecast 2025-2030

Chart on South Korea - Market size and forecast 2025-2030 ($ million)
Data Table on South Korea - Market size and forecast 2025-2030 ($ million)
Chart on South Korea - Year-over-year growth 2025-2030 (%)
Data Table on South Korea - Year-over-year growth 2025-2030 (%)

13.3.5 Thailand - Market size and forecast 2025-2030

Chart on Thailand - Market size and forecast 2025-2030 ($ million)
Data Table on Thailand - Market size and forecast 2025-2030 ($ million)
Chart on Thailand - Year-over-year growth 2025-2030 (%)
Data Table on Thailand - Year-over-year growth 2025-2030 (%)

13.3.6 Indonesia - Market size and forecast 2025-2030

Chart on Indonesia - Market size and forecast 2025-2030 ($ million)
Data Table on Indonesia - Market size and forecast 2025-2030 ($ million)
Chart on Indonesia - Year-over-year growth 2025-2030 (%)
Data Table on Indonesia - Year-over-year growth 2025-2030 (%)

13.4 North America - Market size and forecast 2025-2030

Chart on North America - Market size and forecast 2025-2030 ($ million)
Data Table on North America - Market size and forecast 2025-2030 ($ million)
Chart on North America - Year-over-year growth 2025-2030 (%)
Data Table on North America - Year-over-year growth 2025-2030 (%)
Chart on Regional Comparison - North America
Data Table on Regional Comparison - North America

13.4.1 US - Market size and forecast 2025-2030

Chart on US - Market size and forecast 2025-2030 ($ million)
Data Table on US - Market size and forecast 2025-2030 ($ million)
Chart on US - Year-over-year growth 2025-2030 (%)
Data Table on US - Year-over-year growth 2025-2030 (%)

13.4.2 Canada - Market size and forecast 2025-2030

Chart on Canada - Market size and forecast 2025-2030 ($ million)
Data Table on Canada - Market size and forecast 2025-2030 ($ million)
Chart on Canada - Year-over-year growth 2025-2030 (%)
Data Table on Canada - Year-over-year growth 2025-2030 (%)

13.4.3 Mexico - Market size and forecast 2025-2030

Chart on Mexico - Market size and forecast 2025-2030 ($ million)
Data Table on Mexico - Market size and forecast 2025-2030 ($ million)
Chart on Mexico - Year-over-year growth 2025-2030 (%)
Data Table on Mexico - Year-over-year growth 2025-2030 (%)

13.5 Europe - Market size and forecast 2025-2030

Chart on Europe - Market size and forecast 2025-2030 ($ million)
Data Table on Europe - Market size and forecast 2025-2030 ($ million)
Chart on Europe - Year-over-year growth 2025-2030 (%)
Data Table on Europe - Year-over-year growth 2025-2030 (%)
Chart on Regional Comparison - Europe
Data Table on Regional Comparison - Europe

13.5.1 Germany - Market size and forecast 2025-2030

Chart on Germany - Market size and forecast 2025-2030 ($ million)
Data Table on Germany - Market size and forecast 2025-2030 ($ million)
Chart on Germany - Year-over-year growth 2025-2030 (%)
Data Table on Germany - Year-over-year growth 2025-2030 (%)

13.5.2 France - Market size and forecast 2025-2030

Chart on France - Market size and forecast 2025-2030 ($ million)
Data Table on France - Market size and forecast 2025-2030 ($ million)
Chart on France - Year-over-year growth 2025-2030 (%)
Data Table on France - Year-over-year growth 2025-2030 (%)

13.5.3 UK - Market size and forecast 2025-2030

Chart on UK - Market size and forecast 2025-2030 ($ million)
Data Table on UK - Market size and forecast 2025-2030 ($ million)
Chart on UK - Year-over-year growth 2025-2030 (%)
Data Table on UK - Year-over-year growth 2025-2030 (%)

13.5.4 Italy - Market size and forecast 2025-2030

Chart on Italy - Market size and forecast 2025-2030 ($ million)
Data Table on Italy - Market size and forecast 2025-2030 ($ million)
Chart on Italy - Year-over-year growth 2025-2030 (%)
Data Table on Italy - Year-over-year growth 2025-2030 (%)

13.5.5 Spain - Market size and forecast 2025-2030

Chart on Spain - Market size and forecast 2025-2030 ($ million)
Data Table on Spain - Market size and forecast 2025-2030 ($ million)
Chart on Spain - Year-over-year growth 2025-2030 (%)
Data Table on Spain - Year-over-year growth 2025-2030 (%)

13.5.6 Poland - Market size and forecast 2025-2030

Chart on Poland - Market size and forecast 2025-2030 ($ million)
Data Table on Poland - Market size and forecast 2025-2030 ($ million)
Chart on Poland - Year-over-year growth 2025-2030 (%)
Data Table on Poland - Year-over-year growth 2025-2030 (%)

13.6 South America - Market size and forecast 2025-2030

Chart on South America - Market size and forecast 2025-2030 ($ million)
Data Table on South America - Market size and forecast 2025-2030 ($ million)
Chart on South America - Year-over-year growth 2025-2030 (%)
Data Table on South America - Year-over-year growth 2025-2030 (%)
Chart on Regional Comparison - South America
Data Table on Regional Comparison - South America

13.6.1 Brazil - Market size and forecast 2025-2030

Chart on Brazil - Market size and forecast 2025-2030 ($ million)
Data Table on Brazil - Market size and forecast 2025-2030 ($ million)
Chart on Brazil - Year-over-year growth 2025-2030 (%)
Data Table on Brazil - Year-over-year growth 2025-2030 (%)

13.6.2 Argentina - Market size and forecast 2025-2030

Chart on Argentina - Market size and forecast 2025-2030 ($ million)
Data Table on Argentina - Market size and forecast 2025-2030 ($ million)
Chart on Argentina - Year-over-year growth 2025-2030 (%)
Data Table on Argentina - Year-over-year growth 2025-2030 (%)

13.6.3 Colombia - Market size and forecast 2025-2030

Chart on Colombia - Market size and forecast 2025-2030 ($ million)
Data Table on Colombia - Market size and forecast 2025-2030 ($ million)
Chart on Colombia - Year-over-year growth 2025-2030 (%)
Data Table on Colombia - Year-over-year growth 2025-2030 (%)

13.7 Middle East and Africa - Market size and forecast 2025-2030

Chart on Middle East and Africa - Market size and forecast 2025-2030 ($ million)
Data Table on Middle East and Africa - Market size and forecast 2025-2030 ($ million)
Chart on Middle East and Africa - Year-over-year growth 2025-2030 (%)
Data Table on Middle East and Africa - Year-over-year growth 2025-2030 (%)
Chart on Regional Comparison - Middle East and Africa
Data Table on Regional Comparison - Middle East and Africa

13.7.1 South Africa - Market size and forecast 2025-2030

Chart on South Africa - Market size and forecast 2025-2030 ($ million)
Data Table on South Africa - Market size and forecast 2025-2030 ($ million)
Chart on South Africa - Year-over-year growth 2025-2030 (%)
Data Table on South Africa - Year-over-year growth 2025-2030 (%)

13.7.2 Turkey - Market size and forecast 2025-2030

Chart on Turkey - Market size and forecast 2025-2030 ($ million)
Data Table on Turkey - Market size and forecast 2025-2030 ($ million)
Chart on Turkey - Year-over-year growth 2025-2030 (%)
Data Table on Turkey - Year-over-year growth 2025-2030 (%)

13.7.3 Saudi Arabia - Market size and forecast 2025-2030

Chart on Saudi Arabia - Market size and forecast 2025-2030 ($ million)
Data Table on Saudi Arabia - Market size and forecast 2025-2030 ($ million)
Chart on Saudi Arabia - Year-over-year growth 2025-2030 (%)
Data Table on Saudi Arabia - Year-over-year growth 2025-2030 (%)

13.7.4 UAE - Market size and forecast 2025-2030

Chart on UAE - Market size and forecast 2025-2030 ($ million)
Data Table on UAE - Market size and forecast 2025-2030 ($ million)
Chart on UAE - Year-over-year growth 2025-2030 (%)
Data Table on UAE - Year-over-year growth 2025-2030 (%)

13.7.5 Egypt - Market size and forecast 2025-2030

Chart on Egypt - Market size and forecast 2025-2030 ($ million)
Data Table on Egypt - Market size and forecast 2025-2030 ($ million)
Chart on Egypt - Year-over-year growth 2025-2030 (%)
Data Table on Egypt - Year-over-year growth 2025-2030 (%)

13.8 Market opportunity by geography

Market opportunity by geography ($ million)
Data Tables on Market opportunity by geography ($ million)

14. Drivers, Challenges, and Opportunity

14.1 Market drivers

Stringent emissions regulations and mandatory thermal efficiency standards
Widespread proliferation of downsized turbocharged powertrains and hybrid vehicles
Industrial expansion and vehicle production volume dynamics

14.2 Market challenges

Rapid electrification trajectories and regulatory adjustments reducing internal combustion volume
High-grade raw material dependencies and escalating cost volatility
Manufacturing complexity and technical defect rates in advanced geometries

14.3 Impact of drivers and challenges

Impact of drivers and challenges in 2025 and 2030

14.4 Market opportunities

Rising integration of close-coupled catalytic converter and modular manifold designs
Adoption of lightweight thin-walled stainless steel over cast iron layouts
Technological proliferation of Gen AI and advanced simulation software

15. Competitive Landscape

15.1 Overview

15.2

Overview on criticality of inputs and factors of differentiation

15.3 Landscape disruption

Overview on factors of disruption

15.4 Industry risks

Impact of key risks on business

16. Competitive Analysis

16.1 Companies profiled

Companies covered

16.2 Company ranking index

16.3 Market positioning of companies

Matrix on companies position and classification

16.4 advanced FLOW engineering Inc.

advanced FLOW engineering Inc. - Overview
advanced FLOW engineering Inc. - Product / Service
advanced FLOW engineering Inc. - Key offerings
SWOT

16.5 AP Emissions Technologies

AP Emissions Technologies - Overview
AP Emissions Technologies - Product / Service
AP Emissions Technologies - Key offerings
SWOT

16.6 Benteler International AG

Benteler International AG - Overview
Benteler International AG - Product / Service
Benteler International AG - Key offerings
SWOT

16.7 Bosal Nederland BV

Bosal Nederland BV - Overview
Bosal Nederland BV - Product / Service
Bosal Nederland BV - Key offerings
SWOT

16.8 Dorman Products Inc.

Dorman Products Inc. - Overview
Dorman Products Inc. - Product / Service
Dorman Products Inc. - Key offerings
SWOT

16.9 Eberspacher Gruppe GmbH

Eberspacher Gruppe GmbH - Overview
Eberspacher Gruppe GmbH - Product / Service
Eberspacher Gruppe GmbH - Key offerings
SWOT

16.10 Forvia SE

Forvia SE - Overview
Forvia SE - Business segments
Forvia SE - Key offerings
Forvia SE - Segment focus
SWOT

16.11 Friedrich Boysen GmbH and Co.

Friedrich Boysen GmbH and Co. - Overview
Friedrich Boysen GmbH and Co. - Product / Service
Friedrich Boysen GmbH and Co. - Key offerings
SWOT

16.12 Futaba Industrial Co. Ltd.

Futaba Industrial Co. Ltd. - Overview
Futaba Industrial Co. Ltd. - Product / Service
Futaba Industrial Co. Ltd. - Key offerings
SWOT

16.13 Ilmor Engineering Inc.

Ilmor Engineering Inc. - Overview
Ilmor Engineering Inc. - Product / Service
Ilmor Engineering Inc. - Key offerings
SWOT

16.14 Marelli Holdings Co. Ltd.

Marelli Holdings Co. Ltd. - Overview
Marelli Holdings Co. Ltd. - Product / Service
Marelli Holdings Co. Ltd. - Key offerings
SWOT

16.15 MetalTek International

MetalTek International - Overview
MetalTek International - Product / Service
MetalTek International - Key offerings
SWOT

16.16 SHARDA MOTOR INDUSTRIES LTD.

SHARDA MOTOR INDUSTRIES LTD. - Overview
SHARDA MOTOR INDUSTRIES LTD. - Product / Service
SHARDA MOTOR INDUSTRIES LTD. - Key offerings
SWOT

16.17 Tenneco Inc.

Tenneco Inc. - Overview
Tenneco Inc. - Product / Service
Tenneco Inc. - Key offerings
SWOT

16.18 Yutaka Giken Co. Ltd.

Yutaka Giken Co. Ltd. - Overview
Yutaka Giken Co. Ltd. - Product / Service
Yutaka Giken Co. Ltd. - Key offerings
SWOT

17. Appendix

17.1 Scope of the report

Market definition
Objectives
Notes and caveats

17.2 Inclusions and exclusions checklist

Inclusions checklist
Exclusions checklist

17.3 Currency conversion rates for US$

17.4 Research methodology

17.5 Data procurement

Information sources

17.6 Data validation

17.7 Validation techniques employed for market sizing

17.8 Data synthesis

17.9 360 degree market analysis

17.10 List of abbreviations

Research Methodology

Technavio presents a detailed picture of the market by way of study, synthesis, and summation of data from multiple sources. The analysts have presented the various facets of the market with a particular focus on identifying the key industry influencers. The data thus presented is comprehensive, reliable, and the result of extensive research, both primary and secondary.

INFORMATION SOURCES

Primary sources

  • Manufacturers and suppliers
  • Channel partners
  • Industry experts
  • Strategic decision makers

Secondary sources

  • Industry journals and periodicals
  • Government data
  • Financial reports of key industry players
  • Historical data
  • Press releases

DATA ANALYSIS

Data Synthesis

  • Collation of data
  • Estimation of key figures
  • Analysis of derived insights

Data Validation

  • Triangulation with data models
  • Reference against proprietary databases
  • Corroboration with industry experts

REPORT WRITING

Qualitative

  • Market drivers
  • Market challenges
  • Market trends
  • Five forces analysis

Quantitative

  • Market size and forecast
  • Market segmentation
  • Geographical insights
  • Competitive landscape

Interested in this report?

Get your sample now to see our research methodology and insights!

Download Now

Frequently Asked Questions

Automotive Exhaust Manifold market growth will increase by USD 839.5 million during 2026-2030.

The Automotive Exhaust Manifold market is expected to grow at a CAGR of 5.6% during 2026-2030.

Automotive Exhaust Manifold market is segmented by Application (Passenger car, Commercial vehicle) Fuel type (Gasoline, Diesel) Material (Cast iron, Stainless steel, Others) Distribution channel (OEM, Aftermarket)

advanced FLOW engineering Inc., AP Emissions Technologies, Bellows Systems Inc., Benteler International AG, Borla Performance Industries, Bosal Nederland BV, Dorman Products Inc., Eberspacher Gruppe GmbH, Forvia SE, Friedrich Boysen GmbH and Co., Futaba Industrial Co. Ltd., GP Headers Inc., Ilmor Engineering Inc., Marelli Holdings Co. Ltd., MetalTek International, SHARDA MOTOR INDUSTRIES LTD., Stainless Works, Tenneco Inc., Vibrant Power Inc., Yutaka Giken Co. Ltd. are a few of the key vendors in the Automotive Exhaust Manifold market.

APAC will register the highest growth rate of 41.5% among the other regions. Therefore, the Automotive Exhaust Manifold market in APAC is expected to garner significant business opportunities for the vendors during the forecast period.

China, Japan, India, South Korea, Thailand, Indonesia, US, Canada, Mexico, Germany, France, UK, Italy, Spain, Poland, Brazil, Argentina, Colombia, South Africa, Turkey, Saudi Arabia, UAE, Egypt

  • Stringent emissions regulations and mandatory thermal efficiency standards is the driving factor this market.

The Automotive Exhaust Manifold market vendors should focus on grabbing business opportunities from the Application segment as it accounted for the largest market share in the base year.
RIA - Research AI Assistant
Ask RIA