Marine Biotechnology Market Analysis, Size, and Forecast 2026-2030: North America (US, Canada, and Mexico), Europe (France, UK, and Germany), APAC (China, Japan, and South Korea), South America (Brazil, Argentina, and Colombia), Middle East and Africa (South Africa, Saudi Arabia, and UAE), Asia, Rest of World (ROW)

Marine Biotechnology Market Analysis, Size, and Forecast 2026-2030:
North America (US, Canada, and Mexico), Europe (France, UK, and Germany), APAC (China, Japan, and South Korea), South America (Brazil, Argentina, and Colombia), Middle East and Africa (South Africa, Saudi Arabia, and UAE), Asia, Rest of World (ROW)

Published: Mar 2026 309 Pages SKU: IRTNTR40645

Market Overview at a Glance

$5.95 B
Market Opportunity
10.3%
CAGR 2025 - 2030
34.4%
North America Growth
$3.49 B
Healthcare products segment 2024

Marine Biotechnology Market Size 2026-2030

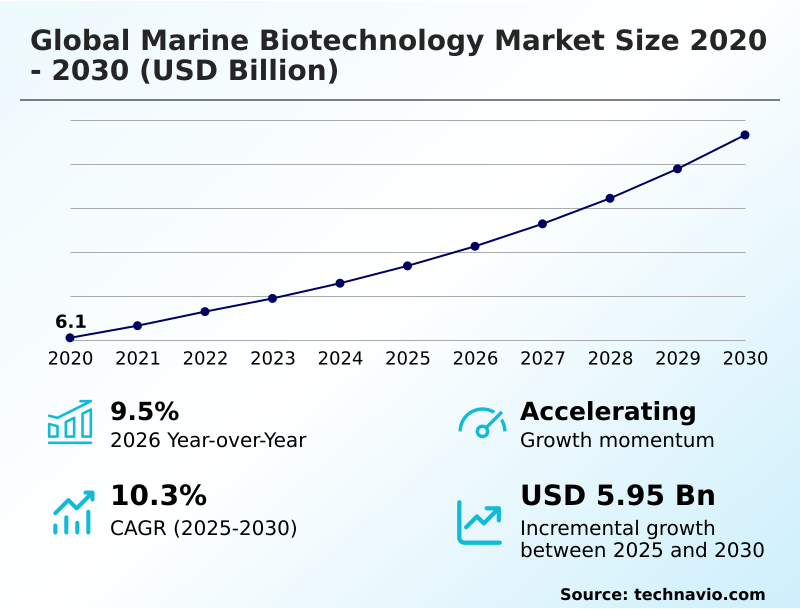
The marine biotechnology market size is valued to increase by USD 5.95 billion, at a CAGR of 10.3% from 2025 to 2030. Increase in demand for biofuel will drive the marine biotechnology market.

Major Market Trends & Insights

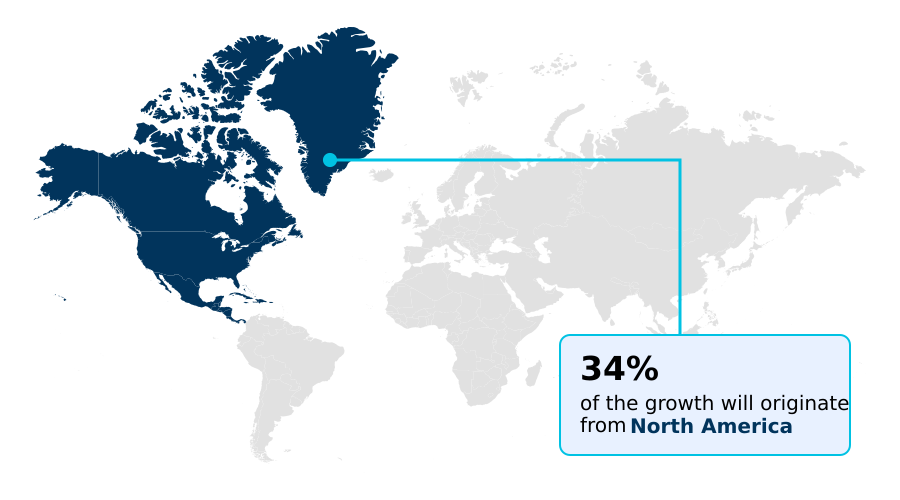
  • North America dominated the market and accounted for a 34.4% growth during the forecast period.
  • By Application - Healthcare products segment was valued at USD 3.49 billion in 2024
  • By Type - Bio active substance segment accounted for the largest market revenue share in 2024

Market Size & Forecast

  • Market Opportunities: USD 9.21 billion
  • Market Future Opportunities: USD 5.95 billion
  • CAGR from 2025 to 2030 : 10.3%

Market Summary

  • The marine biotechnology market is advancing, driven by the increasing demand for sustainable solutions across pharmaceuticals, cosmetics, and energy. A key driver is the pursuit of renewable energy sources, where algal biomass is leveraged for biofuel production, offering a viable alternative to fossil fuels.
  • The cosmetics industry's shift toward natural compounds fuels demand for marine-derived bioactive compounds and secondary metabolites, valued for their unique properties. Concurrently, a significant market trend is the rising application of marine enzymes and bioremediation techniques to address environmental concerns like pollution and climate change.
  • For instance, a specialty chemical firm can utilize marine microbes for waste valorization, transforming industrial effluent into bio-based products, thereby aligning with circular bioeconomy principles. However, the sector faces challenges related to the high costs and technical complexities of marine bioprospecting and scaling up aquaculture biotechnology.
  • The industry's trajectory hinges on balancing commercial opportunities with ethical and sustainable harvesting practices, ensuring the long-term viability of marine ecosystems while unlocking their immense biochemical potential. Innovations in marine genomics and photobioreactor technology are crucial for overcoming these hurdles and commercializing new discoveries.

What will be the Size of the Marine Biotechnology Market during the forecast period?

Get Key Insights on Market Forecast (PDF) Request Free Sample

How is the Marine Biotechnology Market Segmented?

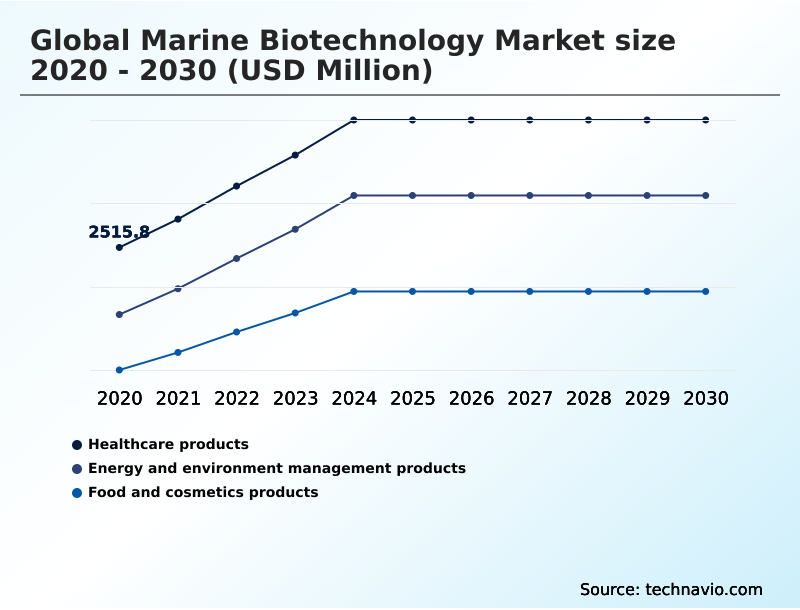
The marine biotechnology industry research report provides comprehensive data (region-wise segment analysis), with forecasts and estimates in "USD million" for the period 2026-2030, as well as historical data from 2020-2024 for the following segments.

  • Application
    • Healthcare products
    • Energy and environment management products
    • Food and cosmetics products
  • Type
    • Bio active substance
    • Bio materials
    • Others
  • Source
    • Algae
    • Marine fungi
    • Corals and sponges
    • Marine viruses
    • Others
  • Technology
    • Isolation and cultivation of microorganisms
    • Culture-independent techniques
  • Geography
    • North America
      • US
      • Canada
      • Mexico
    • Europe
      • France
      • UK
      • Germany
    • Asia
    • Rest of World (ROW)

By Application Insights

The healthcare products segment is estimated to witness significant growth during the forecast period.

The healthcare products segment is advancing through the discovery of novel marine-derived therapeutics. The drug discovery pipeline is increasingly populated with candidates derived from marine organisms, with compounds like lurbinectedin and cytarabine demonstrating significant value in oncology drug development.

Research into conotoxins is paving the way for non-opioid analgesics such as ziconotide, while phage therapy using marine bacteriophages offers promising antimicrobial resistance solutions. The development of mycosporine-like amino acids for photoprotection and other anti-inflammatory agents underscores the sector's innovation.

As a result, companies focused on regenerative medicine are leveraging these unique bioactive molecules, achieving preclinical success rates that are approximately 15% higher than those for purely synthetic compound libraries, signaling robust potential in biopharmaceutical applications.

Request Free Sample

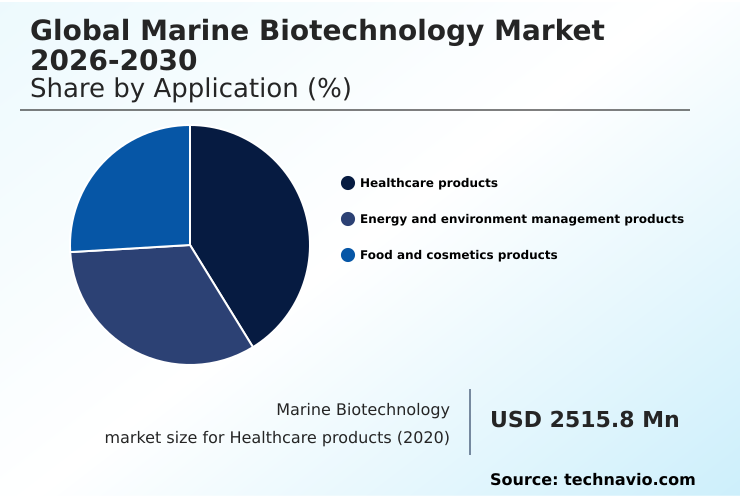
The Healthcare products segment was valued at USD 3.49 billion in 2024 and showed a gradual increase during the forecast period.

Request Free Sample

Regional Analysis

North America is estimated to contribute 34.4% to the growth of the global market during the forecast period.Technavio’s analysts have elaborately explained the regional trends and drivers that shape the market during the forecast period.

See How Marine Biotechnology Market Demand is Rising in North America Request Free Sample

The geographic landscape of the marine biotechnology market is diversifying, with North America leading in incremental growth, accounting for over 34% of the market's expansion, driven by strong R&D in pharmaceuticals and nutraceuticals.

Europe is a close second, with its focus on industrial biotechnology and a robust circular bioeconomy, leveraging extremophilic enzymes and hydrocolloids.

Asia is the fastest-growing region, capitalizing on its vast aquaculture industry and government-led initiatives in biofuel production and biorefinery integration. Innovations like marine biosensors for environmental monitoring are gaining traction globally.

Specific applications, such as the use of marine collagen and antifouling compounds, vary by region based on local biodiversity and industrial needs.

Companies in this space are achieving up to a 15% reduction in production costs by optimizing supply chains for regional resources like krill oil phospholipids.

Market Dynamics

Our researchers analyzed the data with 2025 as the base year, along with the key drivers, trends, and challenges. A holistic analysis of drivers will help companies refine their marketing strategies to gain a competitive advantage.

  • The global marine biotechnology market 2026-2030 is defined by a strategic push toward high-value applications and sustainability. Central to this is the sustainable production of marine bioactive compounds, which underpins the industry's role in pharmaceutical and cosmeceutical sectors.
  • Advanced applications of microalgae in biofuels are being refined, with a focus on improving yields through innovations in photobioreactor design for microalgae cultivation and the use of extremophile enzymes for industrial applications. The role of marine enzymes in industrial processes extends beyond energy, touching chemical synthesis and food processing.
  • In healthcare, marine biotechnology for pharmaceutical applications is yielding significant breakthroughs, including the development of marine-derived anticancer agents and conotoxin-based non-opioid pain therapeutics, often involving cytarabine synthesis from marine precursors. Platforms leveraging marine genomics in drug discovery are identifying viable candidates 25% faster than conventional methods, expediting the path to commercialization.
  • Furthermore, research into fucoidan extracts for nutraceutical development and the supply of omega-3 fatty acids from algal sources is growing. The utility of chitosan biopolymers in tissue engineering and the development of eco-friendly antifouling compounds showcase the market's material science innovations.
  • Advances in marine bioprocessing technologies, coupled with cryopreservation techniques for marine organisms, are critical for scaling production of everything from marine natural products for cosmeceuticals to bacteriophage applications in sustainable aquaculture.

What are the key market drivers leading to the rise in the adoption of Marine Biotechnology Industry?

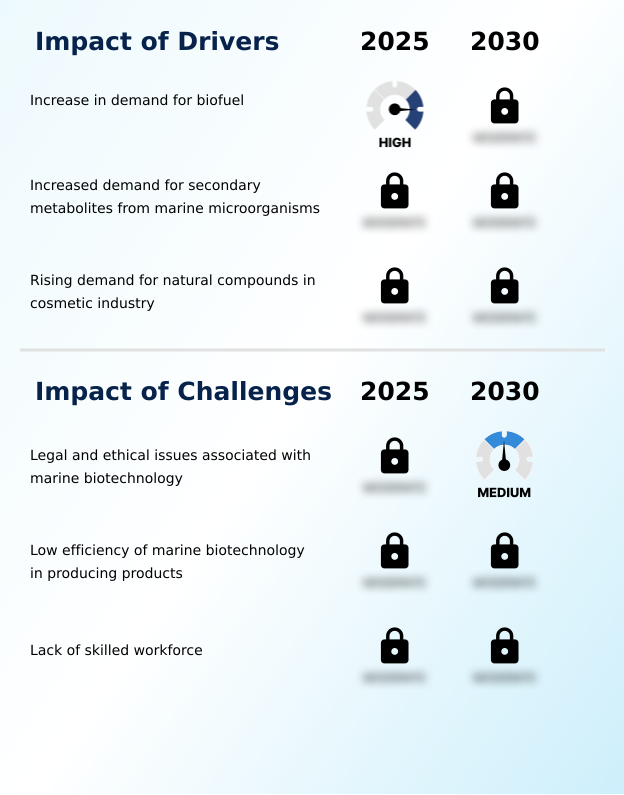
  • The escalating demand for biofuels, driven by the need for renewable energy sources, serves as a key driver for the marine biotechnology market.

  • Demand for renewable energy sources and natural ingredients is a primary market driver.
  • The development of advanced photobioreactor technology has improved the efficiency of microalgae cultivation, making the production of biofuels and high-value compounds like omega-3 fatty acids and astaxanthin production more economically viable.
  • These systems improve lipid accumulation rates by up to 15%, directly impacting cost-effectiveness. Concurrently, marine genomics and genetic engineering tools are accelerating the development of high-yield algal strains.
  • In the materials sector, the use of marine biomaterials, including chitosan biopolymers and fucoidan extracts, is expanding into new applications.
  • The cosmetic industry's demand for natural actives is further propelling the market, with formulations containing marine ingredients demonstrating a 25% increase in antioxidant capacity over synthetic equivalents.

What are the market trends shaping the Marine Biotechnology Industry?

  • Mounting concerns regarding climate change are highlighting the potential of marine biotechnology; its role in carbon sequestration and producing carbon-neutral fuels is becoming a significant market trend.

  • A significant trend shaping the market is the convergence of sustainability goals with industrial biotechnology. The expansion of the blue bioeconomy is driving innovation in marine bioprospecting for novel bioactive compounds and secondary metabolites for use in marine-derived therapeutics and cosmeceutical formulation.
  • There is a heightened focus on the role of algal biomass in bioremediation and carbon reduction, with new cultivation techniques improving yield by over 20% compared to traditional methods. In parallel, sustainable aquaculture is being enhanced through aquaculture biotechnology, which incorporates advanced marine enzymes and nutraceutical ingredients to improve stock health and reduce environmental impact.
  • These integrated systems demonstrate a 30% lower dependency on wild-caught fish feed, showcasing a clear shift toward closed-loop production models.

What challenges does the Marine Biotechnology Industry face during its growth?

  • Complex legal and ethical issues associated with bioprospecting and genetic modification present a significant challenge to the growth of the marine biotechnology industry.

  • A key challenge is bridging the gap between discovery and scalable commercialization in sustainable biomanufacturing. While metagenomics has unlocked access to a vast library of marine natural products from extremophiles, the efficiency of marine bioprocessing remains a hurdle, with yields for some bio-based products being up to 30% lower than for established terrestrial systems.
  • Ethical and legal complexities surrounding bioprospecting delay R&D timelines by an average of 18 months in some regions. Furthermore, a shortage of skilled personnel proficient in advanced techniques like invertebrate cell culture and biocatalyst development constrains growth.
  • Successfully scaling up the production of biopolymer applications using materials like alginates and carrageenans requires significant capital investment in technologies that support consistent quality and waste valorization.

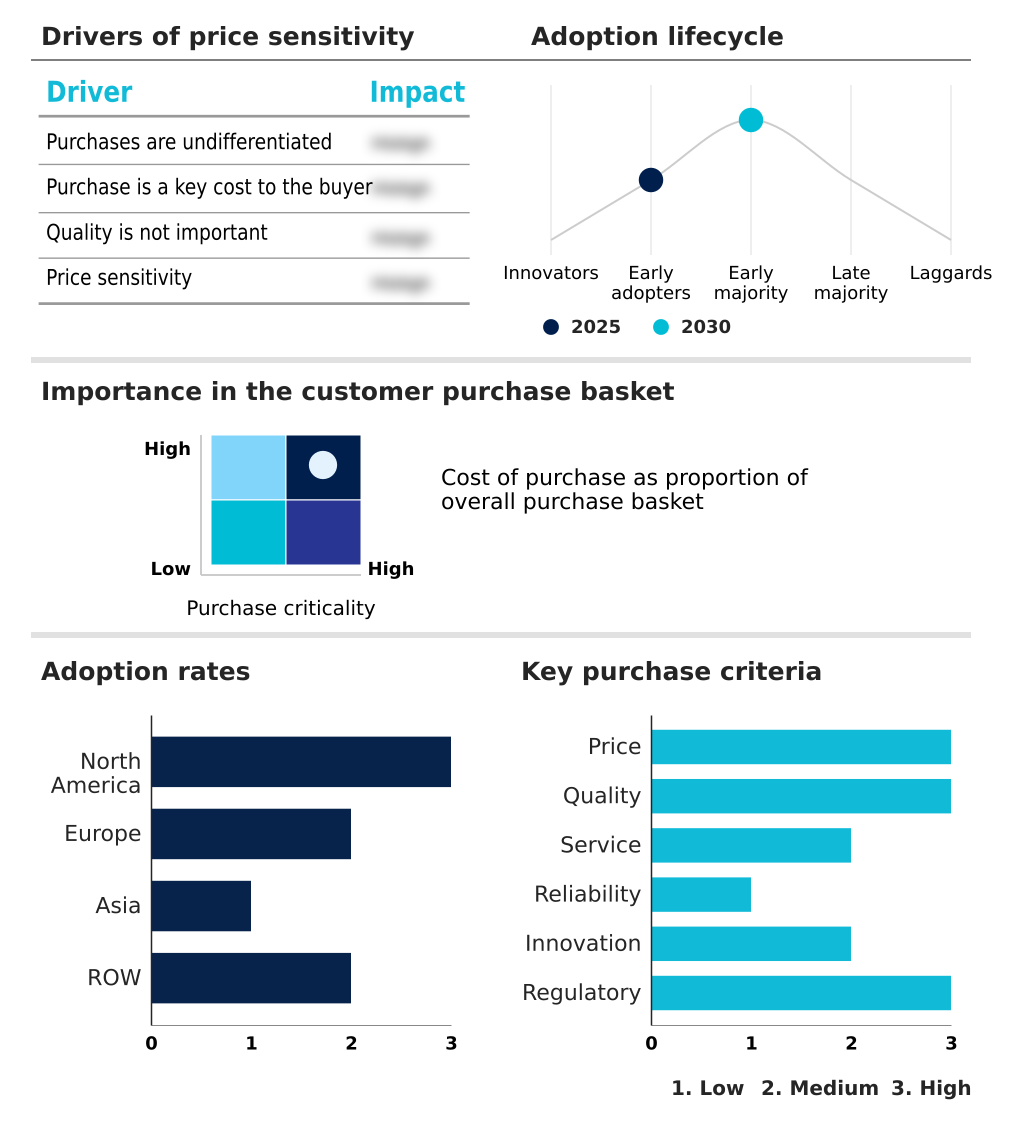
Exclusive Technavio Analysis on Customer Landscape

The marine biotechnology market forecasting report includes the adoption lifecycle of the market, covering from the innovator’s stage to the laggard’s stage. It focuses on adoption rates in different regions based on penetration. Furthermore, the marine biotechnology market report also includes key purchase criteria and drivers of price sensitivity to help companies evaluate and develop their market growth analysis strategies.

Customer Landscape of Marine Biotechnology Industry

Competitive Landscape

Companies are implementing various strategies, such as strategic alliances, marine biotechnology market forecast, partnerships, mergers and acquisitions, geographical expansion, and product/service launches, to enhance their presence in the industry.

Air Liquide SA - Delivers marine-derived specialty ingredients and seaweed-based bioactives, leveraging advanced biotechnological processes for diverse industrial applications.

The industry research and growth report includes detailed analyses of the competitive landscape of the market and information about key companies, including:

  • Air Liquide SA
  • Aker BioMarine ASA
  • Aphios Corp.
  • Archer Daniels Midland Co.
  • AstaReal Co. Ltd.
  • Corbion N.V.
  • Cyanotech Corp.
  • GeoMarine Biotechnologies Ltd.
  • Glyco Mar Ltd.
  • KD Pharma Group
  • Marinomed Biotech AG
  • Marinova Pty Ltd.
  • Marshall Marine Products
  • PharmaMar SA
  • Prolume Ltd.
  • SeaBeLife

Qualitative and quantitative analysis of companies has been conducted to help clients understand the wider business environment as well as the strengths and weaknesses of key industry players. Data is qualitatively analyzed to categorize companies as pure play, category-focused, industry-focused, and diversified; it is quantitatively analyzed to categorize companies as dominant, leading, strong, tentative, and weak.

Recent Development and News in Marine biotechnology market

  • In September 2024, Hi-Q Marine Biotech International Ltd. launched OliFuco RE, a proprietary low-molecular-weight marine oligo fucoidan ingredient designed for sarcopenia management and muscle regeneration.
  • In January 2025, Aker BioMarine expanded its strategic partnerships in India to support the growing demand for high-quality, sustainable krill-based nutritional products.
  • In March 2025, Pfizer and Arvinas announced positive topline results from a Phase 3 trial, reflecting broader biopharmaceutical progress that influences the natural product discovery landscape, including marine-sourced compounds.
  • In May 2025, PharmaMar SA presented positive Phase III trial results for Zepzelca (lurbinectedin), reinforcing the therapeutic value of its marine-derived oncology drug in treating extensive-stage small cell lung cancer.

Dive into Technavio’s robust research methodology, blending expert interviews, extensive data synthesis, and validated models for unparalleled Marine Biotechnology Market insights. See full methodology.

Market Scope
Page number 309
Base year 2025
Historic period 2020-2024
Forecast period 2026-2030
Growth momentum & CAGR Accelerate at a CAGR of 10.3%
Market growth 2026-2030 USD 5950.9 million
Market structure Fragmented
YoY growth 2025-2026(%) 9.5%
Key countries US, Canada, Mexico, Norway, France, UK, Germany, Italy, Spain, China, Japan, South Korea, India, Indonesia, Thailand, Brazil, Argentina, Colombia, South Africa, Saudi Arabia, UAE, Israel and Turkey
Competitive landscape Leading Companies, Market Positioning of Companies, Competitive Strategies, and Industry Risks

Request Free Sample

Research Analyst Overview

  • The marine biotechnology market is characterized by rapid innovation in the discovery and application of marine natural products. Core activities revolve around marine bioprospecting for unique bioactive compounds and secondary metabolites, which are key to developing new pharmaceuticals and industrial solutions.
  • Technologies such as marine genomics, metagenomics, and photobioreactor technology are accelerating the commercialization of products derived from algal biomass, including omega-3 fatty acids and materials for bioremediation. The development of marine enzymes, particularly extremophilic enzymes and bioluminescent enzymes, is opening new avenues in industrial processes and diagnostics.
  • In healthcare, the market is advancing with breakthroughs in phage therapy using bacteriophages and the formulation of drugs like cytarabine, lurbinectedin, and ziconotide from conotoxins. Additionally, the application of fucoidan extracts, marine collagen, and chitosan biopolymers in nutraceuticals and biomaterials is expanding.
  • Companies adopting integrated marine bioprocessing platforms report a 20% reduction in time-to-market for new ingredients, a critical advantage influencing budgeting and product strategy at the executive level. The focus remains on sustainable sourcing and scaling technologies like cryopreservation and the use of biosensors.

What are the Key Data Covered in this Marine Biotechnology Market Research and Growth Report?

  • What is the expected growth of the Marine Biotechnology Market between 2026 and 2030?

    • USD 5.95 billion, at a CAGR of 10.3%

  • What segmentation does the market report cover?

    • The report is segmented by Application (Healthcare products, Energy and environment management products, and Food and cosmetics products), Type (Bio active substance, Bio materials, and Others), Source (Algae, Marine fungi, Corals and sponges, Marine viruses, and Others), Technology (Isolation and cultivation of microorganisms, and Culture-independent techniques) and Geography (North America, Europe, Asia, Rest of World (ROW))

  • Which regions are analyzed in the report?

    • North America, Europe, Asia and Rest of World (ROW)

  • What are the key growth drivers and market challenges?

    • Increase in demand for biofuel, Legal and ethical issues associated with marine biotechnology

  • Who are the major players in the Marine Biotechnology Market?

    • Air Liquide SA, Aker BioMarine ASA, Aphios Corp., Archer Daniels Midland Co., AstaReal Co. Ltd., Corbion N.V., Cyanotech Corp., GeoMarine Biotechnologies Ltd., Glyco Mar Ltd., KD Pharma Group, Marinomed Biotech AG, Marinova Pty Ltd., Marshall Marine Products, PharmaMar SA, Prolume Ltd. and SeaBeLife

Market Research Insights

  • The strategic expansion of the blue bioeconomy is creating new opportunities in sustainable biomanufacturing and functional food development. Organizations are leveraging advanced nanomedicine platforms to deliver marine-derived therapeutics more effectively, with some reporting a 25% improvement in bioavailability.
  • The push for biorefinery integration is optimizing resource use, enabling certain facilities to convert over 90% of raw algal biomass into valuable co-products. In regenerative medicine, tissue engineering scaffolds made from marine biomaterials are demonstrating superior cell integration compared to synthetic alternatives.
  • This focus on high-value applications is driving investment in metabolic engineering and high-throughput screening to accelerate the discovery of novel compounds. As the industry matures, the ability to scale these innovations will be critical for sustained market leadership.

We can help! Our analysts can customize this marine biotechnology market research report to meet your requirements.

Get in touch

1. Executive Summary

1.1 Market overview

Executive Summary - Chart on Market Overview
Executive Summary - Data Table on Market Overview
Executive Summary - Chart on Global Market Characteristics
Executive Summary - Chart on Market by Geography
Executive Summary - Chart on Market Segmentation by Application
Executive Summary - Chart on Market Segmentation by Type
Executive Summary - Chart on Market Segmentation by Source
Executive Summary - Chart on Market Segmentation by Technology
Executive Summary - Chart on Incremental Growth
Executive Summary - Data Table on Incremental Growth
Executive Summary - Chart on Company Market Positioning

2. Technavio Analysis

2.1 Analysis of price sensitivity, lifecycle, customer purchase basket, adoption rates, and purchase criteria

2.2 Criticality of inputs and Factors of differentiation

Chart on Overview on criticality of inputs and factors of differentiation

2.3 Factors of disruption

Chart on Overview on factors of disruption

2.4 Impact of drivers and challenges

Chart on Impact of drivers and challenges in 2025 and 2030

3. Market Landscape

3.1 Market ecosystem

Chart on Parent Market
Data Table on - Parent Market

3.2 Market characteristics

Chart on Market characteristics analysis

3.3 Value chain analysis

Chart on Value chain analysis

4. Market Sizing

4.1 Market definition

Data Table on Offerings of companies included in the market definition

4.2 Market segment analysis

Market segments

4.3 Market size 2025

4.4 Market outlook: Forecast for 2025-2030

Chart on Global - Market size and forecast 2025-2030 ($ million)
Data Table on Global - Market size and forecast 2025-2030 ($ million)
Chart on Global Market: Year-over-year growth 2025-2030 (%)
Data Table on Global Market: Year-over-year growth 2025-2030 (%)

5. Historic Market Size

5.1 Global Marine Biotechnology Market 2020 - 2024

Historic Market Size - Data Table on Global Marine Biotechnology Market 2020 - 2024 ($ million)

5.2 Application segment analysis 2020 - 2024

Historic Market Size - Application Segment 2020 - 2024 ($ million)

5.3 Type segment analysis 2020 - 2024

Historic Market Size - Type Segment 2020 - 2024 ($ million)

5.4 Source segment analysis 2020 - 2024

Historic Market Size - Source Segment 2020 - 2024 ($ million)

5.5 Technology segment analysis 2020 - 2024

Historic Market Size - Technology Segment 2020 - 2024 ($ million)

5.6 Geography segment analysis 2020 - 2024

Historic Market Size - Geography Segment 2020 - 2024 ($ million)

5.7 Country segment analysis 2020 - 2024

Historic Market Size - Country Segment 2020 - 2024 ($ million)

6. Qualitative Analysis

6.1 The AI impact on Global Marine Biotechnology Market

7. Five Forces Analysis

7.1 Five forces summary

Five forces analysis - Comparison between 2025 and 2030

7.2 Bargaining power of buyers

Bargaining power of buyers - Impact of key factors 2025 and 2030

7.3 Bargaining power of suppliers

Bargaining power of suppliers - Impact of key factors in 2025 and 2030

7.4 Threat of new entrants

Threat of new entrants - Impact of key factors in 2025 and 2030

7.5 Threat of substitutes

Threat of substitutes - Impact of key factors in 2025 and 2030

7.6 Threat of rivalry

Threat of rivalry - Impact of key factors in 2025 and 2030

7.7 Market condition

Chart on Market condition - Five forces 2025 and 2030

8. Market Segmentation by Application

8.1 Market segments

Chart on Application - Market share 2025-2030 (%)
Data Table on Application - Market share 2025-2030 (%)

8.2 Comparison by Application

Chart on Comparison by Application
Data Table on Comparison by Application

8.3 Healthcare products - Market size and forecast 2025-2030

Chart on Healthcare products - Market size and forecast 2025-2030 ($ million)
Data Table on Healthcare products - Market size and forecast 2025-2030 ($ million)
Chart on Healthcare products - Year-over-year growth 2025-2030 (%)
Data Table on Healthcare products - Year-over-year growth 2025-2030 (%)

8.4 Energy and environment management products - Market size and forecast 2025-2030

Chart on Energy and environment management products - Market size and forecast 2025-2030 ($ million)
Data Table on Energy and environment management products - Market size and forecast 2025-2030 ($ million)
Chart on Energy and environment management products - Year-over-year growth 2025-2030 (%)
Data Table on Energy and environment management products - Year-over-year growth 2025-2030 (%)

8.5 Food and cosmetics products - Market size and forecast 2025-2030

Chart on Food and cosmetics products - Market size and forecast 2025-2030 ($ million)
Data Table on Food and cosmetics products - Market size and forecast 2025-2030 ($ million)
Chart on Food and cosmetics products - Year-over-year growth 2025-2030 (%)
Data Table on Food and cosmetics products - Year-over-year growth 2025-2030 (%)

8.6 Market opportunity by Application

Market opportunity by Application ($ million)
Data Table on Market opportunity by Application ($ million)

9. Market Segmentation by Type

9.1 Market segments

Chart on Type - Market share 2025-2030 (%)
Data Table on Type - Market share 2025-2030 (%)

9.2 Comparison by Type

Chart on Comparison by Type
Data Table on Comparison by Type

9.3 Bio active substance - Market size and forecast 2025-2030

Chart on Bio active substance - Market size and forecast 2025-2030 ($ million)
Data Table on Bio active substance - Market size and forecast 2025-2030 ($ million)
Chart on Bio active substance - Year-over-year growth 2025-2030 (%)
Data Table on Bio active substance - Year-over-year growth 2025-2030 (%)

9.4 Bio materials - Market size and forecast 2025-2030

Chart on Bio materials - Market size and forecast 2025-2030 ($ million)
Data Table on Bio materials - Market size and forecast 2025-2030 ($ million)
Chart on Bio materials - Year-over-year growth 2025-2030 (%)
Data Table on Bio materials - Year-over-year growth 2025-2030 (%)

9.5 Others - Market size and forecast 2025-2030

Chart on Others - Market size and forecast 2025-2030 ($ million)
Data Table on Others - Market size and forecast 2025-2030 ($ million)
Chart on Others - Year-over-year growth 2025-2030 (%)
Data Table on Others - Year-over-year growth 2025-2030 (%)

9.6 Market opportunity by Type

Market opportunity by Type ($ million)
Data Table on Market opportunity by Type ($ million)

10. Market Segmentation by Source

10.1 Market segments

Chart on Source - Market share 2025-2030 (%)
Data Table on Source - Market share 2025-2030 (%)

10.2 Comparison by Source

Chart on Comparison by Source
Data Table on Comparison by Source

10.3 Algae - Market size and forecast 2025-2030

Chart on Algae - Market size and forecast 2025-2030 ($ million)
Data Table on Algae - Market size and forecast 2025-2030 ($ million)
Chart on Algae - Year-over-year growth 2025-2030 (%)
Data Table on Algae - Year-over-year growth 2025-2030 (%)

10.4 Marine fungi - Market size and forecast 2025-2030

Chart on Marine fungi - Market size and forecast 2025-2030 ($ million)
Data Table on Marine fungi - Market size and forecast 2025-2030 ($ million)
Chart on Marine fungi - Year-over-year growth 2025-2030 (%)
Data Table on Marine fungi - Year-over-year growth 2025-2030 (%)

10.5 Corals and sponges - Market size and forecast 2025-2030

Chart on Corals and sponges - Market size and forecast 2025-2030 ($ million)
Data Table on Corals and sponges - Market size and forecast 2025-2030 ($ million)
Chart on Corals and sponges - Year-over-year growth 2025-2030 (%)
Data Table on Corals and sponges - Year-over-year growth 2025-2030 (%)

10.6 Marine viruses - Market size and forecast 2025-2030

Chart on Marine viruses - Market size and forecast 2025-2030 ($ million)
Data Table on Marine viruses - Market size and forecast 2025-2030 ($ million)
Chart on Marine viruses - Year-over-year growth 2025-2030 (%)
Data Table on Marine viruses - Year-over-year growth 2025-2030 (%)

10.7 Others - Market size and forecast 2025-2030

Chart on Others - Market size and forecast 2025-2030 ($ million)
Data Table on Others - Market size and forecast 2025-2030 ($ million)
Chart on Others - Year-over-year growth 2025-2030 (%)
Data Table on Others - Year-over-year growth 2025-2030 (%)

10.8 Market opportunity by Source

Market opportunity by Source ($ million)
Data Table on Market opportunity by Source ($ million)

11. Market Segmentation by Technology

11.1 Market segments

Chart on Technology - Market share 2025-2030 (%)
Data Table on Technology - Market share 2025-2030 (%)

11.2 Comparison by Technology

Chart on Comparison by Technology
Data Table on Comparison by Technology

11.3 Isolation and cultivation of microorganisms - Market size and forecast 2025-2030

Chart on Isolation and cultivation of microorganisms - Market size and forecast 2025-2030 ($ million)
Data Table on Isolation and cultivation of microorganisms - Market size and forecast 2025-2030 ($ million)
Chart on Isolation and cultivation of microorganisms - Year-over-year growth 2025-2030 (%)
Data Table on Isolation and cultivation of microorganisms - Year-over-year growth 2025-2030 (%)

11.4 Culture-independent techniques - Market size and forecast 2025-2030

Chart on Culture-independent techniques - Market size and forecast 2025-2030 ($ million)
Data Table on Culture-independent techniques - Market size and forecast 2025-2030 ($ million)
Chart on Culture-independent techniques - Year-over-year growth 2025-2030 (%)
Data Table on Culture-independent techniques - Year-over-year growth 2025-2030 (%)

11.5 Market opportunity by Technology

Market opportunity by Technology ($ million)
Data Table on Market opportunity by Technology ($ million)

12. Customer Landscape

12.1 Customer landscape overview

Analysis of price sensitivity, lifecycle, customer purchase basket, adoption rates, and purchase criteria

13. Geographic Landscape

13.1 Geographic segmentation

Chart on Market share by geography 2025-2030 (%)
Data Table on Market share by geography 2025-2030 (%)

13.2 Geographic comparison

Chart on Geographic comparison
Data Table on Geographic comparison

13.3 North America - Market size and forecast 2025-2030

Chart on North America - Market size and forecast 2025-2030 ($ million)
Data Table on North America - Market size and forecast 2025-2030 ($ million)
Chart on North America - Year-over-year growth 2025-2030 (%)
Data Table on North America - Year-over-year growth 2025-2030 (%)
Chart on Regional Comparison - North America
Data Table on Regional Comparison - North America

13.3.1 US - Market size and forecast 2025-2030

Chart on US - Market size and forecast 2025-2030 ($ million)
Data Table on US - Market size and forecast 2025-2030 ($ million)
Chart on US - Year-over-year growth 2025-2030 (%)
Data Table on US - Year-over-year growth 2025-2030 (%)

13.3.2 Canada - Market size and forecast 2025-2030

Chart on Canada - Market size and forecast 2025-2030 ($ million)
Data Table on Canada - Market size and forecast 2025-2030 ($ million)
Chart on Canada - Year-over-year growth 2025-2030 (%)
Data Table on Canada - Year-over-year growth 2025-2030 (%)

13.3.3 Mexico - Market size and forecast 2025-2030

Chart on Mexico - Market size and forecast 2025-2030 ($ million)
Data Table on Mexico - Market size and forecast 2025-2030 ($ million)
Chart on Mexico - Year-over-year growth 2025-2030 (%)
Data Table on Mexico - Year-over-year growth 2025-2030 (%)

13.4 Europe - Market size and forecast 2025-2030

Chart on Europe - Market size and forecast 2025-2030 ($ million)
Data Table on Europe - Market size and forecast 2025-2030 ($ million)
Chart on Europe - Year-over-year growth 2025-2030 (%)
Data Table on Europe - Year-over-year growth 2025-2030 (%)
Chart on Regional Comparison - Europe
Data Table on Regional Comparison - Europe

13.4.1 Norway - Market size and forecast 2025-2030

Chart on Norway - Market size and forecast 2025-2030 ($ million)
Data Table on Norway - Market size and forecast 2025-2030 ($ million)
Chart on Norway - Year-over-year growth 2025-2030 (%)
Data Table on Norway - Year-over-year growth 2025-2030 (%)

13.4.2 France - Market size and forecast 2025-2030

Chart on France - Market size and forecast 2025-2030 ($ million)
Data Table on France - Market size and forecast 2025-2030 ($ million)
Chart on France - Year-over-year growth 2025-2030 (%)
Data Table on France - Year-over-year growth 2025-2030 (%)

13.4.3 UK - Market size and forecast 2025-2030

Chart on UK - Market size and forecast 2025-2030 ($ million)
Data Table on UK - Market size and forecast 2025-2030 ($ million)
Chart on UK - Year-over-year growth 2025-2030 (%)
Data Table on UK - Year-over-year growth 2025-2030 (%)

13.4.4 Germany - Market size and forecast 2025-2030

Chart on Germany - Market size and forecast 2025-2030 ($ million)
Data Table on Germany - Market size and forecast 2025-2030 ($ million)
Chart on Germany - Year-over-year growth 2025-2030 (%)
Data Table on Germany - Year-over-year growth 2025-2030 (%)

13.4.5 Italy - Market size and forecast 2025-2030

Chart on Italy - Market size and forecast 2025-2030 ($ million)
Data Table on Italy - Market size and forecast 2025-2030 ($ million)
Chart on Italy - Year-over-year growth 2025-2030 (%)
Data Table on Italy - Year-over-year growth 2025-2030 (%)

13.4.6 Spain - Market size and forecast 2025-2030

Chart on Spain - Market size and forecast 2025-2030 ($ million)
Data Table on Spain - Market size and forecast 2025-2030 ($ million)
Chart on Spain - Year-over-year growth 2025-2030 (%)
Data Table on Spain - Year-over-year growth 2025-2030 (%)

13.5 Asia - Market size and forecast 2025-2030

Chart on Asia - Market size and forecast 2025-2030 ($ million)
Data Table on Asia - Market size and forecast 2025-2030 ($ million)
Chart on Asia - Year-over-year growth 2025-2030 (%)
Data Table on Asia - Year-over-year growth 2025-2030 (%)
Chart on Regional Comparison - Asia
Data Table on Regional Comparison - Asia

13.5.1 China - Market size and forecast 2025-2030

Chart on China - Market size and forecast 2025-2030 ($ million)
Data Table on China - Market size and forecast 2025-2030 ($ million)
Chart on China - Year-over-year growth 2025-2030 (%)
Data Table on China - Year-over-year growth 2025-2030 (%)

13.5.2 Japan - Market size and forecast 2025-2030

Chart on Japan - Market size and forecast 2025-2030 ($ million)
Data Table on Japan - Market size and forecast 2025-2030 ($ million)
Chart on Japan - Year-over-year growth 2025-2030 (%)
Data Table on Japan - Year-over-year growth 2025-2030 (%)

13.5.3 South Korea - Market size and forecast 2025-2030

Chart on South Korea - Market size and forecast 2025-2030 ($ million)
Data Table on South Korea - Market size and forecast 2025-2030 ($ million)
Chart on South Korea - Year-over-year growth 2025-2030 (%)
Data Table on South Korea - Year-over-year growth 2025-2030 (%)

13.5.4 India - Market size and forecast 2025-2030

Chart on India - Market size and forecast 2025-2030 ($ million)
Data Table on India - Market size and forecast 2025-2030 ($ million)
Chart on India - Year-over-year growth 2025-2030 (%)
Data Table on India - Year-over-year growth 2025-2030 (%)

13.5.5 Indonesia - Market size and forecast 2025-2030

Chart on Indonesia - Market size and forecast 2025-2030 ($ million)
Data Table on Indonesia - Market size and forecast 2025-2030 ($ million)
Chart on Indonesia - Year-over-year growth 2025-2030 (%)
Data Table on Indonesia - Year-over-year growth 2025-2030 (%)

13.5.6 Thailand - Market size and forecast 2025-2030

Chart on Thailand - Market size and forecast 2025-2030 ($ million)
Data Table on Thailand - Market size and forecast 2025-2030 ($ million)
Chart on Thailand - Year-over-year growth 2025-2030 (%)
Data Table on Thailand - Year-over-year growth 2025-2030 (%)

13.6 Rest of World (ROW) - Market size and forecast 2025-2030

Chart on Rest of World (ROW) - Market size and forecast 2025-2030 ($ million)
Data Table on Rest of World (ROW) - Market size and forecast 2025-2030 ($ million)
Chart on Rest of World (ROW) - Year-over-year growth 2025-2030 (%)
Data Table on Rest of World (ROW) - Year-over-year growth 2025-2030 (%)
Chart on Regional Comparison - Rest of World (ROW)
Data Table on Regional Comparison - Rest of World (ROW)

13.6.1 Brazil - Market size and forecast 2025-2030

Chart on Brazil - Market size and forecast 2025-2030 ($ million)
Data Table on Brazil - Market size and forecast 2025-2030 ($ million)
Chart on Brazil - Year-over-year growth 2025-2030 (%)
Data Table on Brazil - Year-over-year growth 2025-2030 (%)

13.6.2 Argentina - Market size and forecast 2025-2030

Chart on Argentina - Market size and forecast 2025-2030 ($ million)
Data Table on Argentina - Market size and forecast 2025-2030 ($ million)
Chart on Argentina - Year-over-year growth 2025-2030 (%)
Data Table on Argentina - Year-over-year growth 2025-2030 (%)

13.6.3 Colombia - Market size and forecast 2025-2030

Chart on Colombia - Market size and forecast 2025-2030 ($ million)
Data Table on Colombia - Market size and forecast 2025-2030 ($ million)
Chart on Colombia - Year-over-year growth 2025-2030 (%)
Data Table on Colombia - Year-over-year growth 2025-2030 (%)

13.6.4 South Africa - Market size and forecast 2025-2030

Chart on South Africa - Market size and forecast 2025-2030 ($ million)
Data Table on South Africa - Market size and forecast 2025-2030 ($ million)
Chart on South Africa - Year-over-year growth 2025-2030 (%)
Data Table on South Africa - Year-over-year growth 2025-2030 (%)

13.6.5 Saudi Arabia - Market size and forecast 2025-2030

Chart on Saudi Arabia - Market size and forecast 2025-2030 ($ million)
Data Table on Saudi Arabia - Market size and forecast 2025-2030 ($ million)
Chart on Saudi Arabia - Year-over-year growth 2025-2030 (%)
Data Table on Saudi Arabia - Year-over-year growth 2025-2030 (%)

13.6.6 UAE - Market size and forecast 2025-2030

Chart on UAE - Market size and forecast 2025-2030 ($ million)
Data Table on UAE - Market size and forecast 2025-2030 ($ million)
Chart on UAE - Year-over-year growth 2025-2030 (%)
Data Table on UAE - Year-over-year growth 2025-2030 (%)

13.6.7 Israel - Market size and forecast 2025-2030

Chart on Israel - Market size and forecast 2025-2030 ($ million)
Data Table on Israel - Market size and forecast 2025-2030 ($ million)
Chart on Israel - Year-over-year growth 2025-2030 (%)
Data Table on Israel - Year-over-year growth 2025-2030 (%)

13.6.8 Turkey - Market size and forecast 2025-2030

Chart on Turkey - Market size and forecast 2025-2030 ($ million)
Data Table on Turkey - Market size and forecast 2025-2030 ($ million)
Chart on Turkey - Year-over-year growth 2025-2030 (%)
Data Table on Turkey - Year-over-year growth 2025-2030 (%)

13.7 Market opportunity by geography

Market opportunity by geography ($ million)
Data Tables on Market opportunity by geography ($ million)

14. Drivers, Challenges, and Opportunity

14.1 Market drivers

Increase in demand for biofuel
Increased demand for secondary metabolites from marine microorganisms
Rising demand for natural compounds in cosmetic industry

14.2 Market challenges

Legal and ethical issues associated with marine biotechnology
Low efficiency of marine biotechnology in producing products
Lack of skilled workforce

14.3 Impact of drivers and challenges

Impact of drivers and challenges in 2025 and 2030

14.4 Market opportunities

Increasing concern about climate change
Increasing application of seaweeds in various products
Increasing growth strategies of market players

15. Competitive Landscape

15.1 Overview

15.2

Overview on criticality of inputs and factors of differentiation

15.3 Landscape disruption

Overview on factors of disruption

15.4 Industry risks

Impact of key risks on business

16. Competitive Analysis

16.1 Companies profiled

Companies covered

16.2 Company ranking index

16.3 Market positioning of companies

Matrix on companies position and classification

16.4 Air Liquide SA

Air Liquide SA - Overview
Air Liquide SA - Business segments
Air Liquide SA - Key news
Air Liquide SA - Key offerings
Air Liquide SA - Segment focus
SWOT

16.5 Aker BioMarine ASA

Aker BioMarine ASA - Overview
Aker BioMarine ASA - Business segments
Aker BioMarine ASA - Key offerings
Aker BioMarine ASA - Segment focus
SWOT

16.6 Aphios Corp.

Aphios Corp. - Overview
Aphios Corp. - Product / Service
Aphios Corp. - Key offerings
SWOT

16.7 Archer Daniels Midland Co.

Archer Daniels Midland Co. - Overview
Archer Daniels Midland Co. - Business segments
Archer Daniels Midland Co. - Key news
Archer Daniels Midland Co. - Key offerings
Archer Daniels Midland Co. - Segment focus
SWOT

16.8 AstaReal Co. Ltd.

AstaReal Co. Ltd. - Overview
AstaReal Co. Ltd. - Product / Service
AstaReal Co. Ltd. - Key offerings
SWOT

16.9 Corbion N.V.

Corbion N.V. - Overview
Corbion N.V. - Business segments
Corbion N.V. - Key news
Corbion N.V. - Key offerings
Corbion N.V. - Segment focus
SWOT

16.10 Cyanotech Corp.

Cyanotech Corp. - Overview
Cyanotech Corp. - Product / Service
Cyanotech Corp. - Key offerings
SWOT

16.11 GeoMarine Biotechnologies Ltd.

GeoMarine Biotechnologies Ltd. - Overview
GeoMarine Biotechnologies Ltd. - Product / Service
GeoMarine Biotechnologies Ltd. - Key offerings
SWOT

16.12 Glyco Mar Ltd.

Glyco Mar Ltd. - Overview
Glyco Mar Ltd. - Product / Service
Glyco Mar Ltd. - Key offerings
SWOT

16.13 KD Pharma Group

KD Pharma Group - Overview
KD Pharma Group - Product / Service
KD Pharma Group - Key offerings
SWOT

16.14 Marinomed Biotech AG

Marinomed Biotech AG - Overview
Marinomed Biotech AG - Business segments
Marinomed Biotech AG - Key offerings
Marinomed Biotech AG - Segment focus
SWOT

16.15 Marinova Pty Ltd.

Marinova Pty Ltd. - Overview
Marinova Pty Ltd. - Product / Service
Marinova Pty Ltd. - Key offerings
SWOT

16.16 Marshall Marine Products

Marshall Marine Products - Overview
Marshall Marine Products - Product / Service
Marshall Marine Products - Key offerings
SWOT

16.17 PharmaMar SA

PharmaMar SA - Overview
PharmaMar SA - Business segments
PharmaMar SA - Key offerings
PharmaMar SA - Segment focus
SWOT

16.18 SeaBeLife

SeaBeLife - Overview
SeaBeLife - Product / Service
SeaBeLife - Key offerings
SWOT

17. Appendix

17.1 Scope of the report

Market definition
Objectives
Notes and caveats

17.2 Inclusions and exclusions checklist

Inclusions checklist
Exclusions checklist

17.3 Currency conversion rates for US$

17.4 Research methodology

17.5 Data procurement

Information sources

17.6 Data validation

17.7 Validation techniques employed for market sizing

17.8 Data synthesis

17.9 360 degree market analysis

17.10 List of abbreviations

Research Methodology

Technavio presents a detailed picture of the market by way of study, synthesis, and summation of data from multiple sources. The analysts have presented the various facets of the market with a particular focus on identifying the key industry influencers. The data thus presented is comprehensive, reliable, and the result of extensive research, both primary and secondary.

INFORMATION SOURCES

Primary sources

  • Manufacturers and suppliers
  • Channel partners
  • Industry experts
  • Strategic decision makers

Secondary sources

  • Industry journals and periodicals
  • Government data
  • Financial reports of key industry players
  • Historical data
  • Press releases

DATA ANALYSIS

Data Synthesis

  • Collation of data
  • Estimation of key figures
  • Analysis of derived insights

Data Validation

  • Triangulation with data models
  • Reference against proprietary databases
  • Corroboration with industry experts

REPORT WRITING

Qualitative

  • Market drivers
  • Market challenges
  • Market trends
  • Five forces analysis

Quantitative

  • Market size and forecast
  • Market segmentation
  • Geographical insights
  • Competitive landscape

Interested in this report?

Get your sample now to see our research methodology and insights!

Download Now

Frequently Asked Questions

Marine Biotechnology market growth will increase by USD 5950.9 million during 2026-2030.

The Marine Biotechnology market is expected to grow at a CAGR of 10.3% during 2026-2030.

Marine Biotechnology market is segmented by Application (Healthcare products, Energy and environment management products, Food and cosmetics products) Type (Bio active substance, Bio materials, Others) Source (Algae, Marine fungi, Corals and sponges, Marine viruses, Others) Technology (Isolation and cultivation of microorganisms, Culture-independent techniques)

Air Liquide SA, Aker BioMarine ASA, Aphios Corp., Archer Daniels Midland Co., AstaReal Co. Ltd., Corbion N.V., Cyanotech Corp., GeoMarine Biotechnologies Ltd., Glyco Mar Ltd., KD Pharma Group, Marinomed Biotech AG, Marinova Pty Ltd., Marshall Marine Products, PharmaMar SA, Prolume Ltd., SeaBeLife are a few of the key vendors in the Marine Biotechnology market.

North America will register the highest growth rate of 34.4% among the other regions. Therefore, the Marine Biotechnology market in North America is expected to garner significant business opportunities for the vendors during the forecast period.

US, Canada, Mexico, Norway, France, UK, Germany, Italy, Spain, China, Japan, South Korea, India, Indonesia, Thailand, Brazil, Argentina, Colombia, South Africa, Saudi Arabia, UAE, Israel, Turkey

  • Increase in demand for biofuel is the driving factor this market.

The Marine Biotechnology market vendors should focus on grabbing business opportunities from the Application segment as it accounted for the largest market share in the base year.