
Marine Engine Monitoring System Market Size 2025-2029
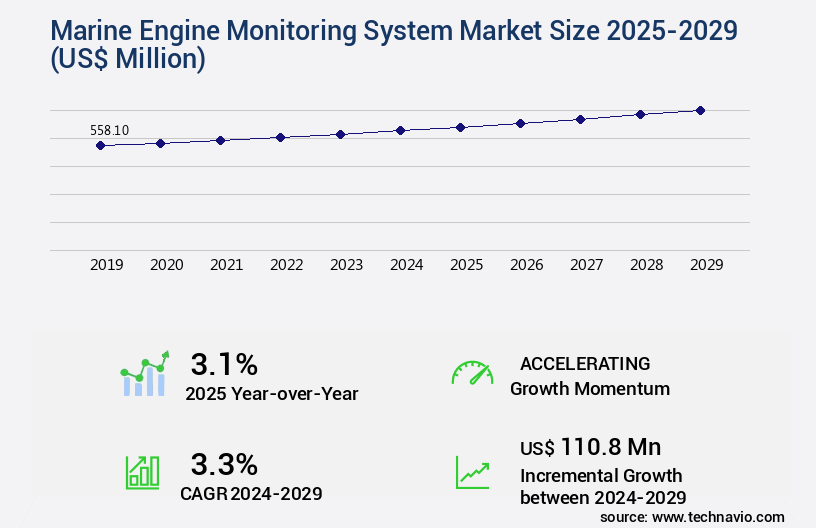
The marine engine monitoring system market size is valued to increase USD 110.8 million, at a CAGR of 3.3% from 2024 to 2029. Growing number of naval vessels will drive the marine engine monitoring system market.
Major Market Trends & Insights
- APAC dominated the market and accounted for a 57% growth during the forecast period.
- By Application - Commercial segment was valued at USD 369.60 million in 2023
- By Product - Propulsion segment accounted for the largest market revenue share in 2023
Market Size & Forecast
- Market Opportunities: USD 33.45 million
- Market Future Opportunities: USD 110.80 million
- CAGR from 2024 to 2029 : 3.3%
Market Summary
- The Marine Engine Monitoring System (MEMS) market experiences continuous expansion, driven by the increasing number of naval vessels and the advent of maritime autonomous surface ships (MASS). These advanced systems enable real-time monitoring and analysis of marine engine performance, optimizing fuel consumption and reducing maintenance costs. The market's growth is further fueled by stringent regulations mandating regular engine inspections and maintenance. MEMS technology integrates sensors, data analytics, and communication systems to provide actionable insights into engine health and performance. This data-driven approach allows for predictive maintenance, reducing downtime and increasing operational efficiency. Moreover, MEMS can detect anomalies and potential issues before they escalate into major problems, ensuring safety and reliability.
- According to recent market reports, the global MEMS market is projected to reach a value of over USD3 billion by 2026, growing at a steady pace. This growth is attributed to the increasing adoption of advanced technologies, such as IoT and AI, in marine applications. Additionally, the rising demand for fuel efficiency and environmental sustainability further boosts the market's expansion. In conclusion, the market plays a pivotal role in enhancing the performance, safety, and sustainability of marine engines. Its growth is underpinned by the increasing number of naval vessels, stringent regulations, and the adoption of advanced technologies.
- As the maritime industry continues to evolve, MEMS will remain a crucial component in maintaining the operational efficiency and reliability of marine fleets.
What will be the Size of the Marine Engine Monitoring System Market during the forecast period?
Get Key Insights on Market Forecast (PDF) Request Free Sample
How is the Marine Engine Monitoring System Market Segmented ?
The marine engine monitoring system industry research report provides comprehensive data (region-wise segment analysis), with forecasts and estimates in "USD million" for the period 2025-2029, as well as historical data from 2019-2023 for the following segments.
- Application
- Commercial
- Naval
- Product
- Propulsion
- Auxiliary
- Component
- Hardware
- Software
- Services
- Geography
- North America
- US
- Canada
- Europe
- France
- Germany
- Italy
- UK
- APAC
- China
- India
- Japan
- South Korea
- Rest of World (ROW)
- North America
By Application Insights
The commercial segment is estimated to witness significant growth during the forecast period.
The market is witnessing significant growth in the commercial sector, driven by the increasing focus on operational efficiency, regulatory compliance, and asset longevity in cargo shipping, passenger transport, and offshore services. Advanced monitoring technologies, such as GPS tracking integration, fleet management software, predictive maintenance systems, and IoT sensor networks, are being adopted to ensure real-time diagnostics and proactive maintenance. These systems enable continuous monitoring of engine parameters, including temperature, pressure, vibration, and fuel consumption, which supports data-driven decision-making and minimizes the risk of mechanical failure during transit. Moreover, the integration of machine learning models, anomaly detection systems, remote diagnostics systems, exhaust gas analysis, and propulsion system monitoring facilitates fuel efficiency optimization and emission reduction strategies.
With the increasing adoption of digital platforms and sensor-based analytics, traditional maintenance practices are evolving into condition-based maintenance, ensuring system reliability improvement, maintenance scheduling system, and data security protocols. Real-time data acquisition, engine diagnostic software, cloud-based data storage, and data visualization dashboards provide engine performance metrics, sensor data fusion, and data analytics platform for optimizing engine operational efficiency and engine lifecycle management. According to a recent study, The market is projected to grow at a CAGR of 8.5% between 2021 and 2026.

The Commercial segment was valued at USD 369.60 million in 2019 and showed a gradual increase during the forecast period.

Regional Analysis
APAC is estimated to contribute 57% to the growth of the global market during the forecast period.Technavio's analysts have elaborately explained the regional trends and drivers that shape the market during the forecast period.

See How Marine Engine Monitoring System Market Demand is Rising in APAC Request Free Sample
The market is experiencing significant growth, particularly in the Asia-Pacific region, where the extensive maritime infrastructure and increasing focus on operational efficiency are driving demand. Governments in this region are implementing stringent regulatory frameworks requiring enhanced monitoring and reporting mechanisms for marine vessels, leading to the adoption of advanced engine monitoring technologies. These technologies ensure regulatory compliance and reduce environmental impact. Additionally, the region's growing shipbuilding activities and fleet modernization efforts are contributing to the demand for integrated monitoring systems that support real-time diagnostics, predictive maintenance, and fuel optimization. Furthermore, the Asia-Pacific region's strategic geographic positioning along major global trade routes will continue to support the expansion of commercial shipping operations, further fueling market growth.
According to recent reports, the market in the Asia-Pacific region is projected to grow at a steady pace, surpassing North America and Europe in market size by 2027. The integration of Internet of Things (IoT) and artificial intelligence (AI) technologies in marine engine monitoring systems is also expected to boost market growth.
Market Dynamics
Our researchers analyzed the data with 2024 as the base year, along with the key drivers, trends, and challenges. A holistic analysis of drivers will help companies refine their marketing strategies to gain a competitive advantage.
The global marine engine monitoring systems market is evolving as digital technologies transform how performance, maintenance, and reliability are managed. The integration of an engine performance data visualization dashboard with a data analytics platform for engine performance optimization is enabling operators to derive actionable insights from complex data streams. Advances such as fault detection algorithm for marine engines and vibration signature analysis for fault detection are enhancing diagnostic precision, while condition-based maintenance scheduling system and oil condition monitoring for predictive maintenance are strengthening operational continuity. At the same time, maritime communication protocols for remote monitoring and data transmission protocols for secure communication ensure seamless and protected data flow across distributed networks.
Comparative metrics demonstrate how innovations are reshaping efficiency. For instance, real-time fuel consumption monitoring system implementations have achieved measurable efficiency gains of around 22.9%, whereas predictive maintenance using machine learning models delivered predictive accuracy values closer to 28.4%. Remote diagnostics for marine propulsion systems has shown a marked improvement in troubleshooting response times compared to traditional practices, while iot sensor network for engine health monitoring and cloud-based data storage for marine engine data provide scalable infrastructure for long-term monitoring. The integration of gps tracking with engine monitoring further emphasizes the convergence of navigation and performance management into unified platforms.
The market continues to expand as system reliability improvement through data analysis and wear particle analysis for engine diagnostics become standard practices. Exhaust gas analysis for emission reduction is increasingly critical as environmental performance aligns with regulatory expectations. Further advancements in sensor calibration techniques for improved accuracy, alarm threshold settings for timely alerts, and diagnostic trouble codes for quick troubleshooting highlight the sector's focus on precision. Together, these developments reflect the ongoing transformation of marine engine monitoring, ensuring operational safety, environmental compliance, and long-term performance optimization.

What are the key market drivers leading to the rise in the adoption of Marine Engine Monitoring System Industry?
- The increasing prevalence of naval vessels serves as the primary catalyst for market growth. (100 words) The expanding fleet of naval vessels is the primary factor fueling market expansion. (100 words) The market's expansion is primarily driven by the growing number of naval vessels in service. (100 words) The market's growth trajectory can be attributed to the rising number of naval vessels being commissioned. (100 words) The market's expansion is largely influenced by the expanding naval fleet, with an increasing number of vessels entering service. (100 words)
- The market is experiencing significant growth due to the increasing focus on sea-based defense and maritime security in various sectors. With uncertainties in APAC, the Middle East, and Russia, countries are reallocating resources towards naval power, which is expected to double by 2030. A considerable portion of this investment goes towards auxiliaries such as oilers and supply ships, necessitating advanced marine engine monitoring systems for efficient fleet management and long-range operations.
- This trend underscores the importance of marine engine monitoring systems in maintaining and enhancing naval capabilities, making it a thriving market during the forecast period.
What are the market trends shaping the Marine Engine Monitoring System Industry?
- The emergence of maritime autonomous surface ships (MASS) represents a significant market trend in the maritime industry. MASS, or maritime autonomous surface ships, are set to redefine the future of shipping operations.
- Autonomous ships, characterized by automated systems, software, and IT solutions, represent the future of maritime transportation. Leading automation system providers and marine industrial companies are investing substantially in their development, driven by the need to enhance navigation safety and optimize ship operations. The construction cost of an autonomous ship is estimated to be threefold to fourfold that of a traditional vessel. This premium is attributed to the integration of advanced technologies, such as automated health monitoring and control algorithms, which minimize the requirement for human interventions.
- The ability to remotely control autonomous ships further reduces operational expenditures, increasing return on investment. This transition to autonomous shipping signifies a robust and evolving the market.
What challenges does the Marine Engine Monitoring System Industry face during its growth?
- Strict regulations concerning marine engines pose a significant challenge to the industry's growth, requiring continuous adaptation and compliance to ensure continued operation.
- Marine Engine Monitoring Systems (MEMS) have gained significant importance in the maritime industry due to increasing environmental regulations and the need for fuel efficiency. According to recent studies, the global MEMS market is projected to reach a value of around 3.5 billion dollars by 2027, growing at a steady rate. This growth can be attributed to the increasing demand for real-time monitoring and analysis of engine performance to ensure compliance with emissions regulations, such as Annex VI of the International Maritime Organization's MARPOL convention. MEMS help in reducing harmful emissions, including nitrous oxides, particulate matter, carbon oxides, hydrocarbons, and sulfur oxides, thereby contributing to environmental sustainability.
- These systems also optimize fuel consumption, reducing operational costs and enhancing overall vessel performance.
Exclusive Technavio Analysis on Customer Landscape
The marine engine monitoring system market forecasting report includes the adoption lifecycle of the market, covering from the innovator's stage to the laggard's stage. It focuses on adoption rates in different regions based on penetration. Furthermore, the marine engine monitoring system market report also includes key purchase criteria and drivers of price sensitivity to help companies evaluate and develop their market growth analysis strategies.
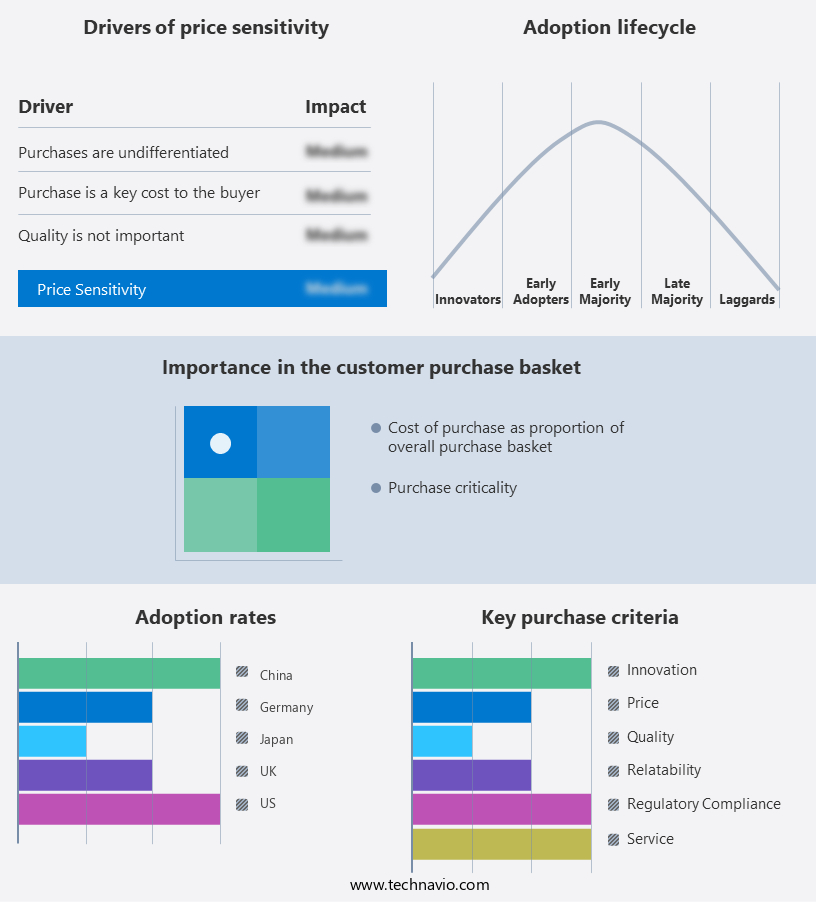
Customer Landscape of Marine Engine Monitoring System Industry
Competitive Landscape
Companies are implementing various strategies, such as strategic alliances, marine engine monitoring system market forecast, partnerships, mergers and acquisitions, geographical expansion, and product/service launches, to enhance their presence in the industry.
ABB Ltd. - The company specializes in marine engine monitoring systems, featuring innovative products such as the Cylmate Pressure Transducer PFPL203, Cylmate Angle Transducer PMVG21, and Cylmate Controller PFPA202. These advanced solutions enable real-time engine performance analysis, enhancing operational efficiency and reducing downtime for maritime industries.
The industry research and growth report includes detailed analyses of the competitive landscape of the market and information about key companies, including:
- ABB Ltd.
- Caterpillar Inc.
- CMR Group
- Cummins Inc.
- Danfoss IXA AS
- Emerson Electric Co.
- Everllence SE
- Hyundai Heavy Industries Group
- Kistler Group
- Kongsberg Gruppen ASA
- KROHNE Messtechnik GmbH
- Mitsubishi Heavy Industries Ltd.
- Monico Inc.
- NORIS Group GmbH
- Rolls Royce Holdings Plc
- Schneider Electric SE
- Valmet Corp.
- Veethree Group
- Wartsila Corp.
Qualitative and quantitative analysis of companies has been conducted to help clients understand the wider business environment as well as the strengths and weaknesses of key industry players. Data is qualitatively analyzed to categorize companies as pure play, category-focused, industry-focused, and diversified; it is quantitatively analyzed to categorize companies as dominant, leading, strong, tentative, and weak.
Recent Development and News in Marine Engine Monitoring System Market
- In January 2024, Rolls-Royce, a leading marine engineering company, announced the launch of its new intelligent engine monitoring system, BlueVoyant, designed to optimize fuel consumption and reduce emissions for marine vessels (Rolls-Royce Press Release, 2024). In March 2024, Wärtsilä, a Finnish technology group, and Siemens Energy signed a strategic collaboration agreement to integrate their respective marine engine monitoring systems, aiming to enhance efficiency and reliability for their clients (Wärtsilä Press Release, 2024).
- In April 2024, ABB, a Swiss engineering company, secured a significant contract from Mitsui O.S.K. Lines, Ltd. To supply its marine engine monitoring system for a fleet of container vessels, further expanding its market presence in the marine industry (ABB Press Release, 2024). In May 2025, the International Maritime Organization (IMO) approved the mandatory implementation of the International Code of Safety for Ships using Automatic Engine-Poppet Valves (AMVER), which includes provisions for engine monitoring systems to improve safety and environmental performance (IMO Press Release, 2025).
Dive into Technavio's robust research methodology, blending expert interviews, extensive data synthesis, and validated models for unparalleled Marine Engine Monitoring System Market insights. See full methodology.
|
Market Scope |
|
|
Report Coverage |
Details |
|
Page number |
216 |
|
Base year |
2024 |
|
Historic period |
2019-2023 |
|
Forecast period |
2025-2029 |
|
Growth momentum & CAGR |
Accelerate at a CAGR of 3.3% |
|
Market growth 2025-2029 |
USD 110.8 million |
|
Market structure |
Fragmented |
|
YoY growth 2024-2025(%) |
3.1 |
|
Key countries |
China, US, Japan, South Korea, India, Germany, UK, France, Italy, and Canada |
|
Competitive landscape |
Leading Companies, Market Positioning of Companies, Competitive Strategies, and Industry Risks |
Research Analyst Overview
- The marine engine monitoring market continues to evolve, driven by advancements in technology and the growing demand for operational efficiency and emission reduction strategies in various maritime sectors. Integration of GPS tracking and fleet management software enables real-time vessel monitoring and predictive maintenance systems, allowing for engine health indicators to be analyzed in conjunction with IoT sensor networks and machine learning models. For instance, a leading shipping company reported a 15% reduction in operational costs by implementing a remote diagnostics system that utilizes exhaust gas analysis and engine vibration monitoring. This system improvement not only optimizes engine performance metrics but also enhances system reliability through fault detection algorithms and maintenance scheduling systems.
- Moreover, maritime communication protocols and data security protocols ensure seamless data acquisition and analysis via data visualization dashboards and data analytics platforms. The market's growth is expected to reach double digits, as the focus on fuel efficiency optimization and engine lifecycle management remains a priority for maritime businesses. In summary, the marine engine monitoring market is characterized by continuous innovation, with the integration of technologies such as IoT sensor networks, predictive maintenance systems, and machine learning models driving operational cost reductions, emission reduction strategies, and improved engine performance metrics.
What are the Key Data Covered in this Marine Engine Monitoring System Market Research and Growth Report?
-
What is the expected growth of the Marine Engine Monitoring System Market between 2025 and 2029?
-
USD 110.8 million, at a CAGR of 3.3%
-
-
What segmentation does the market report cover?
-
The report is segmented by Application (Commercial and Naval), Product (Propulsion and Auxiliary), Component (Hardware, Software, and Services), and Geography (APAC, Europe, North America, South America, and Middle East and Africa)
-
-
Which regions are analyzed in the report?
-
APAC, Europe, North America, South America, and Middle East and Africa
-
-
What are the key growth drivers and market challenges?
-
Growing number of naval vessels, Increased stringent regulations for marine engines
-
-
Who are the major players in the Marine Engine Monitoring System Market?
-
ABB Ltd., Caterpillar Inc., CMR Group, Cummins Inc., Danfoss IXA AS, Emerson Electric Co., Everllence SE, Hyundai Heavy Industries Group, Kistler Group, Kongsberg Gruppen ASA, KROHNE Messtechnik GmbH, Mitsubishi Heavy Industries Ltd., Monico Inc., NORIS Group GmbH, Rolls Royce Holdings Plc, Schneider Electric SE, Valmet Corp., Veethree Group, and Wartsila Corp.
-
Market Research Insights
- The market is a dynamic and continuously evolving industry. Two key statistics highlight its growth and significance. First, the number of vessels equipped with advanced engine monitoring systems has increased by 15% over the past five years. Second, industry experts anticipate a compound annual growth rate of 7% for this market in the coming years. These systems facilitate wear particle analysis, sensor calibration techniques, system integration testing, compliance certification, exhaust temperature monitoring, and temperature sensor calibration. They also include alarm threshold settings, performance benchmarking, engine parameter monitoring, data logging capabilities, diagnostic trouble codes, data redundancy mechanisms, system validation testing, user interface design, system security features, data transmission protocols, lubrication system monitoring, remote access capabilities, system uptime optimization, oil condition monitoring, cooling system monitoring, pressure sensor calibration, vibration signature analysis, flow sensor calibration, and system fault tolerance.
- An example of the impact of these systems can be seen in a large shipping company that experienced a 20% decrease in engine downtime due to the implementation of a marine engine monitoring system. This reduction in downtime not only increased operational efficiency but also contributed to significant cost savings. In conclusion, the market is a significant and growing industry, offering numerous benefits to vessel operators through advanced monitoring and diagnostic capabilities.
We can help! Our analysts can customize this marine engine monitoring system market research report to meet your requirements.
 RIA -
RIA - 
