
Marine Propulsion Engine Market Analysis, Size, and Forecast 2026-2030: APAC (China, Japan, and India), Europe (Germany, UK, and France), North America (US, Canada, and Mexico), Middle East and Africa (Saudi Arabia, UAE, and South Africa), South America (Brazil, Argentina, and Chile), and Rest of World (ROW)

Marine Propulsion Engine Market Analysis, Size, and Forecast 2026-2030:
APAC (China, Japan, and India), Europe (Germany, UK, and France), North America (US, Canada, and Mexico), Middle East and Africa (Saudi Arabia, UAE, and South Africa), South America (Brazil, Argentina, and Chile), and Rest of World (ROW)

Published: Oct 2026 299 Pages SKU: IRTNTR44856

Market Overview at a Glance

$1.34 B
Market Opportunity
3.2%
CAGR 2025 - 2030
57.2%
APAC Growth
$3.84 B
Passenger segment 2024

Marine Propulsion Engine Market Size 2026-2030

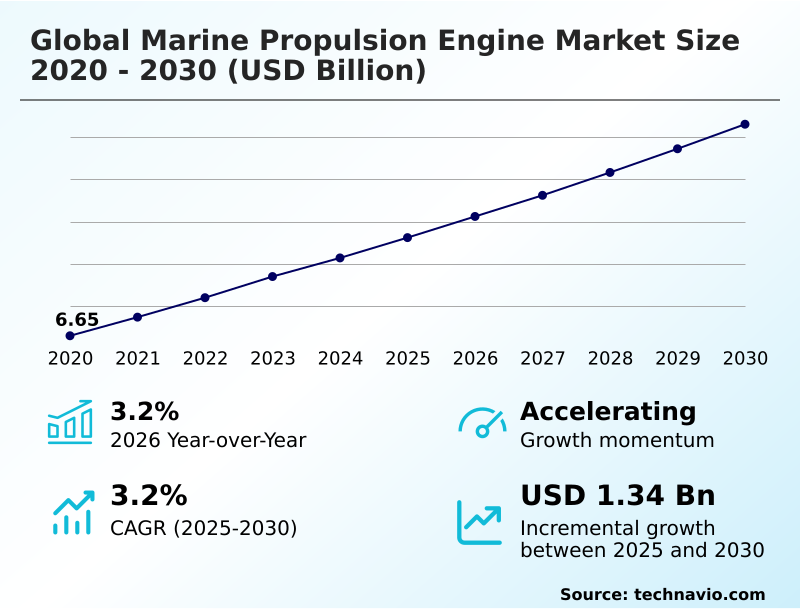
The marine propulsion engine market size is valued to increase by USD 1.34 billion, at a CAGR of 3.2% from 2025 to 2030. Multi-fuel and ammonia-ready marine engines will drive the marine propulsion engine market.

Major Market Trends & Insights

  • APAC dominated the market and accounted for a 57.2% growth during the forecast period.
  • By Application - Passenger segment was valued at USD 3.84 billion in 2024
  • By Type - Diesel segment accounted for the largest market revenue share in 2024

Market Size & Forecast

  • Market Opportunities: USD 2.50 billion
  • Market Future Opportunities: USD 1.34 billion
  • CAGR from 2025 to 2030 : 3.2%

Market Summary

  • The Marine Propulsion Engine Market is undergoing a rapid technological transformation as stakeholders prioritize high-efficiency, low-emission power systems. To comply with rigorous environmental mandates, fleet managers are overhauling procurement strategies by transitioning from conventional heavy oil systems to advanced alternative fuel engines.
  • In a practical supply chain scenario, a commercial shipping line upgrading its container fleet with digital diagnostic tools achieved a 25% reduction in fuel consumption compared to its legacy mechanical engines. A primary driver of this market is the accelerated deployment of multi-fuel marine platforms, which allow operators to maintain current operations while securing a future-proof pathway to zero-carbon fuels.
  • Conversely, the market faces a substantial challenge due to the severe financial and regulatory burdens of fleet decarbonization. The immense capital expenditure required to design, certify, and install these advanced combustion engines heavily strains the profit margins of smaller fleet operators. Balancing these high upfront costs with the necessity for robust operational efficiency remains a critical focus for maritime stakeholders.

What will be the Size of the Marine Propulsion Engine Market during the forecast period?
Get Key Insights on Market Forecast (PDF) Get Free Sample

How is the Marine Propulsion Engine Market Segmented?

The marine propulsion engine industry research report provides comprehensive data (region-wise segment analysis), with forecasts and estimates in "USD million" for the period 2026-2030, as well as historical data from 2020-2024 for the following segments.

  • Application
    • Passenger
    • Commercial
    • Defense
  • Type
    • Diesel
    • Gas
  • Fuel type
    • Marine diesel
    • Heavy fuel oil
    • Liquefied natural gas
    • Methanol
  • Geography
    • APAC
      • China
      • Japan
      • India
      • South Korea
      • Australia
      • Indonesia
    • Europe
      • Germany
      • UK
      • France
      • Italy
      • Spain
      • The Netherlands
    • North America
      • US
      • Canada
      • Mexico
    • Middle East and Africa
      • Saudi Arabia
      • UAE
      • South Africa
      • Israel
      • Turkey
    • South America
      • Brazil
      • Argentina
      • Chile

By Application Insights

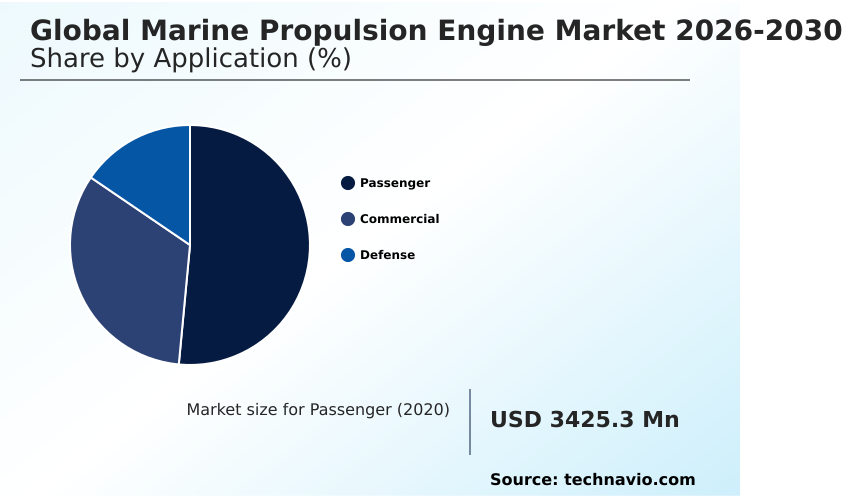
The passenger segment is estimated to witness significant growth during the forecast period.

The passenger application segment within the global marine propulsion engine market 2026-2030 is experiencing a structural shift driven by intensive maritime decarbonization efforts and urban fleet electrification.

Operators are prioritizing a highly efficient four stroke diesel engine and rapid noise signature reduction to seamlessly meet stringent urban harbor regulations.

The strategic transition from traditional setups to a modern hybrid electric architecture allows for zero-emission maneuvers in sensitive coastal zones. This advanced electrification has improved overall vessel load management, yielding a 15% reduction in fuel consumption during harbor transits.

By integrating a flexible dual fuel propulsion system alongside robust battery energy storage and responsive variable frequency drives, passenger ferry managers successfully balance high-speed open-water performance with tight emission control area mandates.

Such modernizations enable cruise lines to maintain long-term profitability while future-proofing highly expensive maritime assets.
Get Free Sample

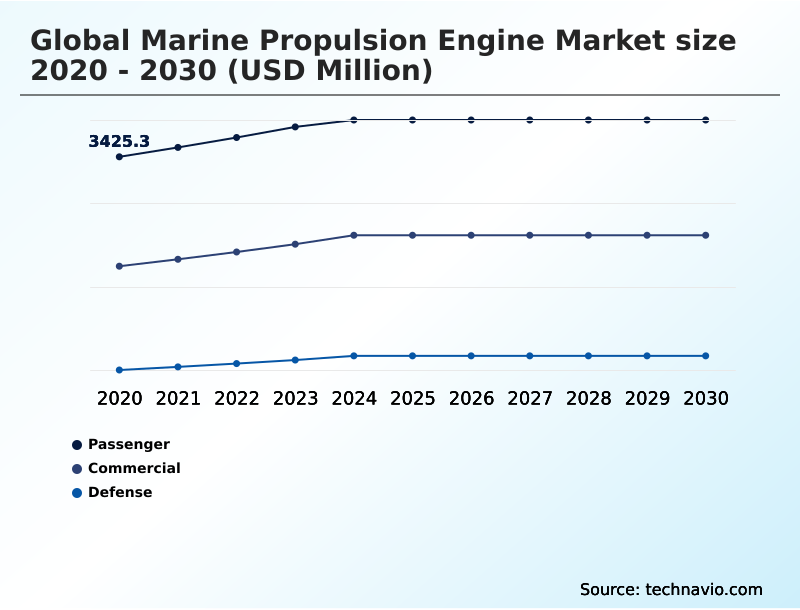
The Passenger segment was valued at USD 3.84 billion in 2024 and showed a gradual increase during the forecast period.
Get Free Sample

Regional Analysis

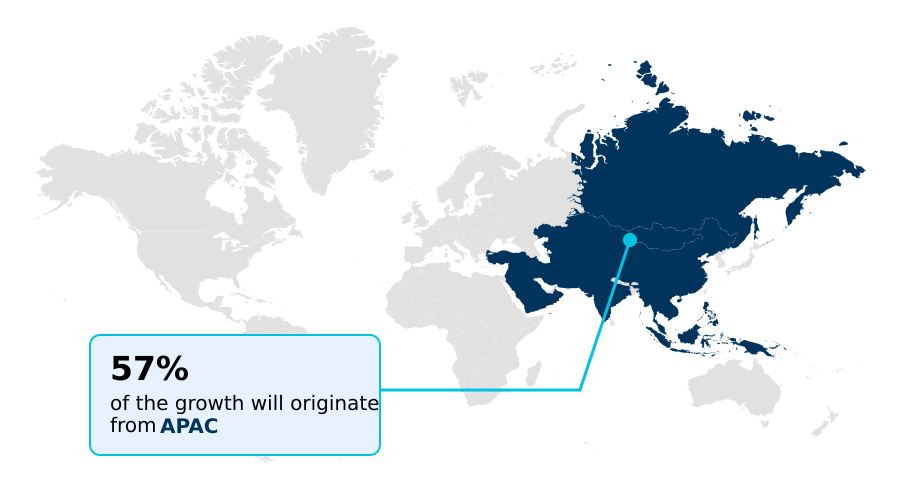
APAC is estimated to contribute 57.2% to the growth of the global market during the forecast period.Technavio’s analysts have elaborately explained the regional trends and drivers that shape the market during the forecast period.
See How Marine Propulsion Engine Market Demand is Rising in APAC Get Free Sample

The geographic landscape of the Marine Propulsion Engine Market reveals distinct evolutionary paths driven by regional commercial freight transport volumes and rapid shipbuilding modernization capabilities.

The APAC region commands a dominant position, accounting for a 57.2% share of incremental market growth, heavily supported by massive shipyard outputs focusing on reliable liquefied natural gas engine installations.

In contrast, Europe exhibits a highly accelerated transition toward complete zero emission shipping, resulting in a 40% higher adoption rate of advanced methanol ready propulsion systems compared to APAC.

Fleet operators in Europe are leveraging predictive digital twin diagnostics and continuous condition based monitoring to cut routine operational maintenance costs by 18%.

This significant disparity highlights how APAC capitalizes on scale and a vast oceanic logistics network, while European policies enforcing strict tier III compliance force earlier, technology-intensive investments in alternative fuels and highly maneuverable azimuth stern drive units.

Market Dynamics

Our researchers analyzed the data with 2025 as the base year, along with the key drivers, trends, and challenges. A holistic analysis of drivers will help companies refine their marketing strategies to gain a competitive advantage.

  • The structural evolution of the Marine Propulsion Engine Market is fundamentally reshaping how maritime operators approach vessel design and lifecycle maintenance.
  • As regulatory scrutiny intensifies across international waters, the implementation of dual fuel engine emission reduction strategies has become a cornerstone of modern fleet management, allowing vessels to pivot dynamically between traditional distillates and cleaner alternatives without disrupting established supply chains.
  • Concurrently, the rapid rise of hybrid electric passenger ferry propulsion is transforming coastal transit networks, where operators deploy advanced battery integrations to achieve a 40% improvement in energy retention compared to legacy mechanical setups. This shift toward electrification enhances operational planning by enabling silent, high-efficiency harbor maneuvers.
  • To mitigate the financial risks of stranded assets, shipbuilders are heavily investing in a modular architecture for methanol retrofitting, granting fleet owners the flexibility to adopt green fuels once port infrastructure matures. In heavy-duty commercial shipping, achieving ammonia ready marine combustion optimization remains a formidable engineering priority, aimed at completely eliminating carbon outputs during deep-sea voyages.
  • Furthermore, the integration of ai driven predictive maintenance diagnostics empowers onshore engineering teams to remotely monitor real-time component health. By proactively addressing mechanical wear, maritime logistics companies optimize dry-docking schedules and realize significantly higher vessel availability, driving resilient trade operations.
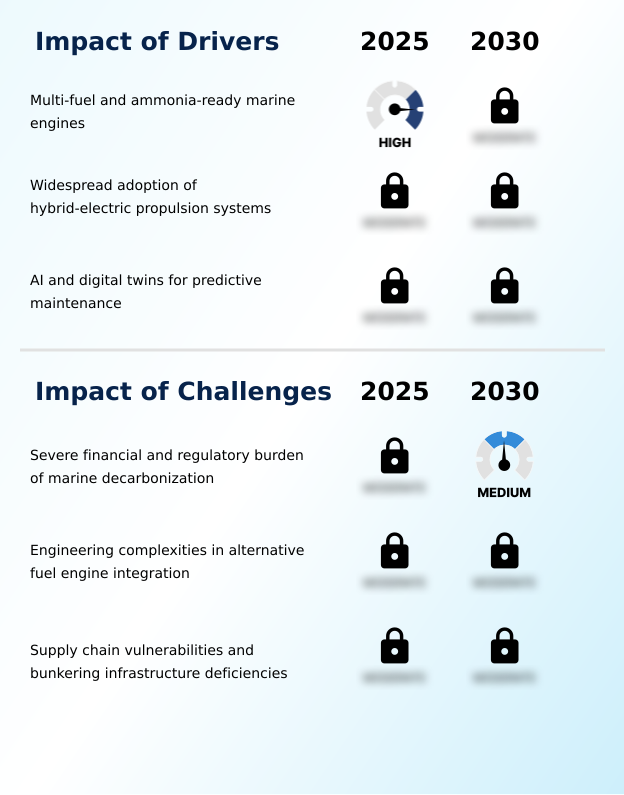
What are the key market drivers leading to the rise in the adoption of Marine Propulsion Engine Industry?

  • The accelerated development and adoption of multi-fuel and ammonia-ready marine engines serve as a primary market driver, empowering fleet operators to meet stringent decarbonization targets.

  • The Marine Propulsion Engine Market is primarily propelled by urgent regulatory mandates enforcing aggressive greenhouse gas reduction across heavy maritime transportation. Because authorities demand strict environmental compliance, fleet operators must optimize their capital expenditure planning to maintain global port access.
  • The rapid deployment of an advanced two stroke crosshead engine engineered with a highly adaptable fuel flexible architecture directly addresses this formidable challenge.
  • By integrating a sophisticated exhaust gas recirculation unit and robust selective catalytic reduction technology, shipowners have successfully lowered hazardous nitrogen outputs by 75% compared to legacy vessels.
  • Additionally, the strategic adoption of a dependable power take off generator optimizes dynamic load smoothing, subsequently reducing overall fuel consumption by 18% while supporting ongoing marine infrastructure development.
  • This critical technological shift, alongside preparations for clean ammonia combustion, ensures modern commercial vessels achieve strict energy targets while maximizing essential operational uptime.

What are the market trends shaping the Marine Propulsion Engine Industry?

  • The emergence of modular engine architectures represents a significant market trend, enabling cost-effective and future-proof retrofitting of maritime vessels. This design philosophy allows operators to adapt seamlessly to alternative fuels as regulatory frameworks and bunkering infrastructures evolve.

  • The Marine Propulsion Engine Market is experiencing a structural trend toward the widespread adoption of modular engine architectures and intelligent diagnostic ecosystems. Because global alternative fuel bunkering infrastructure remains heavily fragmented, shipowners demand flexible engineering designs to avoid the prohibitive costs of full mechanical replacements.
  • By implementing precise common rail fuel injection and dynamic thermal efficiency optimization, commercial fleets have reduced subsequent fuel waste by up to 20%. Furthermore, the shift toward continuous remote engine diagnostics through high-speed satellite links allows operators to track smart engine telemetry in real time.
  • The integration of advanced predictive maintenance software alongside a highly efficient waste heat recovery unit has improved mechanical failure prediction accuracy by 25%, drastically extending mandatory dry docking intervals. Ultimately, deploying these digital innovations alongside robust methane slip mitigation and emerging autonomous vessel propulsion capabilities empowers logistics companies to navigate complex regulatory uncertainties successfully.

What challenges does the Marine Propulsion Engine Industry face during its growth?

  • The severe financial strain and regulatory complexities associated with marine decarbonization pose substantial challenges, hindering rapid industry growth by demanding unprecedented capital expenditures for alternative fuel integrations.

  • The Marine Propulsion Engine Market faces severe structural challenges stemming from the financial burdens and engineering complexities of alternative fuel integration. Because low-carbon fuels possess vastly different chemical properties, manufacturers must completely overhaul existing injection networks to achieve necessary classification society approval.
  • Transitioning from conventional marine gas oil to highly volatile alternatives requires unprecedented capital outlays, increasing initial shipbuilding procurement costs by nearly 35%. Furthermore, integrating a complex high pressure gas injection system demands extensive vessel redesigns, ultimately reducing overall cargo carrying capacity by 15%.
  • Operators relying on legacy heavy fuel oil scrubbers remain highly hesitant to deploy an unproven hydrogen fuel cell hybrid setup for demanding short sea shipping routes aiming for zero emission shipping due to severe supply chain vulnerabilities.
  • Overcoming these technical barriers, including ensuring absolute corrosive saltwater resistance and integrating reliable smart engine telemetry for advanced naval defense systems, remains critically essential for the deployment of next-generation marine propulsion.

Exclusive Technavio Analysis on Customer Landscape

The marine propulsion engine market forecasting report includes the adoption lifecycle of the market, covering from the innovator’s stage to the laggard’s stage. It focuses on adoption rates in different regions based on penetration. Furthermore, the marine propulsion engine market report also includes key purchase criteria and drivers of price sensitivity to help companies evaluate and develop their market growth analysis strategies.
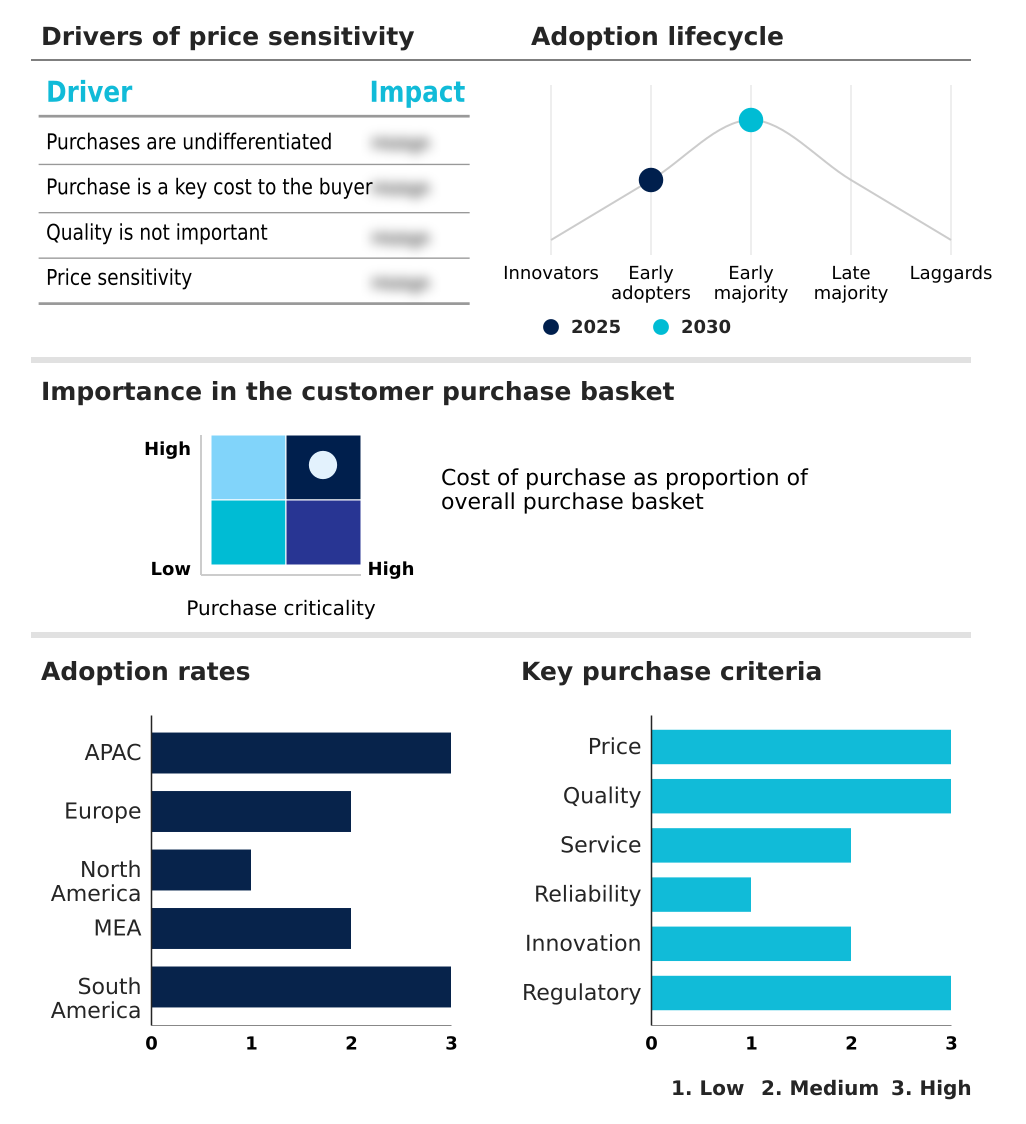
Customer Landscape of Marine Propulsion Engine Industry

Competitive Landscape

Companies are implementing various strategies, such as strategic alliances, marine propulsion engine market forecast, partnerships, mergers and acquisitions, geographical expansion, and product/service launches, to enhance their presence in the industry.

Anglo Belgian Corp. - Delivering robust marine propulsion engines tailored for commercial and recreational vessels, this product line emphasizes unparalleled reliability, enhanced fuel efficiency, and sustained performance under demanding maritime conditions.

The industry research and growth report includes detailed analyses of the competitive landscape of the market and information about key companies, including:

  • Anglo Belgian Corp.
  • Caterpillar Inc.
  • Cummins Inc.
  • Deere and Co.
  • DEUTZ AG
  • General Electric Co.
  • IHI Corp.
  • KOHLER Co.
  • Liebherr International AG
  • MAN Energy Solutions SE
  • Mercury Marine.
  • Mitsubishi Heavy Industries
  • Rolls Royce Power Systems AG
  • Scania AB
  • Volvo Penta AB
  • Wartsila Corp.
  • WeiChai Holding Group Co. Ltd.
  • Yanmar Holdings Co. Ltd.

Qualitative and quantitative analysis of companies has been conducted to help clients understand the wider business environment as well as the strengths and weaknesses of key industry players. Data is qualitatively analyzed to categorize companies as pure play, category-focused, industry-focused, and diversified; it is quantitatively analyzed to categorize companies as dominant, leading, strong, tentative, and weak.

Recent Development and News in Marine propulsion engine market

  • In the Industrial Machinery and Supplies and Components industry, the widespread adoption of predictive maintenance software across manufacturing facilities has established new reliability benchmarks, directly impacting Marine Propulsion Engine demand by requiring vessel operators to integrate smart engine telemetry to achieve a 20% increase in operational uptime.
  • The transition toward zero emission shipping frameworks has forced heavy machinery producers to innovate fuel flexible architecture solutions, accelerating the development of methanol ready propulsion systems that decrease lifecycle greenhouse gas emissions by up to 80% for commercial freight transport fleets.
  • Stricter environmental policies mandating tier III compliance across international trade routes have compelled industrial component suppliers to scale the production of selective catalytic reduction systems, subsequently enabling maritime decarbonization efforts by cutting nitrogen oxide exhaust outputs by 75% in modern naval defense systems.
  • Advancements in heavy-duty battery cell manufacturing within the broader industrial component sector have lowered the cost of high-density battery energy storage, prompting short sea shipping operators to adopt a hybrid electric architecture that improves overall energy efficiency by 30% during coastal transits.

Dive into Technavio’s robust research methodology, blending expert interviews, extensive data synthesis, and validated models for unparalleled Marine Propulsion Engine Market insights. See full methodology.

Market Scope
Page number 299
Base year 2025
Historic period 2020-2024
Forecast period 2026-2030
Growth momentum & CAGR Accelerate at a CAGR of 3.2%
Market growth 2026-2030 USD 1340.4 million
Market structure Fragmented
YoY growth 2025-2026(%) 3.2%
Key countries China, Japan, India, South Korea, Australia, Indonesia, Germany, UK, France, Italy, Spain, The Netherlands, US, Canada, Mexico, Saudi Arabia, UAE, South Africa, Israel, Turkey, Brazil, Argentina and Chile
Competitive landscape Leading Companies, Market Positioning of Companies, Competitive Strategies, and Industry Risks

Request Free Sample

Research Analyst Overview

  • The global marine propulsion engine market 2026-2030 is undergoing a profound structural transformation as global shipping conglomerates align technological procurement with stringent decarbonization mandates. Boardroom executives are aggressively restructuring their vessel asset portfolios, prioritizing the integration of a modular two stroke crosshead engine to mitigate the long-term risk of regulatory non-compliance.
  • By transitioning toward a flexible dual fuel propulsion strategy, fleet operators can seamlessly navigate volatile energy markets while simultaneously achieving a 30% reduction in lifecycle exhaust emissions compared to legacy mechanical setups. The rapid deployment of an advanced selective catalytic reduction system has become critical for ensuring unhindered access to highly regulated coastal ports.
  • Furthermore, the incorporation of predictive maintenance software allows onshore engineering teams to remotely monitor vessel health, vastly improving mechanical reliability during transoceanic voyages. The strategic implementation of methane slip mitigation technologies further ensures that alternative fuel investments yield maximum ecological and operational benefits.
  • Ultimately, the widespread adoption of a robust common rail fuel injection framework empowers commercial operators to optimize continuous combustion efficiency, driving sustained profitability across modern maritime logistics operations.

What are the Key Data Covered in this Marine Propulsion Engine Market Research and Growth Report?

  • What is the expected growth of the Marine Propulsion Engine Market between 2026 and 2030?

    • USD 1.34 billion, at a CAGR of 3.2%

  • What segmentation does the market report cover?

    • The report is segmented by Application (Passenger, Commercial, and Defense), Type (Diesel, and Gas), Fuel Type (Marine diesel, Heavy fuel oil, Liquefied natural gas, and Methanol) and Geography (APAC, Europe, North America, Middle East and Africa, South America)

  • Which regions are analyzed in the report?

    • APAC, Europe, North America, Middle East and Africa and South America

  • What are the key growth drivers and market challenges?

    • Multi-fuel and ammonia-ready marine engines, Severe financial and regulatory burden of marine decarbonization

  • Who are the major players in the Marine Propulsion Engine Market?

    • Anglo Belgian Corp., Caterpillar Inc., Cummins Inc., Deere and Co., DEUTZ AG, General Electric Co., IHI Corp., KOHLER Co., Liebherr International AG, MAN Energy Solutions SE, Mercury Marine., Mitsubishi Heavy Industries, Rolls Royce Power Systems AG, Scania AB, Volvo Penta AB, Wartsila Corp., WeiChai Holding Group Co. Ltd. and Yanmar Holdings Co. Ltd.

Market Research Insights

  • The Marine Propulsion Engine Market is rapidly evolving as fleet operators face mounting pressure to accelerate maritime decarbonization. Driven by stringent environmental mandates, vessel owners are upgrading legacy systems to achieve comprehensive tier III compliance. This strategic shift has led to a 25% increase in alternative fuel bunkering utilization, facilitating smoother transitions to cleaner energy sources.
  • By optimizing capital expenditure planning, fleets have integrated advanced technologies that yield a 15% reduction in overall fuel consumption, directly improving profitability. Furthermore, extending dry docking intervals through proactive diagnostics has decreased annual maintenance overhead by nearly 20%, ensuring high-value assets maintain optimal operational uptime while seamlessly aligning with modern environmental regulations.

We can help! Our analysts can customize this marine propulsion engine market research report to meet your requirements.

Get in touch

1. Executive Summary

1.1 Market overview

Executive Summary - Chart on Market Overview
Executive Summary - Data Table on Market Overview
Executive Summary - Chart on Global Market Characteristics
Executive Summary - Chart on Market by Geography
Executive Summary - Chart on Market Segmentation by Application
Executive Summary - Chart on Market Segmentation by Type
Executive Summary - Chart on Market Segmentation by Fuel Type
Executive Summary - Chart on Incremental Growth
Executive Summary - Data Table on Incremental Growth
Executive Summary - Chart on Company Market Positioning

2. Technavio Analysis

2.1 Analysis of price sensitivity, lifecycle, customer purchase basket, adoption rates, and purchase criteria

2.2 Criticality of inputs and Factors of differentiation

Chart on Overview on criticality of inputs and factors of differentiation

2.3 Factors of disruption

Chart on Overview on factors of disruption

2.4 Impact of drivers and challenges

Chart on Impact of drivers and challenges in 2025 and 2030

3. Market Landscape

3.1 Market ecosystem

Chart on Parent Market
Data Table on - Parent Market

3.2 Market characteristics

Chart on Market characteristics analysis

3.3 Value chain analysis

Chart on Value chain analysis

4. Market Sizing

4.1 Market definition

Data Table on Offerings of companies included in the market definition

4.2 Market segment analysis

Market segments

4.3 Market size 2025

4.4 Market outlook: Forecast for 2025-2030

Chart on Global - Market size and forecast 2025-2030 ($ million)
Data Table on Global - Market size and forecast 2025-2030 ($ million)
Chart on Global Market: Year-over-year growth 2025-2030 (%)
Data Table on Global Market: Year-over-year growth 2025-2030 (%)

5. Historic Market Size

5.1 Global Marine Propulsion Engine Market 2020 - 2024

Historic Market Size - Data Table on Global Marine Propulsion Engine Market 2020 - 2024 ($ million)

5.2 Application segment analysis 2020 - 2024

Historic Market Size - Application Segment 2020 - 2024 ($ million)

5.3 Type segment analysis 2020 - 2024

Historic Market Size - Type Segment 2020 - 2024 ($ million)

5.4 Fuel Type segment analysis 2020 - 2024

Historic Market Size - Fuel Type Segment 2020 - 2024 ($ million)

5.5 Geography segment analysis 2020 - 2024

Historic Market Size - Geography Segment 2020 - 2024 ($ million)

5.6 Country segment analysis 2020 - 2024

Historic Market Size - Country Segment 2020 - 2024 ($ million)

6. Qualitative Analysis

6.1 Impact of AI on Global Marine Propulsion Engine Market

6.2 Impact of Geopolitical Conflict on Global Marine Propulsion Engine Market

7. Five Forces Analysis

7.1 Five forces summary

Five forces analysis - Comparison between 2025 and 2030

7.2 Bargaining power of buyers

Bargaining power of buyers - Impact of key factors 2025 and 2030

7.3 Bargaining power of suppliers

Bargaining power of suppliers - Impact of key factors in 2025 and 2030

7.4 Threat of new entrants

Threat of new entrants - Impact of key factors in 2025 and 2030

7.5 Threat of substitutes

Threat of substitutes - Impact of key factors in 2025 and 2030

7.6 Threat of rivalry

Threat of rivalry - Impact of key factors in 2025 and 2030

7.7 Market condition

Chart on Market condition - Five forces 2025 and 2030

8. Market Segmentation by Application

8.1 Market segments

Chart on Application - Market share 2025-2030 (%)
Data Table on Application - Market share 2025-2030 (%)

8.2 Comparison by Application

Chart on Comparison by Application
Data Table on Comparison by Application

8.3 Passenger - Market size and forecast 2025-2030

Chart on Passenger - Market size and forecast 2025-2030 ($ million)
Data Table on Passenger - Market size and forecast 2025-2030 ($ million)
Chart on Passenger - Year-over-year growth 2025-2030 (%)
Data Table on Passenger - Year-over-year growth 2025-2030 (%)

8.4 Commercial - Market size and forecast 2025-2030

Chart on Commercial - Market size and forecast 2025-2030 ($ million)
Data Table on Commercial - Market size and forecast 2025-2030 ($ million)
Chart on Commercial - Year-over-year growth 2025-2030 (%)
Data Table on Commercial - Year-over-year growth 2025-2030 (%)

8.5 Defense - Market size and forecast 2025-2030

Chart on Defense - Market size and forecast 2025-2030 ($ million)
Data Table on Defense - Market size and forecast 2025-2030 ($ million)
Chart on Defense - Year-over-year growth 2025-2030 (%)
Data Table on Defense - Year-over-year growth 2025-2030 (%)

8.6 Market opportunity by Application

Market opportunity by Application ($ million)
Data Table on Market opportunity by Application ($ million)

9. Market Segmentation by Type

9.1 Market segments

Chart on Type - Market share 2025-2030 (%)
Data Table on Type - Market share 2025-2030 (%)

9.2 Comparison by Type

Chart on Comparison by Type
Data Table on Comparison by Type

9.3 Diesel - Market size and forecast 2025-2030

Chart on Diesel - Market size and forecast 2025-2030 ($ million)
Data Table on Diesel - Market size and forecast 2025-2030 ($ million)
Chart on Diesel - Year-over-year growth 2025-2030 (%)
Data Table on Diesel - Year-over-year growth 2025-2030 (%)

9.4 Gas - Market size and forecast 2025-2030

Chart on Gas - Market size and forecast 2025-2030 ($ million)
Data Table on Gas - Market size and forecast 2025-2030 ($ million)
Chart on Gas - Year-over-year growth 2025-2030 (%)
Data Table on Gas - Year-over-year growth 2025-2030 (%)

9.5 Market opportunity by Type

Market opportunity by Type ($ million)
Data Table on Market opportunity by Type ($ million)

10. Market Segmentation by Fuel Type

10.1 Market segments

Chart on Fuel Type - Market share 2025-2030 (%)
Data Table on Fuel Type - Market share 2025-2030 (%)

10.2 Comparison by Fuel Type

Chart on Comparison by Fuel Type
Data Table on Comparison by Fuel Type

10.3 Marine diesel - Market size and forecast 2025-2030

Chart on Marine diesel - Market size and forecast 2025-2030 ($ million)
Data Table on Marine diesel - Market size and forecast 2025-2030 ($ million)
Chart on Marine diesel - Year-over-year growth 2025-2030 (%)
Data Table on Marine diesel - Year-over-year growth 2025-2030 (%)

10.4 Heavy fuel oil - Market size and forecast 2025-2030

Chart on Heavy fuel oil - Market size and forecast 2025-2030 ($ million)
Data Table on Heavy fuel oil - Market size and forecast 2025-2030 ($ million)
Chart on Heavy fuel oil - Year-over-year growth 2025-2030 (%)
Data Table on Heavy fuel oil - Year-over-year growth 2025-2030 (%)

10.5 Liquefied natural gas - Market size and forecast 2025-2030

Chart on Liquefied natural gas - Market size and forecast 2025-2030 ($ million)
Data Table on Liquefied natural gas - Market size and forecast 2025-2030 ($ million)
Chart on Liquefied natural gas - Year-over-year growth 2025-2030 (%)
Data Table on Liquefied natural gas - Year-over-year growth 2025-2030 (%)

10.6 Methanol - Market size and forecast 2025-2030

Chart on Methanol - Market size and forecast 2025-2030 ($ million)
Data Table on Methanol - Market size and forecast 2025-2030 ($ million)
Chart on Methanol - Year-over-year growth 2025-2030 (%)
Data Table on Methanol - Year-over-year growth 2025-2030 (%)

10.7 Market opportunity by Fuel Type

Market opportunity by Fuel Type ($ million)
Data Table on Market opportunity by Fuel Type ($ million)

11. Customer Landscape

11.1 Customer landscape overview

Analysis of price sensitivity, lifecycle, customer purchase basket, adoption rates, and purchase criteria

12. Geographic Landscape

12.1 Geographic segmentation

Chart on Market share by geography 2025-2030 (%)
Data Table on Market share by geography 2025-2030 (%)

12.2 Geographic comparison

Chart on Geographic comparison
Data Table on Geographic comparison

12.3 APAC - Market size and forecast 2025-2030

Chart on APAC - Market size and forecast 2025-2030 ($ million)
Data Table on APAC - Market size and forecast 2025-2030 ($ million)
Chart on APAC - Year-over-year growth 2025-2030 (%)
Data Table on APAC - Year-over-year growth 2025-2030 (%)
Chart on Regional Comparison - APAC
Data Table on Regional Comparison - APAC

12.3.1 China - Market size and forecast 2025-2030

Chart on China - Market size and forecast 2025-2030 ($ million)
Data Table on China - Market size and forecast 2025-2030 ($ million)
Chart on China - Year-over-year growth 2025-2030 (%)
Data Table on China - Year-over-year growth 2025-2030 (%)

12.3.2 Japan - Market size and forecast 2025-2030

Chart on Japan - Market size and forecast 2025-2030 ($ million)
Data Table on Japan - Market size and forecast 2025-2030 ($ million)
Chart on Japan - Year-over-year growth 2025-2030 (%)
Data Table on Japan - Year-over-year growth 2025-2030 (%)

12.3.3 India - Market size and forecast 2025-2030

Chart on India - Market size and forecast 2025-2030 ($ million)
Data Table on India - Market size and forecast 2025-2030 ($ million)
Chart on India - Year-over-year growth 2025-2030 (%)
Data Table on India - Year-over-year growth 2025-2030 (%)

12.3.4 South Korea - Market size and forecast 2025-2030

Chart on South Korea - Market size and forecast 2025-2030 ($ million)
Data Table on South Korea - Market size and forecast 2025-2030 ($ million)
Chart on South Korea - Year-over-year growth 2025-2030 (%)
Data Table on South Korea - Year-over-year growth 2025-2030 (%)

12.3.5 Australia - Market size and forecast 2025-2030

Chart on Australia - Market size and forecast 2025-2030 ($ million)
Data Table on Australia - Market size and forecast 2025-2030 ($ million)
Chart on Australia - Year-over-year growth 2025-2030 (%)
Data Table on Australia - Year-over-year growth 2025-2030 (%)

12.3.6 Indonesia - Market size and forecast 2025-2030

Chart on Indonesia - Market size and forecast 2025-2030 ($ million)
Data Table on Indonesia - Market size and forecast 2025-2030 ($ million)
Chart on Indonesia - Year-over-year growth 2025-2030 (%)
Data Table on Indonesia - Year-over-year growth 2025-2030 (%)

12.4 Europe - Market size and forecast 2025-2030

Chart on Europe - Market size and forecast 2025-2030 ($ million)
Data Table on Europe - Market size and forecast 2025-2030 ($ million)
Chart on Europe - Year-over-year growth 2025-2030 (%)
Data Table on Europe - Year-over-year growth 2025-2030 (%)
Chart on Regional Comparison - Europe
Data Table on Regional Comparison - Europe

12.4.1 Germany - Market size and forecast 2025-2030

Chart on Germany - Market size and forecast 2025-2030 ($ million)
Data Table on Germany - Market size and forecast 2025-2030 ($ million)
Chart on Germany - Year-over-year growth 2025-2030 (%)
Data Table on Germany - Year-over-year growth 2025-2030 (%)

12.4.2 UK - Market size and forecast 2025-2030

Chart on UK - Market size and forecast 2025-2030 ($ million)
Data Table on UK - Market size and forecast 2025-2030 ($ million)
Chart on UK - Year-over-year growth 2025-2030 (%)
Data Table on UK - Year-over-year growth 2025-2030 (%)

12.4.3 France - Market size and forecast 2025-2030

Chart on France - Market size and forecast 2025-2030 ($ million)
Data Table on France - Market size and forecast 2025-2030 ($ million)
Chart on France - Year-over-year growth 2025-2030 (%)
Data Table on France - Year-over-year growth 2025-2030 (%)

12.4.4 Italy - Market size and forecast 2025-2030

Chart on Italy - Market size and forecast 2025-2030 ($ million)
Data Table on Italy - Market size and forecast 2025-2030 ($ million)
Chart on Italy - Year-over-year growth 2025-2030 (%)
Data Table on Italy - Year-over-year growth 2025-2030 (%)

12.4.5 Spain - Market size and forecast 2025-2030

Chart on Spain - Market size and forecast 2025-2030 ($ million)
Data Table on Spain - Market size and forecast 2025-2030 ($ million)
Chart on Spain - Year-over-year growth 2025-2030 (%)
Data Table on Spain - Year-over-year growth 2025-2030 (%)

12.4.6 The Netherlands - Market size and forecast 2025-2030

Chart on The Netherlands - Market size and forecast 2025-2030 ($ million)
Data Table on The Netherlands - Market size and forecast 2025-2030 ($ million)
Chart on The Netherlands - Year-over-year growth 2025-2030 (%)
Data Table on The Netherlands - Year-over-year growth 2025-2030 (%)

12.5 North America - Market size and forecast 2025-2030

Chart on North America - Market size and forecast 2025-2030 ($ million)
Data Table on North America - Market size and forecast 2025-2030 ($ million)
Chart on North America - Year-over-year growth 2025-2030 (%)
Data Table on North America - Year-over-year growth 2025-2030 (%)
Chart on Regional Comparison - North America
Data Table on Regional Comparison - North America

12.5.1 US - Market size and forecast 2025-2030

Chart on US - Market size and forecast 2025-2030 ($ million)
Data Table on US - Market size and forecast 2025-2030 ($ million)
Chart on US - Year-over-year growth 2025-2030 (%)
Data Table on US - Year-over-year growth 2025-2030 (%)

12.5.2 Canada - Market size and forecast 2025-2030

Chart on Canada - Market size and forecast 2025-2030 ($ million)
Data Table on Canada - Market size and forecast 2025-2030 ($ million)
Chart on Canada - Year-over-year growth 2025-2030 (%)
Data Table on Canada - Year-over-year growth 2025-2030 (%)

12.5.3 Mexico - Market size and forecast 2025-2030

Chart on Mexico - Market size and forecast 2025-2030 ($ million)
Data Table on Mexico - Market size and forecast 2025-2030 ($ million)
Chart on Mexico - Year-over-year growth 2025-2030 (%)
Data Table on Mexico - Year-over-year growth 2025-2030 (%)

12.6 Middle East and Africa - Market size and forecast 2025-2030

Chart on Middle East and Africa - Market size and forecast 2025-2030 ($ million)
Data Table on Middle East and Africa - Market size and forecast 2025-2030 ($ million)
Chart on Middle East and Africa - Year-over-year growth 2025-2030 (%)
Data Table on Middle East and Africa - Year-over-year growth 2025-2030 (%)
Chart on Regional Comparison - Middle East and Africa
Data Table on Regional Comparison - Middle East and Africa

12.6.1 Saudi Arabia - Market size and forecast 2025-2030

Chart on Saudi Arabia - Market size and forecast 2025-2030 ($ million)
Data Table on Saudi Arabia - Market size and forecast 2025-2030 ($ million)
Chart on Saudi Arabia - Year-over-year growth 2025-2030 (%)
Data Table on Saudi Arabia - Year-over-year growth 2025-2030 (%)

12.6.2 UAE - Market size and forecast 2025-2030

Chart on UAE - Market size and forecast 2025-2030 ($ million)
Data Table on UAE - Market size and forecast 2025-2030 ($ million)
Chart on UAE - Year-over-year growth 2025-2030 (%)
Data Table on UAE - Year-over-year growth 2025-2030 (%)

12.6.3 South Africa - Market size and forecast 2025-2030

Chart on South Africa - Market size and forecast 2025-2030 ($ million)
Data Table on South Africa - Market size and forecast 2025-2030 ($ million)
Chart on South Africa - Year-over-year growth 2025-2030 (%)
Data Table on South Africa - Year-over-year growth 2025-2030 (%)

12.6.4 Israel - Market size and forecast 2025-2030

Chart on Israel - Market size and forecast 2025-2030 ($ million)
Data Table on Israel - Market size and forecast 2025-2030 ($ million)
Chart on Israel - Year-over-year growth 2025-2030 (%)
Data Table on Israel - Year-over-year growth 2025-2030 (%)

12.6.5 Turkey - Market size and forecast 2025-2030

Chart on Turkey - Market size and forecast 2025-2030 ($ million)
Data Table on Turkey - Market size and forecast 2025-2030 ($ million)
Chart on Turkey - Year-over-year growth 2025-2030 (%)
Data Table on Turkey - Year-over-year growth 2025-2030 (%)

12.7 South America - Market size and forecast 2025-2030

Chart on South America - Market size and forecast 2025-2030 ($ million)
Data Table on South America - Market size and forecast 2025-2030 ($ million)
Chart on South America - Year-over-year growth 2025-2030 (%)
Data Table on South America - Year-over-year growth 2025-2030 (%)
Chart on Regional Comparison - South America
Data Table on Regional Comparison - South America

12.7.1 Brazil - Market size and forecast 2025-2030

Chart on Brazil - Market size and forecast 2025-2030 ($ million)
Data Table on Brazil - Market size and forecast 2025-2030 ($ million)
Chart on Brazil - Year-over-year growth 2025-2030 (%)
Data Table on Brazil - Year-over-year growth 2025-2030 (%)

12.7.2 Argentina - Market size and forecast 2025-2030

Chart on Argentina - Market size and forecast 2025-2030 ($ million)
Data Table on Argentina - Market size and forecast 2025-2030 ($ million)
Chart on Argentina - Year-over-year growth 2025-2030 (%)
Data Table on Argentina - Year-over-year growth 2025-2030 (%)

12.7.3 Chile - Market size and forecast 2025-2030

Chart on Chile - Market size and forecast 2025-2030 ($ million)
Data Table on Chile - Market size and forecast 2025-2030 ($ million)
Chart on Chile - Year-over-year growth 2025-2030 (%)
Data Table on Chile - Year-over-year growth 2025-2030 (%)

12.8 Market opportunity by geography

Market opportunity by geography ($ million)
Data Tables on Market opportunity by geography ($ million)

13. Drivers, Challenges, and Opportunity

13.1 Market drivers

Multi-fuel and ammonia-ready marine engines
Widespread adoption of hybrid-electric propulsion systems
AI and digital twins for predictive maintenance

13.2 Market challenges

Severe financial and regulatory burden of marine decarbonization
Engineering complexities in alternative fuel engine integration
Supply chain vulnerabilities and bunkering infrastructure deficiencies

13.3 Impact of drivers and challenges

Impact of drivers and challenges in 2025 and 2030

13.4 Market opportunities

Modular engine architectures for future-proof retrofitting
Shift to condition-based maintenance through remote diagnostics
Engineering propulsion systems for autonomous vessels

14. Competitive Landscape

14.1 Overview

14.2

Overview on criticality of inputs and factors of differentiation

14.3 Landscape disruption

Overview on factors of disruption

14.4 Industry risks

Impact of key risks on business

15. Competitive Analysis

15.1 Companies profiled

Companies covered

15.2 Company ranking index

15.3 Market positioning of companies

Matrix on companies position and classification

15.4 Caterpillar Inc.

Caterpillar Inc. - Overview
Caterpillar Inc. - Business segments
Caterpillar Inc. - Key offerings
Caterpillar Inc. - Segment focus
SWOT

15.5 Cummins Inc.

Cummins Inc. - Overview
Cummins Inc. - Business segments
Cummins Inc. - Key news
Cummins Inc. - Key offerings
Cummins Inc. - Segment focus
SWOT

15.6 Deere and Co.

Deere and Co. - Overview
Deere and Co. - Business segments
Deere and Co. - Key offerings
Deere and Co. - Segment focus
SWOT

15.7 DEUTZ AG

DEUTZ AG - Overview
DEUTZ AG - Business segments
DEUTZ AG - Key offerings
DEUTZ AG - Segment focus
SWOT

15.8 General Electric Co.

General Electric Co. - Overview
General Electric Co. - Business segments
General Electric Co. - Key offerings
General Electric Co. - Segment focus
SWOT

15.9 IHI Corp.

IHI Corp. - Overview
IHI Corp. - Business segments
IHI Corp. - Key offerings
IHI Corp. - Segment focus
SWOT

15.10 KOHLER Co.

KOHLER Co. - Overview
KOHLER Co. - Product / Service
KOHLER Co. - Key offerings
SWOT

15.11 Liebherr International AG

Liebherr International AG - Overview
Liebherr International AG - Product / Service
Liebherr International AG - Key offerings
SWOT

15.12 MAN Energy Solutions SE

MAN Energy Solutions SE - Overview
MAN Energy Solutions SE - Product / Service
MAN Energy Solutions SE - Key offerings
SWOT

15.13 Mercury Marine.

Mercury Marine. - Overview
Mercury Marine. - Product / Service
Mercury Marine. - Key offerings
SWOT

15.14 Mitsubishi Heavy Industries

Mitsubishi Heavy Industries - Overview
Mitsubishi Heavy Industries - Business segments
Mitsubishi Heavy Industries - Key news
Mitsubishi Heavy Industries - Key offerings
Mitsubishi Heavy Industries - Segment focus
SWOT

15.15 Volvo Penta AB

Volvo Penta AB - Overview
Volvo Penta AB - Product / Service
Volvo Penta AB - Key offerings
SWOT

15.16 Wartsila Corp.

Wartsila Corp. - Overview
Wartsila Corp. - Business segments
Wartsila Corp. - Key news
Wartsila Corp. - Key offerings
Wartsila Corp. - Segment focus
SWOT

15.17 WeiChai Holding Group Co. Ltd.

WeiChai Holding Group Co. Ltd. - Overview
WeiChai Holding Group Co. Ltd. - Product / Service
WeiChai Holding Group Co. Ltd. - Key offerings
SWOT

15.18 Yanmar Holdings Co. Ltd.

Yanmar Holdings Co. Ltd. - Overview
Yanmar Holdings Co. Ltd. - Product / Service
Yanmar Holdings Co. Ltd. - Key offerings
SWOT

16. Appendix

16.1 Scope of the report

Market definition
Objectives
Notes and caveats

16.2 Inclusions and exclusions checklist

Inclusions checklist
Exclusions checklist

16.3 Currency conversion rates for US$

16.4 Research methodology

16.5 Data procurement

Information sources

16.6 Data validation

16.7 Validation techniques employed for market sizing

16.8 Data synthesis

16.9 360 degree market analysis

16.10 List of abbreviations

Research Methodology

Technavio presents a detailed picture of the market by way of study, synthesis, and summation of data from multiple sources. The analysts have presented the various facets of the market with a particular focus on identifying the key industry influencers. The data thus presented is comprehensive, reliable, and the result of extensive research, both primary and secondary.

INFORMATION SOURCES

Primary sources

  • Manufacturers and suppliers
  • Channel partners
  • Industry experts
  • Strategic decision makers

Secondary sources

  • Industry journals and periodicals
  • Government data
  • Financial reports of key industry players
  • Historical data
  • Press releases

DATA ANALYSIS

Data Synthesis

  • Collation of data
  • Estimation of key figures
  • Analysis of derived insights

Data Validation

  • Triangulation with data models
  • Reference against proprietary databases
  • Corroboration with industry experts

REPORT WRITING

Qualitative

  • Market drivers
  • Market challenges
  • Market trends
  • Five forces analysis

Quantitative

  • Market size and forecast
  • Market segmentation
  • Geographical insights
  • Competitive landscape

Interested in this report?

Get your sample now to see our research methodology and insights!

Download Now

Frequently Asked Questions

Marine Propulsion Engine market growth will increase by USD 1340.4 million during 2026-2030.

The Marine Propulsion Engine market is expected to grow at a CAGR of 3.2% during 2026-2030.

Marine Propulsion Engine market is segmented by Application (Passenger, Commercial, Defense) Type (Diesel, Gas) Fuel type (Marine diesel, Heavy fuel oil, Liquefied natural gas, Methanol)

Anglo Belgian Corp., Caterpillar Inc., Cummins Inc., Deere and Co., DEUTZ AG, General Electric Co., IHI Corp., KOHLER Co., Liebherr International AG, MAN Energy Solutions SE, Mercury Marine., Mitsubishi Heavy Industries, Rolls Royce Power Systems AG, Scania AB, Volvo Penta AB, Wartsila Corp., WeiChai Holding Group Co. Ltd., Yanmar Holdings Co. Ltd. are a few of the key vendors in the Marine Propulsion Engine market.

APAC will register the highest growth rate of 57.2% among the other regions. Therefore, the Marine Propulsion Engine market in APAC is expected to garner significant business opportunities for the vendors during the forecast period.

China, Japan, India, South Korea, Australia, Indonesia, Germany, UK, France, Italy, Spain, The Netherlands, US, Canada, Mexico, Saudi Arabia, UAE, South Africa, Israel, Turkey, Brazil, Argentina, Chile

  • Multi-fuel and ammonia-ready marine engines is the driving factor this market.

The Marine Propulsion Engine market vendors should focus on grabbing business opportunities from the Application segment as it accounted for the largest market share in the base year.
RIA - Research AI Assistant
Ask RIA
