Medical Dynamometer Market Size 2025-2029
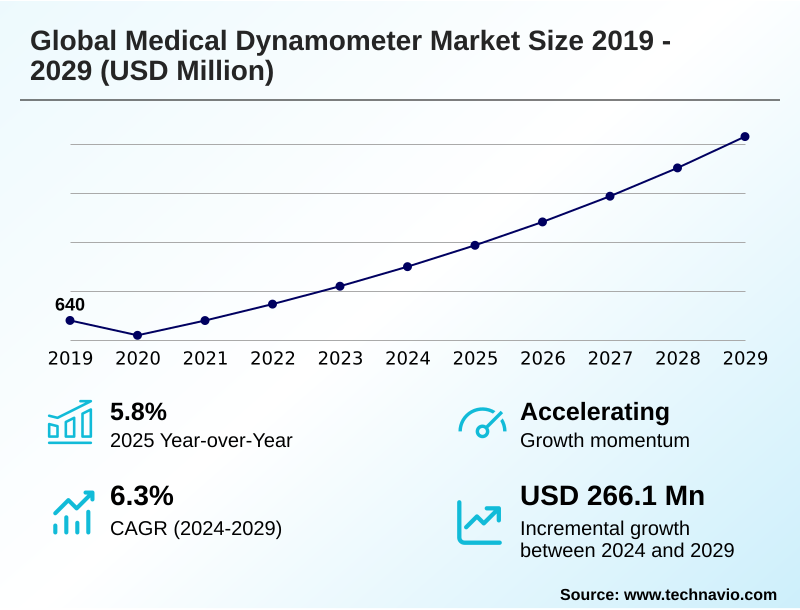
The medical dynamometer market size is valued to increase by USD 266.1 million, at a CAGR of 6.3% from 2024 to 2029. Rising incidence of musculoskeletal and neurological disorders will drive the medical dynamometer market.
Major Market Trends & Insights
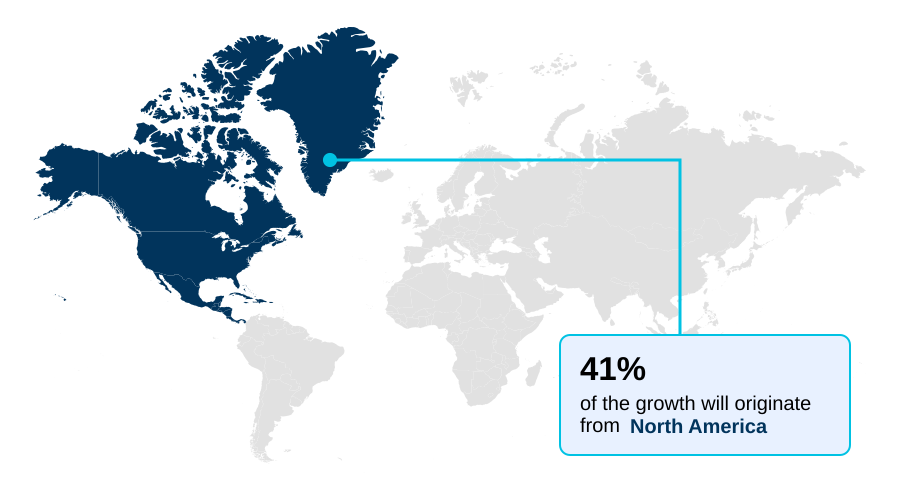
- North America dominated the market and accounted for a 41.3% growth during the forecast period.
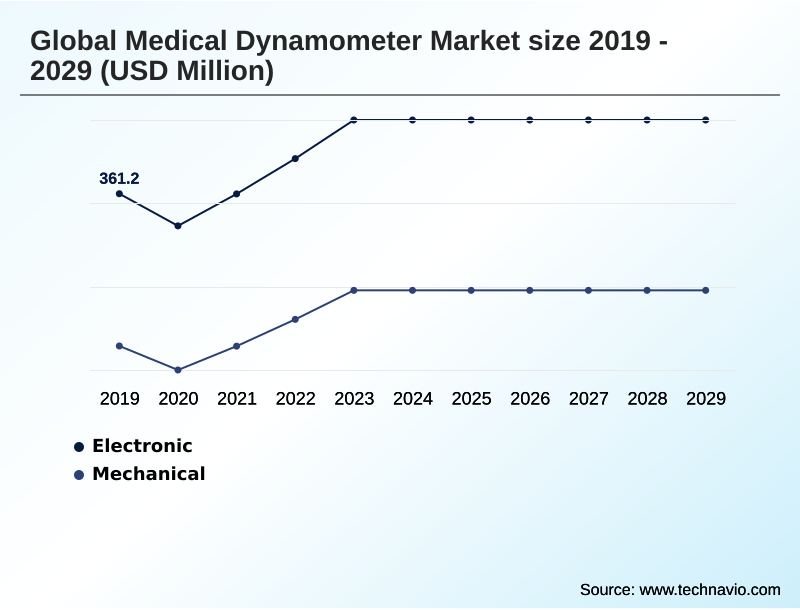
- By Type - Electronic segment was valued at USD 401.1 million in 2023
- By Product - Hand dynamometer segment accounted for the largest market revenue share in 2023
Market Size & Forecast
- Market Opportunities: USD 376.1 million
- Market Future Opportunities: USD 266.1 million
- CAGR from 2024 to 2029 : 6.3%
Market Summary
What will be the Size of the Medical Dynamometer Market during the forecast period?
Get Key Insights on Market Forecast (PDF) Get Free Sample
How is the Medical Dynamometer Market Segmented?
The medical dynamometer industry research report provides comprehensive data (region-wise segment analysis), with forecasts and estimates in "USD million" for the period 2025-2029, as well as historical data from 2019-2023 for the following segments.
- Type
- Electronic
- Mechanical
- Product
- Hand dynamometer
- Push-pull dynamometer
- Pinch gauge
- Application
- Orthopedic
- Neurology
- Medical trauma
- Geography
- North America
- US
- Canada
- Mexico
- Europe
- Germany
- UK
- France
- Asia
- Rest of World (ROW)
- North America
By Type Insights
The electronic segment is estimated to witness significant growth during the forecast period.
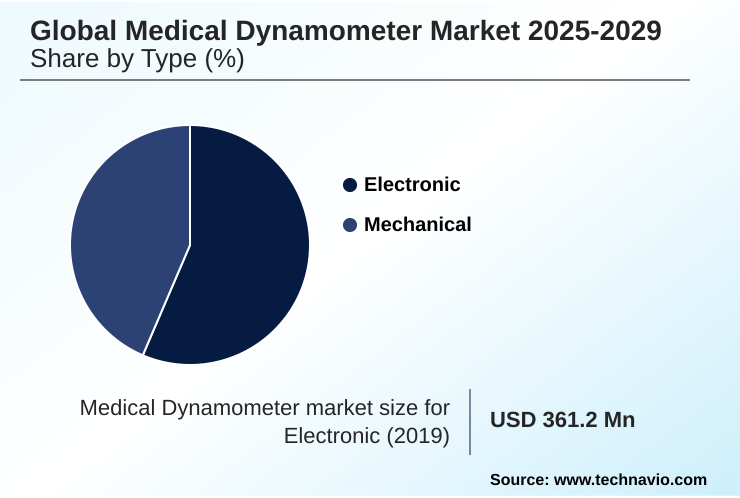
The Electronic segment was valued at USD 401.1 million in 2023 and showed a gradual increase during the forecast period.
Regional Analysis
North America is estimated to contribute 41.3% to the growth of the global market during the forecast period.Technavio’s analysts have elaborately explained the regional trends and drivers that shape the market during the forecast period.
See How Medical Dynamometer Market Demand is Rising in North America Get Free Sample
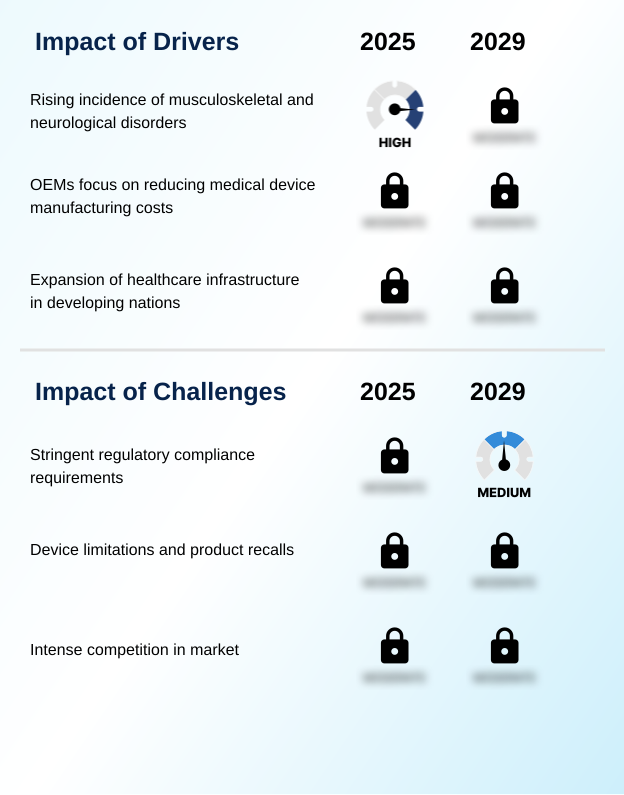
Market Dynamics
Our researchers analyzed the data with 2024 as the base year, along with the key drivers, trends, and challenges. A holistic analysis of drivers will help companies refine their marketing strategies to gain a competitive advantage.
What are the key market drivers leading to the rise in the adoption of Medical Dynamometer Industry?
What are the market trends shaping the Medical Dynamometer Industry?
What challenges does the Medical Dynamometer Industry face during its growth?
Exclusive Technavio Analysis on Customer Landscape
The medical dynamometer market forecasting report includes the adoption lifecycle of the market, covering from the innovator’s stage to the laggard’s stage. It focuses on adoption rates in different regions based on penetration. Furthermore, the medical dynamometer market report also includes key purchase criteria and drivers of price sensitivity to help companies evaluate and develop their market growth analysis strategies.

Customer Landscape of Medical Dynamometer Industry
Competitive Landscape
Companies are implementing various strategies, such as strategic alliances, medical dynamometer market forecast, partnerships, mergers and acquisitions, geographical expansion, and product/service launches, to enhance their presence in the industry.
3B Scientific GmbH -
The industry research and growth report includes detailed analyses of the competitive landscape of the market and information about key companies, including:
- 3B Scientific GmbH
- Alimed Inc.
- Bharat Medical Systems
- BTE Technologies
- Charder Electronic Co. Ltd.
- Electro Medical Inc.
- Fabrication Enterprises Inc.
- Hoggan Scientific LLC.
- JLW Instruments
- JOHNSON SCALE CO. INC.
- JTECH MEDICAL INDUSTRIES INC.
- KERN and SOHN GmbH
- Lafayette Instrument Co.
- Mark 10 Corp.
- Marsden International Legal Search Ltd.
- MICROTEKNIK
- North Coast Medical Inc.
- STERIKARE
Qualitative and quantitative analysis of companies has been conducted to help clients understand the wider business environment as well as the strengths and weaknesses of key industry players. Data is qualitatively analyzed to categorize companies as pure play, category-focused, industry-focused, and diversified; it is quantitatively analyzed to categorize companies as dominant, leading, strong, tentative, and weak.
Recent Development and News in Medical dynamometer market
Dive into Technavio’s robust research methodology, blending expert interviews, extensive data synthesis, and validated models for unparalleled Medical Dynamometer Market insights. See full methodology.
| Market Scope | |
|---|---|
| Page number | 278 |
| Base year | 2024 |
| Historic period | 2019-2023 |
| Forecast period | 2025-2029 |
| Growth momentum & CAGR | Accelerate at a CAGR of 6.3% |
| Market growth 2025-2029 | USD 266.1 million |
| Market structure | Fragmented |
| YoY growth 2024-2025(%) | 5.8% |
| Key countries | US, Canada, Mexico, Germany, UK, France, Italy, Spain, The Netherlands, China, India, Japan, South Korea, Thailand, Indonesia, Brazil, Saudi Arabia, UAE, Turkey, Argentina, Colombia, South Africa and Israel |
| Competitive landscape | Leading Companies, Market Positioning of Companies, Competitive Strategies, and Industry Risks |
Research Analyst Overview
What are the Key Data Covered in this Medical Dynamometer Market Research and Growth Report?
-
What is the expected growth of the Medical Dynamometer Market between 2025 and 2029?
-
USD 266.1 million, at a CAGR of 6.3%
-
-
What segmentation does the market report cover?
-
The report is segmented by Type (Electronic, and Mechanical), Product (Hand dynamometer, Push-pull dynamometer, and Pinch gauge), Application (Orthopedic, Neurology, and Medical trauma) and Geography (North America, Europe, Asia, Rest of World (ROW))
-
-
Which regions are analyzed in the report?
-
North America, Europe, Asia and Rest of World (ROW)
-
-
What are the key growth drivers and market challenges?
-
Rising incidence of musculoskeletal and neurological disorders, Stringent regulatory compliance requirements
-
-
Who are the major players in the Medical Dynamometer Market?
-
3B Scientific GmbH, Alimed Inc., Bharat Medical Systems, BTE Technologies, Charder Electronic Co. Ltd., Electro Medical Inc., Fabrication Enterprises Inc., Hoggan Scientific LLC., JLW Instruments, JOHNSON SCALE CO. INC., JTECH MEDICAL INDUSTRIES INC., KERN and SOHN GmbH, Lafayette Instrument Co., Mark 10 Corp., Marsden International Legal Search Ltd., MICROTEKNIK, North Coast Medical Inc. and STERIKARE
-
Market Research Insights
We can help! Our analysts can customize this medical dynamometer market research report to meet your requirements.
 RIA -
RIA - 
