MEP Solutions Market In Commercial Construction Analysis APAC, North America, Europe, Middle East and Africa, South America - US, China, India, Japan, Germany, UK, Canada, Australia, France, Brazil - Size and Forecast 2024-2028

MEP Solutions Market In Commercial Construction Analysis APAC, North America, Europe, Middle East and Africa, South America - US, China, India, Japan, Germany, UK, Canada, Australia, France, Brazil - Size and Forecast 2024-2028

Published: Nov 2024 207 Pages SKU: IRTNTR80351

Market Overview at a Glance

$31.89 B
Market Opportunity
12.4%
CAGR
11.6
YoY growth 2023-2024(%)

MEP Solutions Market In Commercial Construction Size 2024-2028

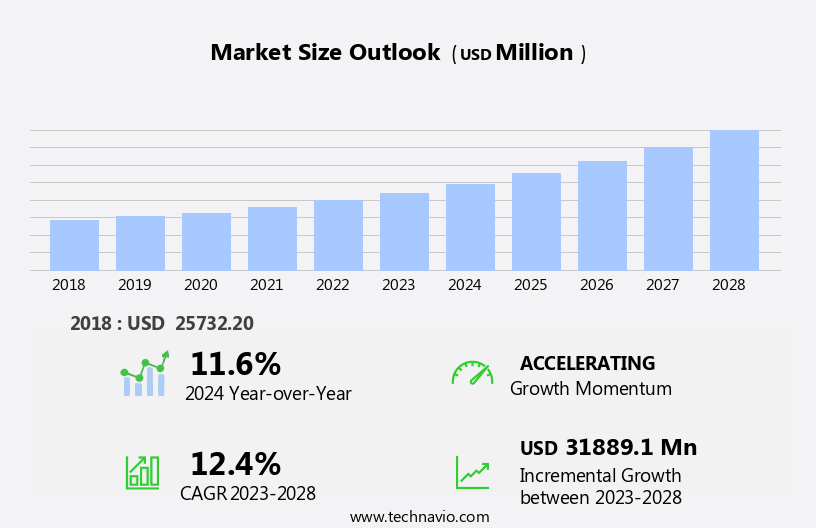
The mep solutions market in commercial construction size is forecast to increase by USD 31.89 billion at a CAGR of 12.4% between 2023 and 2028.

  • The market is experiencing significant growth due to various trends and factors. One of the primary drivers is the increasing infrastructure investments In the US and North America, leading to a surge in construction projects. Another key trend is strategic collaborations among industry players to enhance their product offerings and expand their customer base. However, budget constraints continue to pose a challenge for construction firms, necessitating the adoption of cost-effective MEP solutions. These trends and growth factors are shaping the future of the market, offering opportunities for innovation and growth.
  • What will be the Size of the MEP Solutions Market In Commercial Construction During the Forecast Period?

    MEP Solutions Market In Commercial Construction Size

     Request Free Sample

  • The MEP (Mechanical, Electrical, and Plumbing) solutions market in commercial construction is experiencing significant growth due to the increasing prioritization of smart city development and sustainable infrastructure. Building automation systems are becoming essential components of green building design, enabling energy efficiency standards, building performance optimization, and smart grid technologies. LEED certification and sustainable building materials are driving the market, with a focus on reducing carbon footprints and improving building code compliance. Smart city policy and urban planning & design are key factors, with an emphasis on smart city mobility, security, governance, and innovation. Smart city technology integration, including building data analytics, is crucial for optimizing building operations and maintenance.
  • Plumbing services and building management systems are essential for ensuring building performance and sustainability. Electrical services, smart building solutions, and building energy modeling are essential for implementing building energy management and commissioning. Building security systems are vital for ensuring safety and compliance with building operations optimization. The future of commercial construction lies In the integration of smart city infrastructure, green building design, and advanced technologies, creating a smart city ecosystem that prioritizes sustainability, efficiency, and innovation.
  • How is this MEP Solutions In Commercial Construction Industry segmented and which is the largest segment?

    The mep solutions in commercial construction industry research report provides comprehensive data (region-wise segment analysis), with forecasts and estimates in "USD million" for the period 2024-2028, as well as historical data from 2018-2022 for the following segments.

    • End-user
      • Office spaces
      • Hotels and malls
      • Hospitals and clinics
      • Others
    • Service
      • Consulting and engineering
      • Maintenance and support
      • System integration
    • Geography
      • APAC
        • China
        • India
        • Japan
      • North America
        • Canada
        • US
      • Europe
        • Germany
        • UK
        • France
      • Middle East and Africa
        • South America
          • Brazil

      By End-user Insights

      • The office spaces segment is estimated to witness significant growth during the forecast period.

      The Indian commercial construction sector is witnessing a surge in demand for Mechanical, Electrical, and Plumbing (MEP) solutions due to the expanding office market and urbanization. With an estimated requirement of approximately 1.7 billion square feet of office space to accommodate the growing workforce and business activities, advanced MEP systems are essential for creating flexible and adaptable office solutions. Urbanization is driving infrastructure development, leading to the creation of new urban centers and the expansion of existing ones. Economic growth further fuels this demand as businesses expand and new enterprises emerge, necessitating advanced MEP systems for office infrastructure. Smart City projects and regulatory standards are influencing the adoption of technologically advanced MEP systems, including Advanced Control Systems, IoT, and Smart Technologies.

      These systems offer energy efficiency, water efficiency, and improved indoor environments, aligning with sustainability and compliance requirements. Traditional systems are being retrofitted with these technologies to reduce operational costs and enhance building performance. MEP services are also essential for residential buildings, ensuring water supply, drainage, and indoor comfort. Infrastructure development for commercial construction projects requires MEP solutions for power distribution, electrical wiring, and electrical services. Renewable energy sources, such as solar panels, are increasingly being integrated into commercial buildings for energy efficiency and reduced carbon footprints. HVAC systems, Building Information Modeling, and Automated HVAC Systems are crucial components of modern office infrastructure, ensuring occupant comfort and operational cost savings.

      Water supply and drainage systems are essential for commercial infrastructure development, ensuring water efficiency and improved indoor environments. Air quality and plumbing systems are also critical components of MEP solutions, ensuring the health and well-being of building occupants. With the increasing focus on sustainable building practices, MEP solutions are becoming an integral part of infrastructure development, reducing operational costs and enhancing building performance.

      MEP Solutions Market In Commercial Construction Size

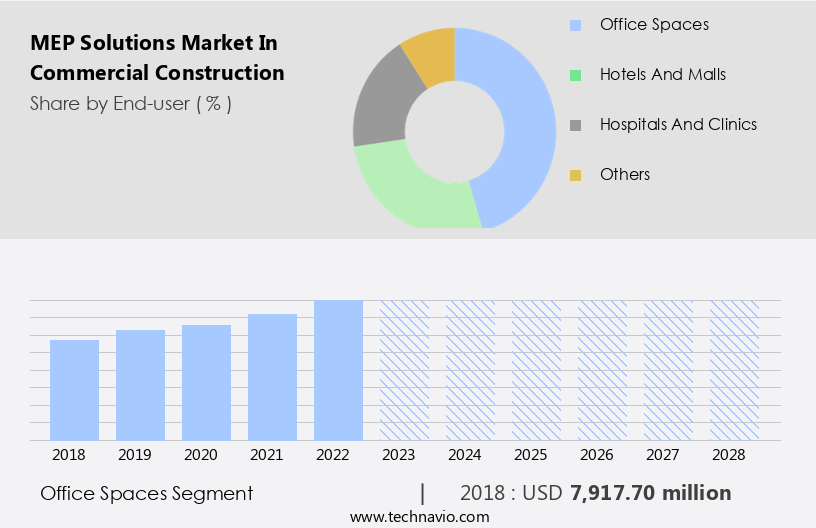
      Get a glance at the  MEP Solutions In Commercial Construction Industry report of share of various segments Request Free Sample

      The Office spaces segment was valued at USD 7.92 billion in 2018 and showed a gradual increase during the forecast period.

      Regional Analysis

      • APAC is estimated to contribute 37% to the growth of the global market during the forecast period.

      Technavio’s analysts have elaborately explained the regional trends and drivers that shape the market during the forecast period.

      MEP Solutions Market In Commercial Construction Share by Geography

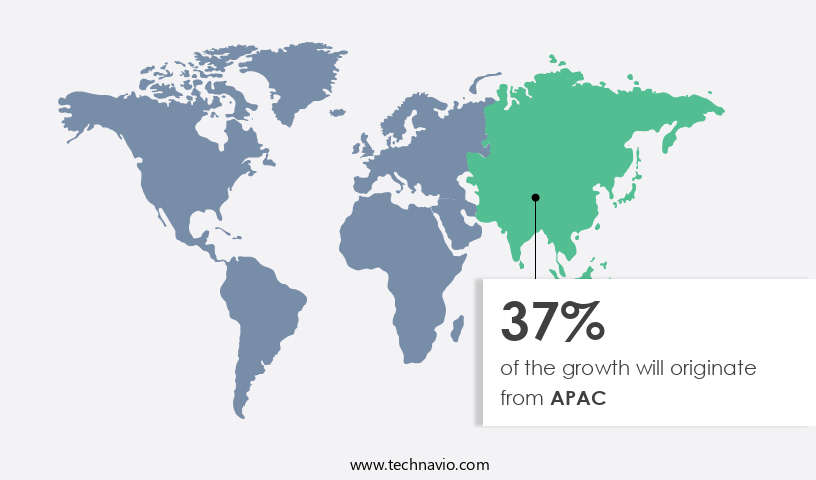
      For more insights on the market share of various regions, Request Free Sample

      The Asia Pacific region is experiencing substantial growth In the MEP solutions market for commercial construction, primarily due to escalating infrastructure investments. Notably, India's infrastructure spending is projected to reach approximately USD1.69 trillion between 2024 and 2030, representing a significant increase from the USD842.66 billion allocated during the 2017-2023 period. This growth can be attributed to various government initiatives aimed at modernizing urban infrastructure, expanding transportation networks, and developing sustainable energy projects. The Indian government's focus on smart cities, public transportation systems, and renewable energy solutions is driving demand for advanced MEP systems, including smart HVAC systems, lighting controls, and advanced plumbing and drainage solutions.

      These systems contribute to improved indoor environments, energy efficiency, and water efficiency, all crucial factors in sustainable building practices and reducing carbon footprints. Urbanization and infrastructure development In the region are also increasing the demand for MEP services, particularly in commercial buildings, office complexes, and high-rise structures. The integration of IoT, smart technologies, and Building Information Modeling (BIM) further enhances the performance and operational costs of these systems.

      Market Dynamics

      Our  researchers analyzed the data with 2023 as the base year, along with the key drivers, trends, and challenges. A holistic analysis of drivers will help companies refine their marketing strategies to gain a competitive advantage.

      What are the key market drivers leading to the rise In the adoption of MEP Solutions In Commercial Construction Industry?

      Rising infrastructure investments is the key driver of the market.

    • The market is experiencing significant growth In the US, driven by increased investments in infrastructure and a focus on sustainability and energy efficiency. Smart City Projects are leading the way, integrating Internet of Things (IoT) technologies and Advanced Control Systems to optimize Building Performance. Regulatory Standards, such as Building Codes and Compliance Requirements, are pushing the adoption of Green Technologies and Smart Technologies, including water conservation, renewable energy sources, and Automated HVAC Systems. Traditional Systems, like electrical wiring and distribution, are being replaced with more technologically advanced solutions, such as energy-efficient lighting controls and solar panels. Infrastructure Development projects, including commercial mechanical installations and high-rise buildings, are prioritizing Sustainable Building Practices and Water Efficiency to reduce Operational Costs and Carbon Footprints.
    • Real-time monitoring and maintenance cost savings are also driving the demand for MEP services in retrofitting projects for residential complexes and office buildings. The market is expected to continue growing, as Urbanization and Rapid Urbanization necessitate the need for advanced Mechanical Services and innovative practices in plumbing, drainage, air conditioning, and heating systems.
    • What are the market trends shaping the MEP Solutions In Commercial Construction Industry?

      Strategic collaborations is the upcoming market trend.

    • The market is experiencing significant growth due to the integration of smart technologies and green practices. In the realm of urban infrastructure development, smart cities are leading the charge with the implementation of IoT-enabled Advanced Control Systems. These systems optimize energy efficiency, water supply, and drainage in commercial buildings, resulting in substantial operational cost savings and reduced carbon footprints. Compliance with regulatory standards, such as Building Codes and Sustainability Practices, is driving the demand for technologically advanced MEP services. Traditional systems, including HVAC, plumbing, electrical wiring, and distribution, are being replaced with smart, automated alternatives, such as Automated HVAC Systems and Lighting Controls.
    • These innovations enhance indoor comfort, improve building performance, and ensure water efficiency in commercial buildings. MEP services are also essential in retrofitting projects, ensuring the integration of renewable energy sources, such as solar panels and refrigeration systems, into existing infrastructure. The market is further fueled by the increasing focus on sustainable building practices and the need for real-time monitoring and maintenance cost reduction in construction projects. In summary, the market is witnessing a paradigm shift towards smart, sustainable, and energy-efficient solutions, driven by regulatory requirements, urbanization, and technological advancements.
    • What challenges does the MEP Solutions In Commercial Construction Industry face during its growth?

      Budget constraints is a key challenge affecting the industry growth.

    • In the commercial construction sector, the MEP solutions market faces the challenge of managing budget constraints while ensuring compliance with regulatory standards and delivering advanced infrastructure. Engineers must balance initial capital expenditures against long-term operational and maintenance costs, considering the potential savings from energy-efficient technologies, sustainable design, and innovative construction methods. Collaboration with the project team, including cost estimators and procurement specialists, is crucial for identifying cost-effective solutions that maintain quality and performance. Smart Technologies and IoT play a significant role in this context, with advanced control systems for HVAC, lighting, and plumbing enabling real-time monitoring and maintenance cost reduction.
    • Green Technologies, such as renewable energy sources and water efficiency, contribute to sustainability and compliance with building codes. Infrastructure Development in urban areas necessitates the implementation of smart building solutions, including automated HVAC systems and Building Information Modeling, to optimize energy efficiency and indoor comfort. Compliance Requirements and Regulatory Standards, including those related to water supply, drainage, and air quality, must be met to ensure occupant safety and health. Traditional Systems, such as electrical wiring and distribution, require upgrades for energy efficiency and compatibility with smart technologies. Sustainability is a key focus, with an increasing emphasis on reducing carbon footprints and promoting sustainable building practices.
    • MEP services, including heating, ventilation, air conditioning, and electrical services, are essential for maintaining optimal indoor environments and ensuring operational cost efficiency. Technological advancements In these areas, such as advanced control systems and automation, contribute to improved building performance and reduced maintenance costs. In conclusion, the market faces a complex set of challenges, requiring a balance between initial capital expenditures, long-term operational costs, and regulatory compliance. The integration of smart technologies, green technologies, and sustainable practices is essential for meeting these challenges and creating high-performing, cost-effective, and sustainable commercial buildings.
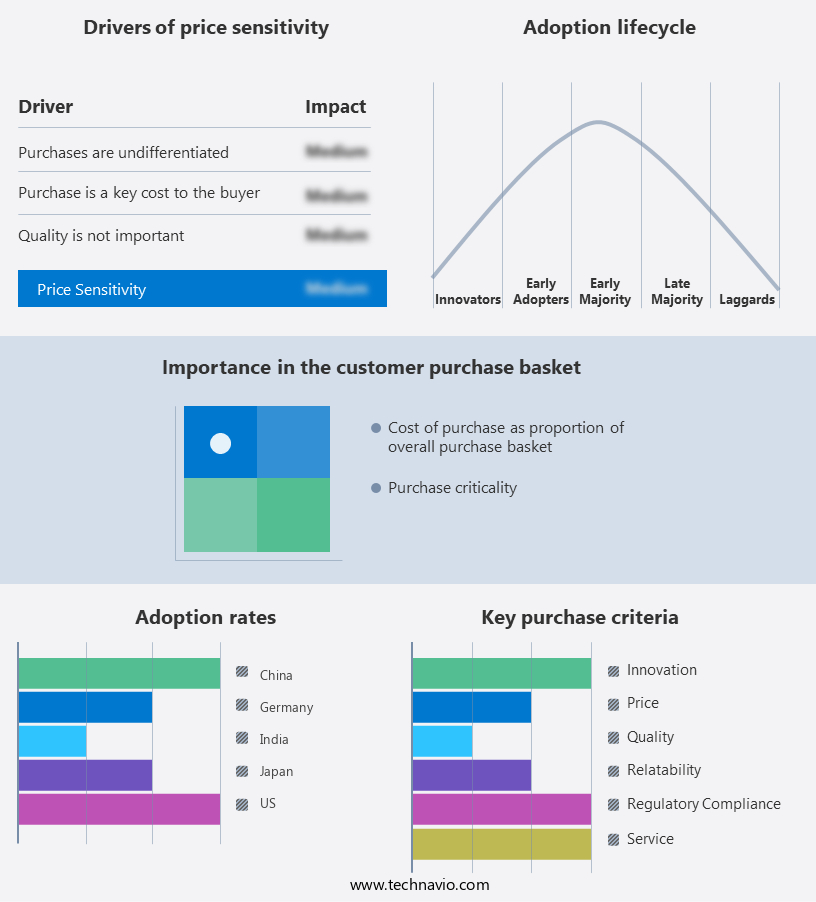
    • Exclusive Customer Landscape

      The mep solutions market in commercial construction forecasting report includes the adoption lifecycle of the market, covering from the innovator’s stage to the laggard’s stage. It focuses on adoption rates in different regions based on penetration. Furthermore, the mep solutions market in commercial construction report also includes key purchase criteria and drivers of price sensitivity to help companies evaluate and develop their market growth analysis strategies.

      MEP Solutions Market In Commercial Construction Share by Geography

       Customer Landscape

      Key Companies & Market Insights

      Companies are implementing various strategies, such as strategic alliances, mep solutions market in commercial construction forecast, partnerships, mergers and acquisitions, geographical expansion, and product/service launches, to enhance their presence In the industry.

      Affiliated Engineers Inc. - MEP (Mechanical, Electrical, and Plumbing) solutions encompass design, consultancy, and project management services. By integrating these disciplines, the company optimizes building performance and efficiency. This comprehensive approach ensures effective energy management, improved indoor air quality, and enhanced safety and security systems. The result is a more sustainable and productive commercial construction project.

      The industry research and growth report includes detailed analyses of the competitive landscape of the market and information about key companies, including:

      • Affiliated Engineers Inc.
      • AECOM
      • Burns and McDonnell
      • Buro Happold
      • DRAKE and SCULL
      • EMCOR Group Inc.
      • Epsten Group
      • GDI Integrated Facility Services
      • Global Facility Solutions LLC
      • HDR Inc.
      • Jensen Hughes
      • MEP Engineering Inc.
      • Pinnacle Infotech Inc
      • Resolute Engineering
      • Royal Engineering Inc
      • SWJ ENGINEERING GmbH
      • Tetra Tech Inc.
      • Total Facility Solutions
      • WSP Global Inc.
      • XS CAD Ltd.

      Qualitative and quantitative analysis of companies has been conducted to help clients understand the wider business environment as well as the strengths and weaknesses of key industry players. Data is qualitatively analyzed to categorize companies as pure play, category-focused, industry-focused, and diversified; it is quantitatively analyzed to categorize companies as dominant, leading, strong, tentative, and weak.

      Research Analyst Overview

      The MEP (Mechanical, Electrical, and Plumbing) solutions market in commercial construction continues to evolve, driven by the demand for advanced control systems and sustainable practices. This sector is witnessing significant growth as urbanization and infrastructure development accelerate. MEP systems play a crucial role in ensuring building performance and occupant comfort. Traditional systems are being replaced with smart technologies that offer real-time monitoring, maintenance cost savings, and energy efficiency. The integration of IoT (Internet of Things) and BMS (Building Management Systems) is enabling automated HVAC (Heating, Ventilation, and Air Conditioning) systems and lighting controls. The push for sustainability and compliance with regulatory standards is another major factor driving the MEP market.

      Renewable energy sources, such as solar panels, are increasingly being integrated into commercial buildings to reduce carbon emissions and improve water efficiency. Green technologies, including water supply systems and drainage solutions, are also gaining popularity. The MEP sector is undergoing a transformation, with technological advancements leading the way. Innovative practices in plumbing, heating, and electrical services are improving indoor environments and reducing operational costs. Advanced control systems are enabling better indoor comfort and air quality, while smart technologies are enhancing building performance and operational efficiency. The construction industry is embracing smart building solutions to meet the demands of urban living.

      The use of Building Information Modeling (BIM) is becoming more widespread, enabling better infrastructure development and facilitating the retrofitting of existing buildings. High-rise buildings and office complexes are leading the charge In the adoption of technologically advanced MEP systems. The MEP market is also being shaped by the need for compliance with various regulations and building codes. Regulatory standards are being tightened to ensure the safety and sustainability of commercial buildings. This is leading to increased demand for MEP services during the construction process and for ongoing maintenance and repair. In conclusion, the market is undergoing a significant transformation, driven by the demand for advanced control systems, sustainability, and regulatory compliance.

      The integration of smart technologies, such as IoT and BMS, is enabling better building performance, indoor comfort, and operational efficiency. The construction industry is embracing these trends to meet the demands of urbanization and to create sustainable, technologically advanced buildings that meet the needs of modern businesses and their occupants.

      Market Scope

      Report Coverage

      Details

      Page number

      207

      Base year

      2023

      Historic period

      2018-2022

      Forecast period

      2024-2028

      Growth momentum & CAGR

      Accelerate at a CAGR of 12.4%

      Market growth 2024-2028

      USD 31889.1 million

      Market structure

      Fragmented

      YoY growth 2023-2024(%)

      11.6

      Key countries

      US, China, India, Japan, Germany, UK, Canada, Australia, France, and Brazil

      Competitive landscape

      Leading Companies, Market Positioning of Companies, Competitive Strategies, and Industry Risks

      Request Free Sample

      What are the Key Data Covered in this MEP Solutions Market In Commercial Construction Research and Growth Report?

      • CAGR of the MEP Solutions In Commercial Construction industry during the forecast period
      • Detailed information on factors that will drive the growth and forecasting between 2024 and 2028
      • Precise estimation of the size of the market and its contribution of the industry in focus to the parent market
      • Accurate predictions about upcoming growth and trends and changes in consumer behaviour
      • Growth of the market across APAC, North America, Europe, Middle East and Africa, and South America
      • Thorough analysis of the market’s competitive landscape and detailed information about companies
      • Comprehensive analysis of factors that will challenge the mep solutions market in commercial construction growth of industry companies

      We can help! Our analysts can customize this mep solutions market in commercial construction research report to meet your requirements.

      Get in touch


      1 Executive Summary

      • 1.1 Market overview
        • Executive Summary - Chart on Market Overview
        • Executive Summary - Data Table on Market Overview
        • Executive Summary - Chart on Global Market Characteristics
        • Executive Summary - Chart on Market by Geography
        • Executive Summary - Chart on Market Segmentation by End-user
        • Executive Summary - Chart on Market Segmentation by Service
        • Executive Summary - Chart on Incremental Growth
        • Executive Summary - Data Table on Incremental Growth
        • Executive Summary - Chart on Company Market Positioning

      2 Technavio Analysis

      • 2.1 Analysis of price sensitivity, lifecycle, customer purchase basket, adoption rates, and purchase criteria
        • Analysis of price sensitivity, lifecycle, customer purchase basket, adoption rates, and purchase criteria
      • 2.2 Criticality of inputs and Factors of differentiation
        • Overview on criticality of inputs and factors of differentiation
      • 2.3 Factors of disruption
        • Overview on factors of disruption
      • 2.4 Impact of drivers and challenges
        • Impact of drivers and challenges in 2023 and 2028

      3 Market Landscape

      • 3.1 Market ecosystem
        • Parent Market
        • Data Table on - Parent Market
      • 3.2 Market characteristics
        • Market characteristics analysis
      • 3.3 Value chain analysis
        • Value chain analysis

      4 Market Sizing

      • 4.1 Market definition
        • Offerings of companies included in the market definition
      • 4.2 Market segment analysis
        • Market segments
      • 4.3 Market size 2023
        • 4.4 Market outlook: Forecast for 2023-2028
          • Chart on Global - Market size and forecast 2023-2028 ($ million)
          • Data Table on Global - Market size and forecast 2023-2028 ($ million)
          • Chart on Global Market: Year-over-year growth 2023-2028 (%)
          • Data Table on Global Market: Year-over-year growth 2023-2028 (%)

        5 Historic Market Size

        • 5.1 Global MEP Solutions Market In Commercial Construction 2018 - 2022
          • Historic Market Size - Data Table on Global MEP Solutions Market In Commercial Construction 2018 - 2022 ($ million)
        • 5.2 End-user segment analysis 2018 - 2022
          • Historic Market Size - End-user Segment 2018 - 2022 ($ million)
        • 5.3 Service segment analysis 2018 - 2022
          • Historic Market Size - Service Segment 2018 - 2022 ($ million)
        • 5.4 Geography segment analysis 2018 - 2022
          • Historic Market Size - Geography Segment 2018 - 2022 ($ million)
        • 5.5 Country segment analysis 2018 - 2022
          • Historic Market Size - Country Segment 2018 - 2022 ($ million)

        6 Qualitative Analysis

        • 6.1 Impact of AI on the Global MEP Solutions Market in Commercial Construction

          7 Five Forces Analysis

          • 7.1 Five forces summary
            • Five forces analysis - Comparison between 2023 and 2028
          • 7.2 Bargaining power of buyers
            • Bargaining power of buyers - Impact of key factors 2023 and 2028
          • 7.3 Bargaining power of suppliers
            • Bargaining power of suppliers - Impact of key factors in 2023 and 2028
          • 7.4 Threat of new entrants
            • Threat of new entrants - Impact of key factors in 2023 and 2028
          • 7.5 Threat of substitutes
            • Threat of substitutes - Impact of key factors in 2023 and 2028
          • 7.6 Threat of rivalry
            • Threat of rivalry - Impact of key factors in 2023 and 2028
          • 7.7 Market condition
            • Chart on Market condition - Five forces 2023 and 2028

          8 Market Segmentation by End-user

          • 8.1 Market segments
            • Chart on End-user - Market share 2023-2028 (%)
            • Data Table on End-user - Market share 2023-2028 (%)
          • 8.2 Comparison by End-user
            • Chart on Comparison by End-user
            • Data Table on Comparison by End-user
          • 8.3 Office spaces - Market size and forecast 2023-2028
            • Chart on Office spaces - Market size and forecast 2023-2028 ($ million)
            • Data Table on Office spaces - Market size and forecast 2023-2028 ($ million)
            • Chart on Office spaces - Year-over-year growth 2023-2028 (%)
            • Data Table on Office spaces - Year-over-year growth 2023-2028 (%)
          • 8.4 Hotels and malls - Market size and forecast 2023-2028
            • Chart on Hotels and malls - Market size and forecast 2023-2028 ($ million)
            • Data Table on Hotels and malls - Market size and forecast 2023-2028 ($ million)
            • Chart on Hotels and malls - Year-over-year growth 2023-2028 (%)
            • Data Table on Hotels and malls - Year-over-year growth 2023-2028 (%)
          • 8.5 Hospitals and clinics - Market size and forecast 2023-2028
            • Chart on Hospitals and clinics - Market size and forecast 2023-2028 ($ million)
            • Data Table on Hospitals and clinics - Market size and forecast 2023-2028 ($ million)
            • Chart on Hospitals and clinics - Year-over-year growth 2023-2028 (%)
            • Data Table on Hospitals and clinics - Year-over-year growth 2023-2028 (%)
          • 8.6 Others - Market size and forecast 2023-2028
            • Chart on Others - Market size and forecast 2023-2028 ($ million)
            • Data Table on Others - Market size and forecast 2023-2028 ($ million)
            • Chart on Others - Year-over-year growth 2023-2028 (%)
            • Data Table on Others - Year-over-year growth 2023-2028 (%)
          • 8.7 Market opportunity by End-user
            • Market opportunity by End-user ($ million)
            • Data Table on Market opportunity by End-user ($ million)

          9 Market Segmentation by Service

          • 9.1 Market segments
            • Chart on Service - Market share 2023-2028 (%)
            • Data Table on Service - Market share 2023-2028 (%)
          • 9.2 Comparison by Service
            • Chart on Comparison by Service
            • Data Table on Comparison by Service
          • 9.3 Consulting and engineering - Market size and forecast 2023-2028
            • Chart on Consulting and engineering - Market size and forecast 2023-2028 ($ million)
            • Data Table on Consulting and engineering - Market size and forecast 2023-2028 ($ million)
            • Chart on Consulting and engineering - Year-over-year growth 2023-2028 (%)
            • Data Table on Consulting and engineering - Year-over-year growth 2023-2028 (%)
          • 9.4 Maintenance and support - Market size and forecast 2023-2028
            • Chart on Maintenance and support - Market size and forecast 2023-2028 ($ million)
            • Data Table on Maintenance and support - Market size and forecast 2023-2028 ($ million)
            • Chart on Maintenance and support - Year-over-year growth 2023-2028 (%)
            • Data Table on Maintenance and support - Year-over-year growth 2023-2028 (%)
          • 9.5 System integration - Market size and forecast 2023-2028
            • Chart on System integration - Market size and forecast 2023-2028 ($ million)
            • Data Table on System integration - Market size and forecast 2023-2028 ($ million)
            • Chart on System integration - Year-over-year growth 2023-2028 (%)
            • Data Table on System integration - Year-over-year growth 2023-2028 (%)
          • 9.6 Market opportunity by Service
            • Market opportunity by Service ($ million)
            • Data Table on Market opportunity by Service ($ million)

          10 Customer Landscape

          • 10.1 Customer landscape overview
            • Analysis of price sensitivity, lifecycle, customer purchase basket, adoption rates, and purchase criteria

          11 Geographic Landscape

          • 11.1 Geographic segmentation
            • Chart on Market share by geography 2023-2028 (%)
            • Data Table on Market share by geography 2023-2028 (%)
          • 11.2 Geographic comparison
            • Chart on Geographic comparison
            • Data Table on Geographic comparison
          • 11.3 APAC - Market size and forecast 2023-2028
            • Chart on APAC - Market size and forecast 2023-2028 ($ million)
            • Data Table on APAC - Market size and forecast 2023-2028 ($ million)
            • Chart on APAC - Year-over-year growth 2023-2028 (%)
            • Data Table on APAC - Year-over-year growth 2023-2028 (%)
          • 11.4 North America - Market size and forecast 2023-2028
            • Chart on North America - Market size and forecast 2023-2028 ($ million)
            • Data Table on North America - Market size and forecast 2023-2028 ($ million)
            • Chart on North America - Year-over-year growth 2023-2028 (%)
            • Data Table on North America - Year-over-year growth 2023-2028 (%)
          • 11.5 Europe - Market size and forecast 2023-2028
            • Chart on Europe - Market size and forecast 2023-2028 ($ million)
            • Data Table on Europe - Market size and forecast 2023-2028 ($ million)
            • Chart on Europe - Year-over-year growth 2023-2028 (%)
            • Data Table on Europe - Year-over-year growth 2023-2028 (%)
          • 11.6 Middle East and Africa - Market size and forecast 2023-2028
            • Chart on Middle East and Africa - Market size and forecast 2023-2028 ($ million)
            • Data Table on Middle East and Africa - Market size and forecast 2023-2028 ($ million)
            • Chart on Middle East and Africa - Year-over-year growth 2023-2028 (%)
            • Data Table on Middle East and Africa - Year-over-year growth 2023-2028 (%)
          • 11.7 South America - Market size and forecast 2023-2028
            • Chart on South America - Market size and forecast 2023-2028 ($ million)
            • Data Table on South America - Market size and forecast 2023-2028 ($ million)
            • Chart on South America - Year-over-year growth 2023-2028 (%)
            • Data Table on South America - Year-over-year growth 2023-2028 (%)
          • 11.8 US - Market size and forecast 2023-2028
            • Chart on US - Market size and forecast 2023-2028 ($ million)
            • Data Table on US - Market size and forecast 2023-2028 ($ million)
            • Chart on US - Year-over-year growth 2023-2028 (%)
            • Data Table on US - Year-over-year growth 2023-2028 (%)
          • 11.9 China - Market size and forecast 2023-2028
            • Chart on China - Market size and forecast 2023-2028 ($ million)
            • Data Table on China - Market size and forecast 2023-2028 ($ million)
            • Chart on China - Year-over-year growth 2023-2028 (%)
            • Data Table on China - Year-over-year growth 2023-2028 (%)
          • 11.10 India - Market size and forecast 2023-2028
            • Chart on India - Market size and forecast 2023-2028 ($ million)
            • Data Table on India - Market size and forecast 2023-2028 ($ million)
            • Chart on India - Year-over-year growth 2023-2028 (%)
            • Data Table on India - Year-over-year growth 2023-2028 (%)
          • 11.11 Japan - Market size and forecast 2023-2028
            • Chart on Japan - Market size and forecast 2023-2028 ($ million)
            • Data Table on Japan - Market size and forecast 2023-2028 ($ million)
            • Chart on Japan - Year-over-year growth 2023-2028 (%)
            • Data Table on Japan - Year-over-year growth 2023-2028 (%)
          • 11.12 Germany - Market size and forecast 2023-2028
            • Chart on Germany - Market size and forecast 2023-2028 ($ million)
            • Data Table on Germany - Market size and forecast 2023-2028 ($ million)
            • Chart on Germany - Year-over-year growth 2023-2028 (%)
            • Data Table on Germany - Year-over-year growth 2023-2028 (%)
          • 11.13 UK - Market size and forecast 2023-2028
            • Chart on UK - Market size and forecast 2023-2028 ($ million)
            • Data Table on UK - Market size and forecast 2023-2028 ($ million)
            • Chart on UK - Year-over-year growth 2023-2028 (%)
            • Data Table on UK - Year-over-year growth 2023-2028 (%)
          • 11.14 Canada - Market size and forecast 2023-2028
            • Chart on Canada - Market size and forecast 2023-2028 ($ million)
            • Data Table on Canada - Market size and forecast 2023-2028 ($ million)
            • Chart on Canada - Year-over-year growth 2023-2028 (%)
            • Data Table on Canada - Year-over-year growth 2023-2028 (%)
          • 11.15 Australia - Market size and forecast 2023-2028
            • Chart on Australia - Market size and forecast 2023-2028 ($ million)
            • Data Table on Australia - Market size and forecast 2023-2028 ($ million)
            • Chart on Australia - Year-over-year growth 2023-2028 (%)
            • Data Table on Australia - Year-over-year growth 2023-2028 (%)
          • 11.16 France - Market size and forecast 2023-2028
            • Chart on France - Market size and forecast 2023-2028 ($ million)
            • Data Table on France - Market size and forecast 2023-2028 ($ million)
            • Chart on France - Year-over-year growth 2023-2028 (%)
            • Data Table on France - Year-over-year growth 2023-2028 (%)
          • 11.17 Brazil - Market size and forecast 2023-2028
            • Chart on Brazil - Market size and forecast 2023-2028 ($ million)
            • Data Table on Brazil - Market size and forecast 2023-2028 ($ million)
            • Chart on Brazil - Year-over-year growth 2023-2028 (%)
            • Data Table on Brazil - Year-over-year growth 2023-2028 (%)
          • 11.18 Market opportunity by geography
            • Market opportunity by geography ($ million)
            • Data Tables on Market opportunity by geography ($ million)

          12 Drivers, Challenges, and Opportunity/Restraints

          • 12.1 Market drivers
            • 12.2 Market challenges
              • 12.3 Impact of drivers and challenges
                • Impact of drivers and challenges in 2023 and 2028
              • 12.4 Market opportunities/restraints

                13 Competitive Landscape

                • 13.1 Overview
                  • 13.2 Competitive Landscape
                    • Overview on criticality of inputs and factors of differentiation
                  • 13.3 Landscape disruption
                    • Overview on factors of disruption
                  • 13.4 Industry risks
                    • Impact of key risks on business

                  14 Competitive Analysis

                  • 14.1 Companies profiled
                    • Companies covered
                  • 14.2 Company ranking index
                    • Company ranking index
                  • 14.3 Market positioning of companies
                    • Matrix on companies position and classification
                  • 14.4 AECOM
                    • AECOM - Overview
                    • AECOM - Business segments
                    • AECOM - Key news
                    • AECOM - Key offerings
                    • AECOM - Segment focus
                    • SWOT
                  • 14.5 Burns and McDonnell
                    • Burns and McDonnell - Overview
                    • Burns and McDonnell - Product / Service
                    • Burns and McDonnell - Key offerings
                    • SWOT
                  • 14.6 DRAKE and SCULL
                    • DRAKE and SCULL - Overview
                    • DRAKE and SCULL - Product / Service
                    • DRAKE and SCULL - Key offerings
                    • SWOT
                  • 14.7 EMCOR Group Inc.
                    • EMCOR Group Inc. - Overview
                    • EMCOR Group Inc. - Business segments
                    • EMCOR Group Inc. - Key offerings
                    • EMCOR Group Inc. - Segment focus
                    • SWOT
                  • 14.8 Epsten Group
                    • Epsten Group - Overview
                    • Epsten Group - Product / Service
                    • Epsten Group - Key offerings
                    • SWOT
                  • 14.9 GDI Integrated Facility Services
                    • GDI Integrated Facility Services - Overview
                    • GDI Integrated Facility Services - Product / Service
                    • GDI Integrated Facility Services - Key offerings
                    • SWOT
                  • 14.10 Global Facility Solutions LLC
                    • Global Facility Solutions LLC - Overview
                    • Global Facility Solutions LLC - Product / Service
                    • Global Facility Solutions LLC - Key offerings
                    • SWOT
                  • 14.11 HDR Inc.
                    • HDR Inc. - Overview
                    • HDR Inc. - Product / Service
                    • HDR Inc. - Key news
                    • HDR Inc. - Key offerings
                    • SWOT
                  • 14.12 Jensen Hughes
                    • Jensen Hughes - Overview
                    • Jensen Hughes - Product / Service
                    • Jensen Hughes - Key offerings
                    • SWOT
                  • 14.13 MEP Engineering Inc.
                    • MEP Engineering Inc. - Overview
                    • MEP Engineering Inc. - Product / Service
                    • MEP Engineering Inc. - Key offerings
                    • SWOT
                  • 14.14 Pinnacle Infotech Inc
                    • Pinnacle Infotech Inc - Overview
                    • Pinnacle Infotech Inc - Product / Service
                    • Pinnacle Infotech Inc - Key offerings
                    • SWOT
                  • 14.15 Resolute Engineering
                    • Resolute Engineering - Overview
                    • Resolute Engineering - Product / Service
                    • Resolute Engineering - Key offerings
                    • SWOT
                  • 14.16 Tetra Tech Inc.
                    • Tetra Tech Inc. - Overview
                    • Tetra Tech Inc. - Business segments
                    • Tetra Tech Inc. - Key offerings
                    • Tetra Tech Inc. - Segment focus
                    • SWOT
                  • 14.17 Total Facility Solutions
                    • Total Facility Solutions - Overview
                    • Total Facility Solutions - Product / Service
                    • Total Facility Solutions - Key offerings
                    • SWOT
                  • 14.18 WSP Global Inc.
                    • WSP Global Inc. - Overview
                    • WSP Global Inc. - Business segments
                    • WSP Global Inc. - Key offerings
                    • WSP Global Inc. - Segment focus
                    • SWOT

                  15 Appendix

                  • 15.1 Scope of the report
                    • 15.2 Inclusions and exclusions checklist
                      • Inclusions checklist
                      • Exclusions checklist
                    • 15.3 Currency conversion rates for US$
                      • Currency conversion rates for US$
                    • 15.4 Research methodology
                      • Research methodology
                    • 15.5 Data procurement
                      • Information sources
                    • 15.6 Data validation
                      • Data validation
                    • 15.7 Validation techniques employed for market sizing
                      • Validation techniques employed for market sizing
                    • 15.8 Data synthesis
                      • Data synthesis
                    • 15.9 360 degree market analysis
                      • 360 degree market analysis
                    • 15.10 List of abbreviations
                      • List of abbreviations

                    Research Methodology

                    Technavio presents a detailed picture of the market by way of study, synthesis, and summation of data from multiple sources. The analysts have presented the various facets of the market with a particular focus on identifying the key industry influencers. The data thus presented is comprehensive, reliable, and the result of extensive research, both primary and secondary.

                    INFORMATION SOURCES

                    Primary sources

                    • Manufacturers and suppliers
                    • Channel partners
                    • Industry experts
                    • Strategic decision makers

                    Secondary sources

                    • Industry journals and periodicals
                    • Government data
                    • Financial reports of key industry players
                    • Historical data
                    • Press releases

                    DATA ANALYSIS

                    Data Synthesis

                    • Collation of data
                    • Estimation of key figures
                    • Analysis of derived insights

                    Data Validation

                    • Triangulation with data models
                    • Reference against proprietary databases
                    • Corroboration with industry experts

                    REPORT WRITING

                    Qualitative

                    • Market drivers
                    • Market challenges
                    • Market trends
                    • Five forces analysis

                    Quantitative

                    • Market size and forecast
                    • Market segmentation
                    • Geographical insights
                    • Competitive landscape

                    Interested in this report?

                    Get your sample now to see our research methodology and insights!

                    Download Now

                    Frequently Asked Questions

                    MEP SolutionsIn Commercial Construction market growth will increase by $ 31889.1 mn during 2024-2028.

                    The MEP SolutionsIn Commercial Construction market is expected to grow at a CAGR of 12.4% during 2024-2028.

                    MEP SolutionsIn Commercial Construction market is segmented by End-user( Office spaces, Hotels and malls, Hospitals and clinics, Others) Service( Consulting and engineering, Maintenance and support, System integration)

                    Affiliated Engineers Inc., AECOM, Burns and McDonnell, Buro Happold, DRAKE and SCULL, EMCOR Group Inc., Epsten Group, GDI Integrated Facility Services, Global Facility Solutions LLC, HDR Inc., Jensen Hughes, MEP Engineering Inc., Pinnacle Infotech Inc, Resolute Engineering, Royal Engineering Inc, SWJ ENGINEERING GmbH, Tetra Tech Inc., Total Facility Solutions, WSP Global Inc., XS CAD Ltd. are a few of the key vendors in the MEP SolutionsIn Commercial Construction market.

                    APAC will register the highest growth rate of 37% among the other regions. Therefore, the MEP SolutionsIn Commercial Construction market in APAC is expected to garner significant business opportunities for the vendors during the forecast period.

                    US, China, India, Japan, Germany, UK, Canada, Australia, France, Brazil

                    • Rising infrastructure investmentsThe global MEP solutions market in commercial construction is experiencing robust growth is the driving factor this market.
                    • largely driven by increased infrastructure investments. In India is the driving factor this market.
                    • the Interim Budget for 2024-25 highlights a significant commitment to infrastructure development is the driving factor this market.
                    • with approximately $131 is the driving factor this market.
                    • 799 million earmarked for capital investment. This represents an 11% increase from the previous year is the driving factor this market.
                    • signaling a strong push towards enhancing the infrastructure of the country. Such substantial funding is expected to boost the demand for advanced MEP solutions is the driving factor this market.
                    • essential for the development and modernization of commercial buildings.Similarly is the driving factor this market.
                    • the United States is witnessing a surge in infrastructure spending is the driving factor this market.
                    • fueled by various initiatives under the Biden administration. An estimated $1.8 trillion is being injected into the economy through federal grants is the driving factor this market.
                    • loans is the driving factor this market.
                    • incentives is the driving factor this market.
                    • tax credits is the driving factor this market.
                    • and other financial support mechanisms. This massive financial influx is anticipated to drive extensive commercial construction activities is the driving factor this market.
                    • thereby increasing the need for sophisticated MEP systems. The focus on upgrading infrastructure is the driving factor this market.
                    • improving energy efficiency is the driving factor this market.
                    • and incorporating smart technologies in commercial projects will further amplify the demand for MEP solutions.These rising investments are not confined to India and the United States alone but are part of a broader global trend. Governments and private sectors worldwide are prioritizing infrastructure development to foster economic growth is the driving factor this market.
                    • urbanization is the driving factor this market.
                    • and sustainability. This global emphasis on infrastructure enhancement is expected to propel the MEP solutions market is the driving factor this market.
                    • as commercial construction projects become more complex and technologically advanced.In summary is the driving factor this market.
                    • the global MEP solutions market in commercial construction is set to benefit significantly from rising infrastructure investments. The increased allocation of funds for infrastructure projects in key markets is the driving factor this market.
                    • coupled with a global trend towards modernization and sustainability is the driving factor this market.
                    • will drive the demand for innovative MEP solutions is the driving factor this market.
                    • fostering market growth during the forecast period. is the driving factor this market.

                    The MEP SolutionsIn Commercial Construction market vendors should focus on grabbing business opportunities from the Office spaces segment as it accounted for the largest market share in the base year.
                    RIA - Research AI Assistant
                    Ask RIA