Metal Material Based 3D Printing Market Analysis, Size, and Forecast 2026-2030: North America (US, Canada, and Mexico), Europe (UK, Germany, and France), APAC (China, Japan, and India), South America (Brazil and Argentina), Middle East and Africa (Saudi Arabia, UAE, and South Africa), and Rest of World (ROW)

Metal Material Based 3D Printing Market Analysis, Size, and Forecast 2026-2030:
North America (US, Canada, and Mexico), Europe (UK, Germany, and France), APAC (China, Japan, and India), South America (Brazil and Argentina), Middle East and Africa (Saudi Arabia, UAE, and South Africa), and Rest of World (ROW)

Published: Apr 2026 302 Pages SKU: IRTNTR76675

Market Overview at a Glance

$3.12 B
Market Opportunity
24%
CAGR 2025 - 2030
39.1%
North America Growth
$481.3 Mn
Iron-based segment 2024

Metal Material Based 3D Printing Market Size 2026-2030

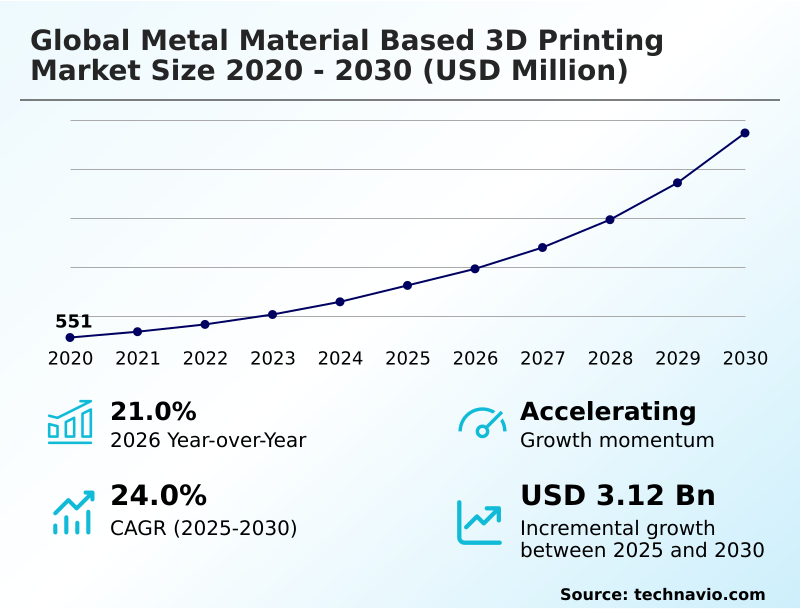
The metal material based 3d printing market size is valued to increase by USD 3.12 billion, at a CAGR of 24% from 2025 to 2030. Accelerated industrialization within aerospace and defense supply chains will drive the metal material based 3d printing market.

Major Market Trends & Insights

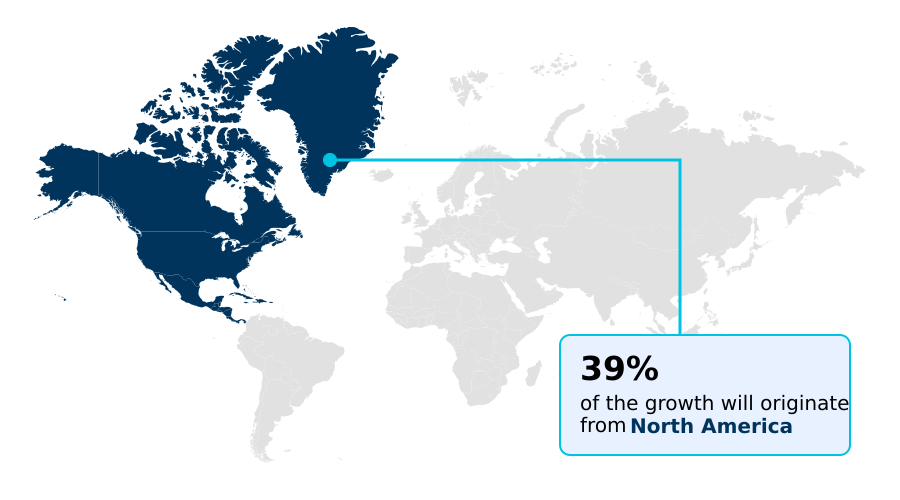
  • North America dominated the market and accounted for a 39.1% growth during the forecast period.
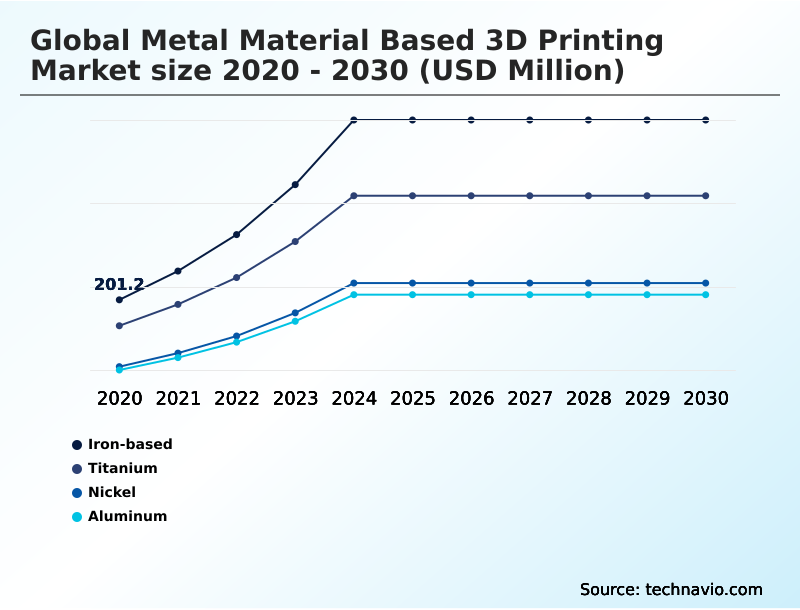
  • By Type - Iron-based segment was valued at USD 481.3 million in 2024
  • By End-user - Healthcare segment accounted for the largest market revenue share in 2024

Market Size & Forecast

  • Market Opportunities: USD 4.18 billion
  • Market Future Opportunities: USD 3.12 billion
  • CAGR from 2025 to 2030 : 24%

Market Summary

  • The metal material based 3D printing market is transitioning from a specialized prototyping tool to a mainstream manufacturing process for serial production. This evolution is driven by the demand for high-performance, lightweight components in sectors such as aerospace and healthcare.
  • The technology enables the creation of parts with complex geometries, such as lattice structures and internal cooling channels, which are unachievable with traditional subtractive methods. Organizations are adopting metal additive manufacturing to improve supply chain resilience, reduce material waste, and create on-demand parts, aligning with sustainability goals.
  • For instance, an aerospace supplier can consolidate a multi-part assembly into a single, 3D-printed component, reducing weight and potential points of failure while streamlining production. However, widespread adoption is tempered by the high costs of equipment and specialized metal powders, alongside the need for standardized quality assurance protocols.
  • Advancements in real-time process monitoring and the development of new alloys are critical to overcoming these hurdles and unlocking the technology's full industrial potential.

What will be the Size of the Metal Material Based 3D Printing Market during the forecast period?

Get Key Insights on Market Forecast (PDF) Get Free Sample

How is the Metal Material Based 3D Printing Market Segmented?

The metal material based 3d printing industry research report provides comprehensive data (region-wise segment analysis), with forecasts and estimates in "USD million" for the period 2026-2030, as well as historical data from 2020-2024 for the following segments.

  • Type
    • Iron-based
    • Titanium
    • Nickel
    • Aluminum
  • End-user
    • Healthcare
    • Automotive
    • Aerospace and defense
    • Tool and mold making
    • Others
  • Technology
    • PBF
    • DED
    • Binder jetting
    • Metal extrusion
  • Geography
    • North America
      • US
      • Canada
      • Mexico
    • Europe
      • UK
      • Germany
      • France
    • APAC
      • China
      • Japan
      • India
    • South America
      • Brazil
      • Argentina
    • Middle East and Africa
      • Saudi Arabia
      • UAE
      • South Africa
    • Rest of World (ROW)

By Type Insights

The iron-based segment is estimated to witness significant growth during the forecast period.

The iron-based segment is foundational to industrial additive manufacturing, utilizing materials like stainless steel and tool steels for automotive and machinery applications. Organizations leverage stainless steel grades for corrosion-resistant components and tool steels for durable molds featuring conformal cooling channels.

This segment's growth is driven by binder jetting technologies, enabling high-throughput production that competes with metal injection molding.

By employing predictive analytics in the build process, manufacturers achieve enhanced repeatability and have reported up to a 15% reduction in component rejection rates.

This data-driven approach to metal powder management ensures structural integrity, making iron-based additive manufacturing a scalable and cost-effective choice for industrial components, particularly in applications requiring thermal management and high-purity metal powders.

Get Free Sample

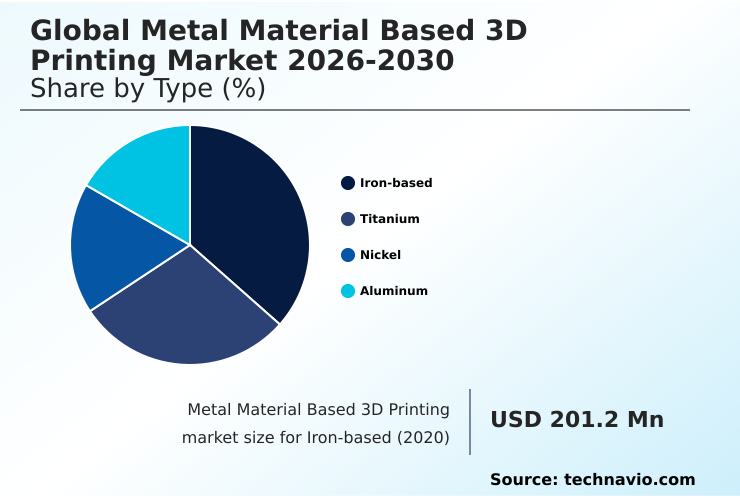
The Iron-based segment was valued at USD 481.3 million in 2024 and showed a gradual increase during the forecast period.

Get Free Sample

Regional Analysis

North America is estimated to contribute 39.1% to the growth of the global market during the forecast period.Technavio’s analysts have elaborately explained the regional trends and drivers that shape the market during the forecast period.

See How Metal Material Based 3D Printing Market Demand is Rising in North America Get Free Sample

The geographic landscape of the global metal material based 3D printing market is shaped by regional industrial priorities.

North America, which accounts for 39.1% of the market's incremental growth, leads due to heavy investment from its aerospace and defense sectors, focusing on advanced powder bed fusion and directed energy deposition systems.

Europe remains a strong contender, driven by its advanced manufacturing ecosystem, particularly in Germany and the UK. Meanwhile, APAC is projected to exhibit the highest regional growth rate at 25.0%, fueled by expanding industrialization and government support for additive manufacturing.

This region's adoption of hybrid manufacturing and metal extrusion techniques is growing.

The ability to perform advanced thermal analysis and utilize refractory metals is becoming a key differentiator across all regions, enabling the production of flight-critical components and specialized industrial machinery parts.

Market Dynamics

Our researchers analyzed the data with 2025 as the base year, along with the key drivers, trends, and challenges. A holistic analysis of drivers will help companies refine their marketing strategies to gain a competitive advantage.

  • The global metal material based 3D printing market is advancing through specialized applications and technological refinements. For instance, large-format metal 3d printing applications are crucial for industries requiring sizable components, while advancements in metal powder production for additive manufacturing ensure the quality and consistency needed for mission-critical parts.
  • The use of electron beam melting for aerospace components delivers superior strength and heat resistance, a key advantage over traditional methods. Meanwhile, binder jetting for high-volume production is becoming a cost-effective alternative for serial manufacturing, challenging conventional techniques.
  • Companies are increasingly offering directed energy deposition repair services to extend the life of high-value industrial assets, a market segment showing growth over 20% faster than new part production in some areas. The qualification of metal 3d printed parts for medical implants is driven by stringent regulatory standards, ensuring patient safety.
  • Furthermore, process monitoring for metal additive manufacturing is essential for quality assurance, just as post-processing of 3d printed metal parts is critical for achieving final specifications. The development of high-performance superalloys for 3d printing and the optimization of multi-laser powder bed fusion systems are pushing the boundaries of what is possible in industrial production.

What are the key market drivers leading to the rise in the adoption of Metal Material Based 3D Printing Industry?

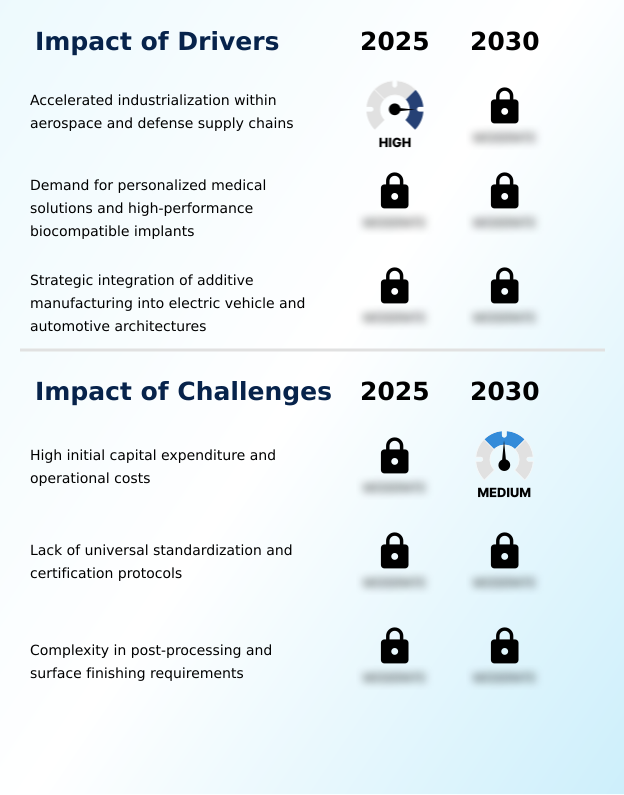
  • Accelerated industrialization within aerospace and defense supply chains represents a key driver for the market.

  • A significant driver for the global metal material based 3D printing market is the accelerated adoption of additive manufacturing for flight-critical components in the aerospace and defense sectors.
  • The need to improve fuel efficiency by lightweighting, with some programs achieving mass reductions of over 30%, propels the use of topology optimization and complex lattice structures.
  • These technologies enable the production of parts from high-performance superalloys and custom metal alloys.
  • The defense industry leverages metal 3D printing to manufacture obsolete spare parts on demand, ensuring operational readiness and reducing inventory costs by as much as 50% for certain legacy systems.
  • This strategic shift towards localized production of high-value metallic parts mitigates supply chain disruptions. The development of refractory metals and advanced metal powders is also expanding the operational capabilities for mission-critical applications.

What are the market trends shaping the Metal Material Based 3D Printing Industry?

  • The integration of AI and machine learning for advanced process monitoring is an emerging trend. This development is enhancing manufacturing reliability and efficiency across the industry.

  • A primary trend influencing the metal material based 3D printing market is the integration of AI and machine learning for enhanced process control. Stakeholders are deploying sophisticated sensor arrays for in-situ monitoring, allowing for immediate detection of anomalies like porosity, which has been shown to reduce part rejection rates by up to 20%.
  • This shift towards a data-driven discipline enables the use of predictive analytics and digital twinning to ensure structural integrity and high repeatability. As organizations adopt these software solutions, a global standardization of digital quality protocols is emerging.
  • The focus is on creating a continuous improvement loop where historical build data from multi-laser systems refines future print parameters, making the transition to industrial-scale serial production more viable. This trend is particularly evident in the production of complex components requiring topology optimization and advanced thermal management.

What challenges does the Metal Material Based 3D Printing Industry face during its growth?

  • High initial capital expenditure and significant operational costs present a key challenge affecting industry growth.

  • A major challenge restraining the global metal material based 3D printing market is the significant capital investment required for industrial-scale facilities. High-end powder bed fusion or directed energy deposition systems, combined with ancillary equipment, create a substantial financial barrier.
  • Operational costs, driven by expensive specialized metal powders and high energy consumption, add further pressure, with utility expenses representing up to 15% of the total cost per part in some cases. The need for a highly skilled workforce with expertise in material science and additive design principles increases labor costs.
  • The complexity of post-processing, including surface finishing and heat treatment, also adds considerable time and expense, sometimes doubling the initial print time. These economic factors limit the democratization of metal 3D printing, especially for small and medium-sized enterprises seeking a justifiable short-term ROI.

Exclusive Technavio Analysis on Customer Landscape

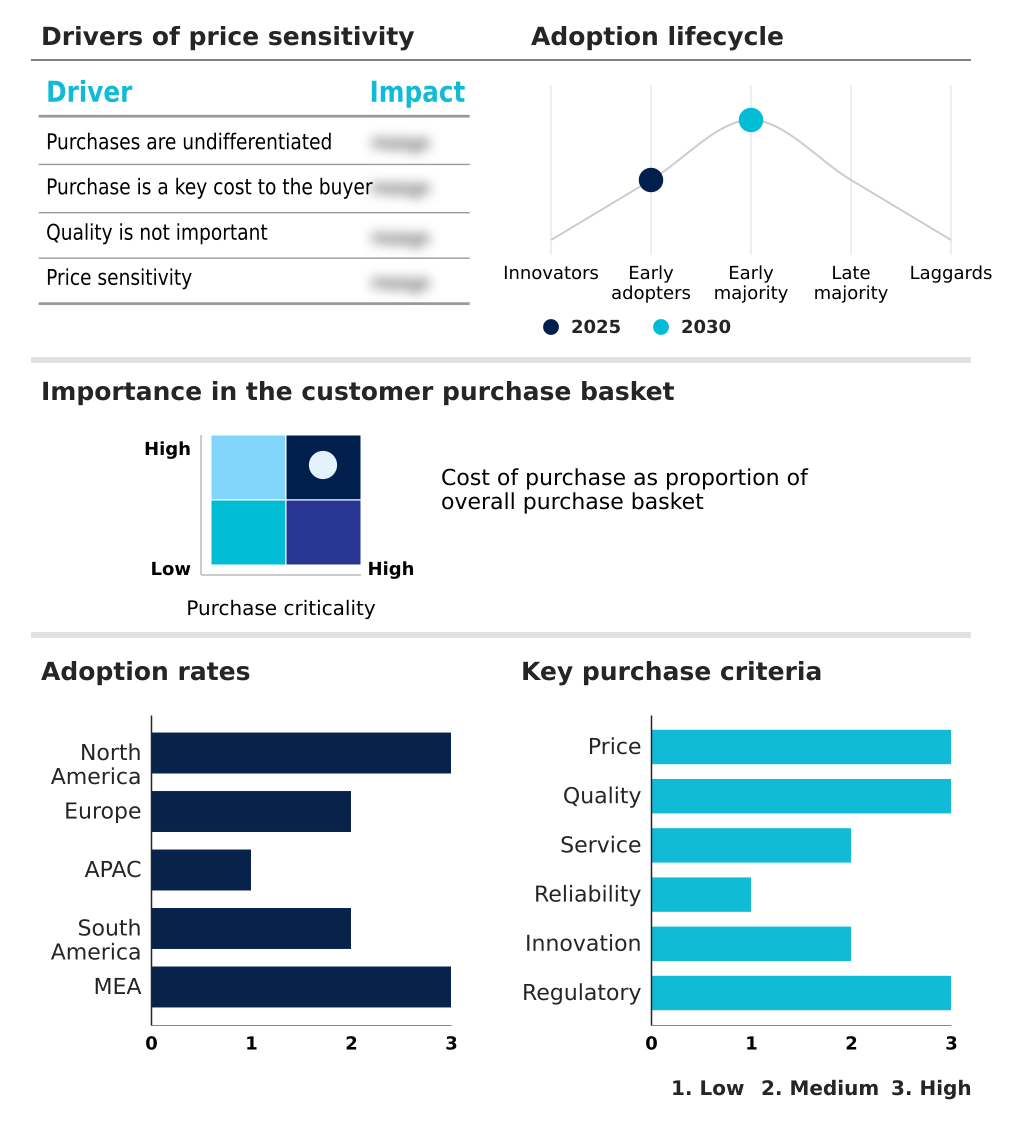
The metal material based 3d printing market forecasting report includes the adoption lifecycle of the market, covering from the innovator’s stage to the laggard’s stage. It focuses on adoption rates in different regions based on penetration. Furthermore, the metal material based 3d printing market report also includes key purchase criteria and drivers of price sensitivity to help companies evaluate and develop their market growth analysis strategies.

Customer Landscape of Metal Material Based 3D Printing Industry

Competitive Landscape

Companies are implementing various strategies, such as strategic alliances, metal material based 3d printing market forecast, partnerships, mergers and acquisitions, geographical expansion, and product/service launches, to enhance their presence in the industry.

3D Systems Corp. - Key offerings include direct metal printing technologies, enabling the production of complex, industrial-grade metal components for high-stakes aerospace, healthcare, and automotive applications.

The industry research and growth report includes detailed analyses of the competitive landscape of the market and information about key companies, including:

  • 3D Systems Corp.
  • AddUp
  • Carpenter Technology Corp.
  • Colibrium Additive
  • Desktop Metal Inc.
  • DMG MORI CO. LTD.
  • EOS GmbH
  • Eplus 3D
  • GKN Sinter Metals Engineering GmbH
  • Hoganas AB
  • HP Inc.
  • Markforged Holding Corp.
  • OC Oerlikon Corp.
  • Optomec Inc.
  • Renishaw Plc
  • Sandvik AB
  • Sciaky Inc.
  • TRUMPF SE Co. KG
  • Velo3D Inc.
  • Xjet Ltd.

Qualitative and quantitative analysis of companies has been conducted to help clients understand the wider business environment as well as the strengths and weaknesses of key industry players. Data is qualitatively analyzed to categorize companies as pure play, category-focused, industry-focused, and diversified; it is quantitatively analyzed to categorize companies as dominant, leading, strong, tentative, and weak.

Recent Development and News in Metal material based 3d printing market

  • In August 2025, 3D Systems Corp. received a $7.5 million contract from the U.S. Air Force for its Large-format Metal 3D Printer Advanced Technology Demonstrator, supporting the development of large-scale industrial metal additive manufacturing for high-speed flight applications.
  • In October 2025, EOS GmbH expanded its portfolio with four new metal additive manufacturing materials, including EOS FeNi36 and EOS NickelAlloy C22, optimized for laser powder bed fusion systems to serve the aerospace, energy, and automotive industries.
  • In March 2025, Backflip AI introduced a new 3D artificial intelligence foundation model designed to automate the creation of high-fidelity digital files from 3D scans, streamlining the production of replacement parts and reducing industrial downtime.
  • In April 2025, Nano Dimension completed its acquisition of Desktop Metal, creating a global leader in digital manufacturing solutions by combining complementary technologies in systems, software, and materials for advanced additive manufacturing at scale.

Dive into Technavio’s robust research methodology, blending expert interviews, extensive data synthesis, and validated models for unparalleled Metal Material Based 3D Printing Market insights. See full methodology.

Market Scope
Page number 302
Base year 2025
Historic period 2020-2024
Forecast period 2026-2030
Growth momentum & CAGR Accelerate at a CAGR of 24%
Market growth 2026-2030 USD 3118.1 million
Market structure Fragmented
YoY growth 2025-2026(%) 21.0%
Key countries US, Canada, Mexico, UK, Germany, France, Italy, Spain, The Netherlands, China, Japan, India, South Korea, Australia, Indonesia, Brazil, Argentina, Chile, Saudi Arabia, UAE, South Africa, Israel and Turkey
Competitive landscape Leading Companies, Market Positioning of Companies, Competitive Strategies, and Industry Risks

Request Free Sample

Research Analyst Overview

  • The metal material based 3D printing market is undergoing a crucial maturation phase, shifting from prototyping to industrial-scale serial production. This transition influences boardroom decisions on capital expenditure and supply chain strategy, as organizations integrate technologies like powder bed fusion and directed energy deposition into their core operations.
  • The adoption of metal injection molding principles within binder jetting processes is a key development. The demand for biocompatible implants and patient-specific medical devices drives innovation in materials and regulatory compliance. Similarly, the aerospace sector's focus on topology optimization and lightweighting for fuel efficiency propels the use of advanced systems.
  • Achieving a certified manufacturing process is paramount, with some firms reporting a 25% reduction in qualification time by leveraging integrated software and hardware platforms. The market's evolution is further characterized by the development of custom metal alloys and a focus on creating functional end-use parts that meet stringent industry standards for performance and reliability.

What are the Key Data Covered in this Metal Material Based 3D Printing Market Research and Growth Report?

  • What is the expected growth of the Metal Material Based 3D Printing Market between 2026 and 2030?

    • USD 3.12 billion, at a CAGR of 24%

  • What segmentation does the market report cover?

    • The report is segmented by Type (Iron-based, Titanium, Nickel, and Aluminum), End-user (Healthcare, Automotive, Aerospace and defense, Tool and mold making, and Others), Technology (PBF, DED, Binder jetting, and Metal extrusion) and Geography (North America, Europe, APAC, South America, Middle East and Africa)

  • Which regions are analyzed in the report?

    • North America, Europe, APAC, South America and Middle East and Africa

  • What are the key growth drivers and market challenges?

    • Accelerated industrialization within aerospace and defense supply chains, High initial capital expenditure and operational costs

  • Who are the major players in the Metal Material Based 3D Printing Market?

    • 3D Systems Corp., AddUp, Carpenter Technology Corp., Colibrium Additive, Desktop Metal Inc., DMG MORI CO. LTD., EOS GmbH, Eplus 3D, GKN Sinter Metals Engineering GmbH, Hoganas AB, HP Inc., Markforged Holding Corp., OC Oerlikon Corp., Optomec Inc., Renishaw Plc, Sandvik AB, Sciaky Inc., TRUMPF SE Co. KG, Velo3D Inc. and Xjet Ltd.

Market Research Insights

  • The metal material based 3D printing market is defined by a dynamic interplay of technological advancement and industrial application, where process optimization drives significant business outcomes. For instance, the use of topology optimization has enabled component lightweighting by over 40% in some aerospace applications, directly improving fuel efficiency.
  • Simultaneously, the implementation of real-time melt pool monitoring has reduced part rejection rates by more than 25%, enhancing production yields. These efficiency gains are compelling, with some organizations reporting a return on investment within 24 months for high-volume production lines.
  • The focus on developing a digital twin for each build allows for predictive analytics, further refining print parameters and ensuring consistent quality across global manufacturing sites. The expansion into new high-performance superalloys and advanced metal powders continues to broaden the technology's applicability in extreme environments.

We can help! Our analysts can customize this metal material based 3d printing market research report to meet your requirements.

Get in touch

1. Executive Summary

1.1 Market overview

Executive Summary - Chart on Market Overview
Executive Summary - Data Table on Market Overview
Executive Summary - Chart on Global Market Characteristics
Executive Summary - Chart on Market by Geography
Executive Summary - Chart on Market Segmentation by Type
Executive Summary - Chart on Market Segmentation by End-user
Executive Summary - Chart on Market Segmentation by Technology
Executive Summary - Chart on Incremental Growth
Executive Summary - Data Table on Incremental Growth
Executive Summary - Chart on Company Market Positioning

2. Technavio Analysis

2.1 Analysis of price sensitivity, lifecycle, customer purchase basket, adoption rates, and purchase criteria

2.2 Criticality of inputs and Factors of differentiation

Chart on Overview on criticality of inputs and factors of differentiation

2.3 Factors of disruption

Chart on Overview on factors of disruption

2.4 Impact of drivers and challenges

Chart on Impact of drivers and challenges in 2025 and 2030

3. Market Landscape

3.1 Market ecosystem

Chart on Parent Market
Data Table on - Parent Market

3.2 Market characteristics

Chart on Market characteristics analysis

3.3 Value chain analysis

Chart on Value chain analysis

4. Market Sizing

4.1 Market definition

Data Table on Offerings of companies included in the market definition

4.2 Market segment analysis

Market segments

4.3 Market size 2025

4.4 Market outlook: Forecast for 2025-2030

Chart on Global - Market size and forecast 2025-2030 ($ million)
Data Table on Global - Market size and forecast 2025-2030 ($ million)
Chart on Global Market: Year-over-year growth 2025-2030 (%)
Data Table on Global Market: Year-over-year growth 2025-2030 (%)

5. Historic Market Size

5.1 Global Metal Material Based 3D Printing Market 2020 - 2024

Historic Market Size - Data Table on Global Metal Material Based 3D Printing Market 2020 - 2024 ($ million)

5.2 Type segment analysis 2020 - 2024

Historic Market Size - Type Segment 2020 - 2024 ($ million)

5.3 End-user segment analysis 2020 - 2024

Historic Market Size - End-user Segment 2020 - 2024 ($ million)

5.4 Technology segment analysis 2020 - 2024

Historic Market Size - Technology Segment 2020 - 2024 ($ million)

5.5 Geography segment analysis 2020 - 2024

Historic Market Size - Geography Segment 2020 - 2024 ($ million)

5.6 Country segment analysis 2020 - 2024

Historic Market Size - Country Segment 2020 - 2024 ($ million)

6. Qualitative Analysis

6.1 Impact of AI on global metal material based 3D printing market

6.2 Impact of geopolitical conflict on global metal material based 3D printing market

7. Five Forces Analysis

7.1 Five forces summary

Five forces analysis - Comparison between 2025 and 2030

7.2 Bargaining power of buyers

Bargaining power of buyers - Impact of key factors 2025 and 2030

7.3 Bargaining power of suppliers

Bargaining power of suppliers - Impact of key factors in 2025 and 2030

7.4 Threat of new entrants

Threat of new entrants - Impact of key factors in 2025 and 2030

7.5 Threat of substitutes

Threat of substitutes - Impact of key factors in 2025 and 2030

7.6 Threat of rivalry

Threat of rivalry - Impact of key factors in 2025 and 2030

7.7 Market condition

Chart on Market condition - Five forces 2025 and 2030

8. Market Segmentation by Type

8.1 Market segments

Chart on Type - Market share 2025-2030 (%)
Data Table on Type - Market share 2025-2030 (%)

8.2 Comparison by Type

Chart on Comparison by Type
Data Table on Comparison by Type

8.3 Iron-based - Market size and forecast 2025-2030

Chart on Iron-based - Market size and forecast 2025-2030 ($ million)
Data Table on Iron-based - Market size and forecast 2025-2030 ($ million)
Chart on Iron-based - Year-over-year growth 2025-2030 (%)
Data Table on Iron-based - Year-over-year growth 2025-2030 (%)

8.4 Titanium - Market size and forecast 2025-2030

Chart on Titanium - Market size and forecast 2025-2030 ($ million)
Data Table on Titanium - Market size and forecast 2025-2030 ($ million)
Chart on Titanium - Year-over-year growth 2025-2030 (%)
Data Table on Titanium - Year-over-year growth 2025-2030 (%)

8.5 Nickel - Market size and forecast 2025-2030

Chart on Nickel - Market size and forecast 2025-2030 ($ million)
Data Table on Nickel - Market size and forecast 2025-2030 ($ million)
Chart on Nickel - Year-over-year growth 2025-2030 (%)
Data Table on Nickel - Year-over-year growth 2025-2030 (%)

8.6 Aluminum - Market size and forecast 2025-2030

Chart on Aluminum - Market size and forecast 2025-2030 ($ million)
Data Table on Aluminum - Market size and forecast 2025-2030 ($ million)
Chart on Aluminum - Year-over-year growth 2025-2030 (%)
Data Table on Aluminum - Year-over-year growth 2025-2030 (%)

8.7 Market opportunity by Type

Market opportunity by Type ($ million)
Data Table on Market opportunity by Type ($ million)

9. Market Segmentation by End-user

9.1 Market segments

Chart on End-user - Market share 2025-2030 (%)
Data Table on End-user - Market share 2025-2030 (%)

9.2 Comparison by End-user

Chart on Comparison by End-user
Data Table on Comparison by End-user

9.3 Healthcare - Market size and forecast 2025-2030

Chart on Healthcare - Market size and forecast 2025-2030 ($ million)
Data Table on Healthcare - Market size and forecast 2025-2030 ($ million)
Chart on Healthcare - Year-over-year growth 2025-2030 (%)
Data Table on Healthcare - Year-over-year growth 2025-2030 (%)

9.4 Automotive - Market size and forecast 2025-2030

Chart on Automotive - Market size and forecast 2025-2030 ($ million)
Data Table on Automotive - Market size and forecast 2025-2030 ($ million)
Chart on Automotive - Year-over-year growth 2025-2030 (%)
Data Table on Automotive - Year-over-year growth 2025-2030 (%)

9.5 Aerospace and defense - Market size and forecast 2025-2030

Chart on Aerospace and defense - Market size and forecast 2025-2030 ($ million)
Data Table on Aerospace and defense - Market size and forecast 2025-2030 ($ million)
Chart on Aerospace and defense - Year-over-year growth 2025-2030 (%)
Data Table on Aerospace and defense - Year-over-year growth 2025-2030 (%)

9.6 Tool and mold making - Market size and forecast 2025-2030

Chart on Tool and mold making - Market size and forecast 2025-2030 ($ million)
Data Table on Tool and mold making - Market size and forecast 2025-2030 ($ million)
Chart on Tool and mold making - Year-over-year growth 2025-2030 (%)
Data Table on Tool and mold making - Year-over-year growth 2025-2030 (%)

9.7 Others - Market size and forecast 2025-2030

Chart on Others - Market size and forecast 2025-2030 ($ million)
Data Table on Others - Market size and forecast 2025-2030 ($ million)
Chart on Others - Year-over-year growth 2025-2030 (%)
Data Table on Others - Year-over-year growth 2025-2030 (%)

9.8 Market opportunity by End-user

Market opportunity by End-user ($ million)
Data Table on Market opportunity by End-user ($ million)

10. Market Segmentation by Technology

10.1 Market segments

Chart on Technology - Market share 2025-2030 (%)
Data Table on Technology - Market share 2025-2030 (%)

10.2 Comparison by Technology

Chart on Comparison by Technology
Data Table on Comparison by Technology

10.3 PBF - Market size and forecast 2025-2030

Chart on PBF - Market size and forecast 2025-2030 ($ million)
Data Table on PBF - Market size and forecast 2025-2030 ($ million)
Chart on PBF - Year-over-year growth 2025-2030 (%)
Data Table on PBF - Year-over-year growth 2025-2030 (%)

10.4 DED - Market size and forecast 2025-2030

Chart on DED - Market size and forecast 2025-2030 ($ million)
Data Table on DED - Market size and forecast 2025-2030 ($ million)
Chart on DED - Year-over-year growth 2025-2030 (%)
Data Table on DED - Year-over-year growth 2025-2030 (%)

10.5 Binder jetting - Market size and forecast 2025-2030

Chart on Binder jetting - Market size and forecast 2025-2030 ($ million)
Data Table on Binder jetting - Market size and forecast 2025-2030 ($ million)
Chart on Binder jetting - Year-over-year growth 2025-2030 (%)
Data Table on Binder jetting - Year-over-year growth 2025-2030 (%)

10.6 Metal extrusion - Market size and forecast 2025-2030

Chart on Metal extrusion - Market size and forecast 2025-2030 ($ million)
Data Table on Metal extrusion - Market size and forecast 2025-2030 ($ million)
Chart on Metal extrusion - Year-over-year growth 2025-2030 (%)
Data Table on Metal extrusion - Year-over-year growth 2025-2030 (%)

10.7 Market opportunity by Technology

Market opportunity by Technology ($ million)
Data Table on Market opportunity by Technology ($ million)

11. Customer Landscape

11.1 Customer landscape overview

Analysis of price sensitivity, lifecycle, customer purchase basket, adoption rates, and purchase criteria

12. Geographic Landscape

12.1 Geographic segmentation

Chart on Market share by geography 2025-2030 (%)
Data Table on Market share by geography 2025-2030 (%)

12.2 Geographic comparison

Chart on Geographic comparison
Data Table on Geographic comparison

12.3 North America - Market size and forecast 2025-2030

Chart on North America - Market size and forecast 2025-2030 ($ million)
Data Table on North America - Market size and forecast 2025-2030 ($ million)
Chart on North America - Year-over-year growth 2025-2030 (%)
Data Table on North America - Year-over-year growth 2025-2030 (%)
Chart on Regional Comparison - North America
Data Table on Regional Comparison - North America

12.3.1 US - Market size and forecast 2025-2030

Chart on US - Market size and forecast 2025-2030 ($ million)
Data Table on US - Market size and forecast 2025-2030 ($ million)
Chart on US - Year-over-year growth 2025-2030 (%)
Data Table on US - Year-over-year growth 2025-2030 (%)

12.3.2 Canada - Market size and forecast 2025-2030

Chart on Canada - Market size and forecast 2025-2030 ($ million)
Data Table on Canada - Market size and forecast 2025-2030 ($ million)
Chart on Canada - Year-over-year growth 2025-2030 (%)
Data Table on Canada - Year-over-year growth 2025-2030 (%)

12.3.3 Mexico - Market size and forecast 2025-2030

Chart on Mexico - Market size and forecast 2025-2030 ($ million)
Data Table on Mexico - Market size and forecast 2025-2030 ($ million)
Chart on Mexico - Year-over-year growth 2025-2030 (%)
Data Table on Mexico - Year-over-year growth 2025-2030 (%)

12.4 Europe - Market size and forecast 2025-2030

Chart on Europe - Market size and forecast 2025-2030 ($ million)
Data Table on Europe - Market size and forecast 2025-2030 ($ million)
Chart on Europe - Year-over-year growth 2025-2030 (%)
Data Table on Europe - Year-over-year growth 2025-2030 (%)
Chart on Regional Comparison - Europe
Data Table on Regional Comparison - Europe

12.4.1 UK - Market size and forecast 2025-2030

Chart on UK - Market size and forecast 2025-2030 ($ million)
Data Table on UK - Market size and forecast 2025-2030 ($ million)
Chart on UK - Year-over-year growth 2025-2030 (%)
Data Table on UK - Year-over-year growth 2025-2030 (%)

12.4.2 Germany - Market size and forecast 2025-2030

Chart on Germany - Market size and forecast 2025-2030 ($ million)
Data Table on Germany - Market size and forecast 2025-2030 ($ million)
Chart on Germany - Year-over-year growth 2025-2030 (%)
Data Table on Germany - Year-over-year growth 2025-2030 (%)

12.4.3 France - Market size and forecast 2025-2030

Chart on France - Market size and forecast 2025-2030 ($ million)
Data Table on France - Market size and forecast 2025-2030 ($ million)
Chart on France - Year-over-year growth 2025-2030 (%)
Data Table on France - Year-over-year growth 2025-2030 (%)

12.4.4 Italy - Market size and forecast 2025-2030

Chart on Italy - Market size and forecast 2025-2030 ($ million)
Data Table on Italy - Market size and forecast 2025-2030 ($ million)
Chart on Italy - Year-over-year growth 2025-2030 (%)
Data Table on Italy - Year-over-year growth 2025-2030 (%)

12.4.5 Spain - Market size and forecast 2025-2030

Chart on Spain - Market size and forecast 2025-2030 ($ million)
Data Table on Spain - Market size and forecast 2025-2030 ($ million)
Chart on Spain - Year-over-year growth 2025-2030 (%)
Data Table on Spain - Year-over-year growth 2025-2030 (%)

12.4.6 The Netherlands - Market size and forecast 2025-2030

Chart on The Netherlands - Market size and forecast 2025-2030 ($ million)
Data Table on The Netherlands - Market size and forecast 2025-2030 ($ million)
Chart on The Netherlands - Year-over-year growth 2025-2030 (%)
Data Table on The Netherlands - Year-over-year growth 2025-2030 (%)

12.5 APAC - Market size and forecast 2025-2030

Chart on APAC - Market size and forecast 2025-2030 ($ million)
Data Table on APAC - Market size and forecast 2025-2030 ($ million)
Chart on APAC - Year-over-year growth 2025-2030 (%)
Data Table on APAC - Year-over-year growth 2025-2030 (%)
Chart on Regional Comparison - APAC
Data Table on Regional Comparison - APAC

12.5.1 China - Market size and forecast 2025-2030

Chart on China - Market size and forecast 2025-2030 ($ million)
Data Table on China - Market size and forecast 2025-2030 ($ million)
Chart on China - Year-over-year growth 2025-2030 (%)
Data Table on China - Year-over-year growth 2025-2030 (%)

12.5.2 Japan - Market size and forecast 2025-2030

Chart on Japan - Market size and forecast 2025-2030 ($ million)
Data Table on Japan - Market size and forecast 2025-2030 ($ million)
Chart on Japan - Year-over-year growth 2025-2030 (%)
Data Table on Japan - Year-over-year growth 2025-2030 (%)

12.5.3 India - Market size and forecast 2025-2030

Chart on India - Market size and forecast 2025-2030 ($ million)
Data Table on India - Market size and forecast 2025-2030 ($ million)
Chart on India - Year-over-year growth 2025-2030 (%)
Data Table on India - Year-over-year growth 2025-2030 (%)

12.5.4 South Korea - Market size and forecast 2025-2030

Chart on South Korea - Market size and forecast 2025-2030 ($ million)
Data Table on South Korea - Market size and forecast 2025-2030 ($ million)
Chart on South Korea - Year-over-year growth 2025-2030 (%)
Data Table on South Korea - Year-over-year growth 2025-2030 (%)

12.5.5 Australia - Market size and forecast 2025-2030

Chart on Australia - Market size and forecast 2025-2030 ($ million)
Data Table on Australia - Market size and forecast 2025-2030 ($ million)
Chart on Australia - Year-over-year growth 2025-2030 (%)
Data Table on Australia - Year-over-year growth 2025-2030 (%)

12.5.6 Indonesia - Market size and forecast 2025-2030

Chart on Indonesia - Market size and forecast 2025-2030 ($ million)
Data Table on Indonesia - Market size and forecast 2025-2030 ($ million)
Chart on Indonesia - Year-over-year growth 2025-2030 (%)
Data Table on Indonesia - Year-over-year growth 2025-2030 (%)

12.6 South America - Market size and forecast 2025-2030

Chart on South America - Market size and forecast 2025-2030 ($ million)
Data Table on South America - Market size and forecast 2025-2030 ($ million)
Chart on South America - Year-over-year growth 2025-2030 (%)
Data Table on South America - Year-over-year growth 2025-2030 (%)
Chart on Regional Comparison - South America
Data Table on Regional Comparison - South America

12.6.1 Brazil - Market size and forecast 2025-2030

Chart on Brazil - Market size and forecast 2025-2030 ($ million)
Data Table on Brazil - Market size and forecast 2025-2030 ($ million)
Chart on Brazil - Year-over-year growth 2025-2030 (%)
Data Table on Brazil - Year-over-year growth 2025-2030 (%)

12.6.2 Argentina - Market size and forecast 2025-2030

Chart on Argentina - Market size and forecast 2025-2030 ($ million)
Data Table on Argentina - Market size and forecast 2025-2030 ($ million)
Chart on Argentina - Year-over-year growth 2025-2030 (%)
Data Table on Argentina - Year-over-year growth 2025-2030 (%)

12.6.3 Chile - Market size and forecast 2025-2030

Chart on Chile - Market size and forecast 2025-2030 ($ million)
Data Table on Chile - Market size and forecast 2025-2030 ($ million)
Chart on Chile - Year-over-year growth 2025-2030 (%)
Data Table on Chile - Year-over-year growth 2025-2030 (%)

12.7 Middle East and Africa - Market size and forecast 2025-2030

Chart on Middle East and Africa - Market size and forecast 2025-2030 ($ million)
Data Table on Middle East and Africa - Market size and forecast 2025-2030 ($ million)
Chart on Middle East and Africa - Year-over-year growth 2025-2030 (%)
Data Table on Middle East and Africa - Year-over-year growth 2025-2030 (%)
Chart on Regional Comparison - Middle East and Africa
Data Table on Regional Comparison - Middle East and Africa

12.7.1 Saudi Arabia - Market size and forecast 2025-2030

Chart on Saudi Arabia - Market size and forecast 2025-2030 ($ million)
Data Table on Saudi Arabia - Market size and forecast 2025-2030 ($ million)
Chart on Saudi Arabia - Year-over-year growth 2025-2030 (%)
Data Table on Saudi Arabia - Year-over-year growth 2025-2030 (%)

12.7.2 UAE - Market size and forecast 2025-2030

Chart on UAE - Market size and forecast 2025-2030 ($ million)
Data Table on UAE - Market size and forecast 2025-2030 ($ million)
Chart on UAE - Year-over-year growth 2025-2030 (%)
Data Table on UAE - Year-over-year growth 2025-2030 (%)

12.7.3 South Africa - Market size and forecast 2025-2030

Chart on South Africa - Market size and forecast 2025-2030 ($ million)
Data Table on South Africa - Market size and forecast 2025-2030 ($ million)
Chart on South Africa - Year-over-year growth 2025-2030 (%)
Data Table on South Africa - Year-over-year growth 2025-2030 (%)

12.7.4 Israel - Market size and forecast 2025-2030

Chart on Israel - Market size and forecast 2025-2030 ($ million)
Data Table on Israel - Market size and forecast 2025-2030 ($ million)
Chart on Israel - Year-over-year growth 2025-2030 (%)
Data Table on Israel - Year-over-year growth 2025-2030 (%)

12.7.5 Turkey - Market size and forecast 2025-2030

Chart on Turkey - Market size and forecast 2025-2030 ($ million)
Data Table on Turkey - Market size and forecast 2025-2030 ($ million)
Chart on Turkey - Year-over-year growth 2025-2030 (%)
Data Table on Turkey - Year-over-year growth 2025-2030 (%)

12.8 Market opportunity by geography

Market opportunity by geography ($ million)
Data Tables on Market opportunity by geography ($ million)

13. Drivers, Challenges, and Opportunity

13.1 Market drivers

Accelerated industrialization within aerospace and defense supply chains
Demand for personalized medical solutions and high-performance biocompatible implants
Strategic integration of additive manufacturing into electric vehicle and automotive architectures

13.2 Market challenges

High initial capital expenditure and operational costs
Lack of universal standardization and certification protocols
Complexity in post-processing and surface finishing requirements

13.3 Impact of drivers and challenges

Impact of drivers and challenges in 2025 and 2030

13.4 Market opportunities

Integration of AI and ML in process monitoring
Transition toward sustainable material sourcing and circular economy principles
Expansion of hybrid manufacturing systems and multi-laser architectures

14. Competitive Landscape

14.1 Overview

14.2

Overview on criticality of inputs and factors of differentiation

14.3 Landscape disruption

Overview on factors of disruption

14.4 Industry risks

Impact of key risks on business

15. Competitive Analysis

15.1 Companies profiled

Companies covered

15.2 Company ranking index

15.3 Market positioning of companies

Matrix on companies position and classification

15.4 3D Systems Corp.

3D Systems Corp. - Overview
3D Systems Corp. - Business segments
3D Systems Corp. - Key offerings
3D Systems Corp. - Segment focus
SWOT

15.5 Carpenter Technology Corp.

Carpenter Technology Corp. - Overview
Carpenter Technology Corp. - Business segments
Carpenter Technology Corp. - Key offerings
Carpenter Technology Corp. - Segment focus
SWOT

15.6 Colibrium Additive

Colibrium Additive - Overview
Colibrium Additive - Product / Service
Colibrium Additive - Key offerings
SWOT

15.7 DMG MORI CO. LTD.

DMG MORI CO. LTD. - Overview
DMG MORI CO. LTD. - Product / Service
DMG MORI CO. LTD. - Key offerings
SWOT

15.8 EOS GmbH

EOS GmbH - Overview
EOS GmbH - Product / Service
EOS GmbH - Key offerings
SWOT

15.9 GKN Sinter Metals Engineering GmbH

GKN Sinter Metals Engineering GmbH - Overview
GKN Sinter Metals Engineering GmbH - Product / Service
GKN Sinter Metals Engineering GmbH - Key news
GKN Sinter Metals Engineering GmbH - Key offerings
SWOT

15.10 Hoganas AB

Hoganas AB - Overview
Hoganas AB - Product / Service
Hoganas AB - Key offerings
SWOT

15.11 HP Inc.

HP Inc. - Overview
HP Inc. - Business segments
HP Inc. - Key news
HP Inc. - Key offerings
HP Inc. - Segment focus
SWOT

15.12 Markforged Holding Corp.

Markforged Holding Corp. - Overview
Markforged Holding Corp. - Product / Service
Markforged Holding Corp. - Key offerings
SWOT

15.13 OC Oerlikon Corp.

OC Oerlikon Corp. - Overview
OC Oerlikon Corp. - Business segments
OC Oerlikon Corp. - Key offerings
OC Oerlikon Corp. - Segment focus
SWOT

15.14 Optomec Inc.

Optomec Inc. - Overview
Optomec Inc. - Product / Service
Optomec Inc. - Key offerings
SWOT

15.15 Sandvik AB

Sandvik AB - Overview
Sandvik AB - Business segments
Sandvik AB - Key offerings
Sandvik AB - Segment focus
SWOT

15.16 Sciaky Inc.

Sciaky Inc. - Overview
Sciaky Inc. - Product / Service
Sciaky Inc. - Key offerings
SWOT

15.17 TRUMPF SE Co. KG

TRUMPF SE Co. KG - Overview
TRUMPF SE Co. KG - Product / Service
TRUMPF SE Co. KG - Key offerings
SWOT

15.18 Xjet Ltd.

Xjet Ltd. - Overview
Xjet Ltd. - Product / Service
Xjet Ltd. - Key offerings
SWOT

16. Appendix

16.1 Scope of the report

Market definition
Objectives
Notes and caveats

16.2 Inclusions and exclusions checklist

Inclusions checklist
Exclusions checklist

16.3 Currency conversion rates for US$

16.4 Research methodology

16.5 Data procurement

Information sources

16.6 Data validation

16.7 Validation techniques employed for market sizing

16.8 Data synthesis

16.9 360 degree market analysis

16.10 List of abbreviations

Research Methodology

Technavio presents a detailed picture of the market by way of study, synthesis, and summation of data from multiple sources. The analysts have presented the various facets of the market with a particular focus on identifying the key industry influencers. The data thus presented is comprehensive, reliable, and the result of extensive research, both primary and secondary.

INFORMATION SOURCES

Primary sources

  • Manufacturers and suppliers
  • Channel partners
  • Industry experts
  • Strategic decision makers

Secondary sources

  • Industry journals and periodicals
  • Government data
  • Financial reports of key industry players
  • Historical data
  • Press releases

DATA ANALYSIS

Data Synthesis

  • Collation of data
  • Estimation of key figures
  • Analysis of derived insights

Data Validation

  • Triangulation with data models
  • Reference against proprietary databases
  • Corroboration with industry experts

REPORT WRITING

Qualitative

  • Market drivers
  • Market challenges
  • Market trends
  • Five forces analysis

Quantitative

  • Market size and forecast
  • Market segmentation
  • Geographical insights
  • Competitive landscape

Interested in this report?

Get your sample now to see our research methodology and insights!

Download Now

Frequently Asked Questions

Metal Material Based 3D Printing market growth will increase by USD 3118.1 million during 2026-2030.

The Metal Material Based 3D Printing market is expected to grow at a CAGR of 24% during 2026-2030.

Metal Material Based 3D Printing market is segmented by Type (Iron-based, Titanium, Nickel, Aluminum) End-user (Healthcare, Automotive, Aerospace and defense, Tool and mold making, Others) Technology (PBF, DED, Binder jetting, Metal extrusion)

3D Systems Corp., AddUp, Carpenter Technology Corp., Colibrium Additive, Desktop Metal Inc., DMG MORI CO. LTD., EOS GmbH, Eplus 3D, GKN Sinter Metals Engineering GmbH, Hoganas AB, HP Inc., Markforged Holding Corp., OC Oerlikon Corp., Optomec Inc., Renishaw Plc, Sandvik AB, Sciaky Inc., TRUMPF SE Co. KG, Velo3D Inc., Xjet Ltd. are a few of the key vendors in the Metal Material Based 3D Printing market.

North America will register the highest growth rate of 39.1% among the other regions. Therefore, the Metal Material Based 3D Printing market in North America is expected to garner significant business opportunities for the vendors during the forecast period.

US, Canada, Mexico, UK, Germany, France, Italy, Spain, The Netherlands, China, Japan, India, South Korea, Australia, Indonesia, Brazil, Argentina, Chile, Saudi Arabia, UAE, South Africa, Israel, Turkey

  • Accelerated industrialization within aerospace and defense supply chains is the driving factor this market.

The Metal Material Based 3D Printing market vendors should focus on grabbing business opportunities from the Type segment as it accounted for the largest market share in the base year.
RIA - Research AI Assistant
Ask RIA