Metaverse Real Estate Market Size 2024-2028
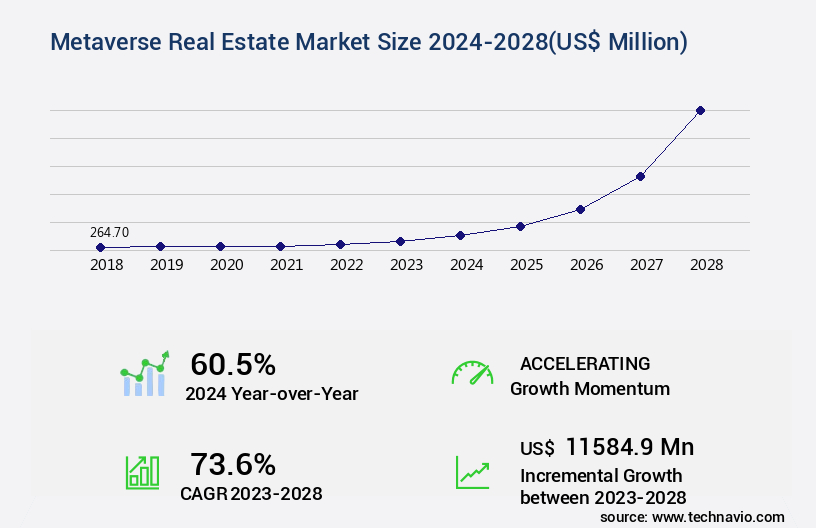
The metaverse real estate market size is forecast to increase by USD 11.58 billion, at a CAGR of 73.6% between 2023 and 2028.
- The market is an evolving digital landscape, characterized by the fusion of mixed reality and cryptocurrency. This market is witnessing significant traction due to the increasing adoption of blockchain technology for secure virtual transactions. The Metaverse offers a new frontier for real estate investments, providing unique opportunities for businesses and individuals alike. The market's dynamics are shaped by several factors. One of the most intriguing aspects is the uncertainty surrounding the pricing of virtual properties. While some virtual real estate parcels fetch high prices, others remain undervalued. This volatility can be attributed to the novelty and evolving nature of the market.
- Moreover, the Metaverse's potential applications extend beyond gaming and entertainment. Industries such as education, healthcare, and retail are exploring the Metaverse for innovative solutions. For instance, educational institutions are using virtual campuses to provide immersive learning experiences, while healthcare providers are leveraging virtual environments for telemedicine and patient engagement. Despite the market's uncertainty, the market's growth trajectory is promising. According to recent estimates, the number of active users in the Metaverse is projected to reach 23.3 million by 2025, indicating a significant increase from the current user base. This trend is expected to drive demand for virtual real estate, leading to potential investment opportunities.
- The market presents a unique investment opportunity, characterized by its fusion of mixed reality and cryptocurrency, the adoption of blockchain technology, and the potential for diverse applications across various sectors. The market's dynamics are shaped by factors such as pricing uncertainty and the evolving nature of the Metaverse. Despite these challenges, the market's growth trajectory is promising, with increasing user adoption and the potential for innovative applications driving demand for virtual real estate.
Major Market Trends & Insights
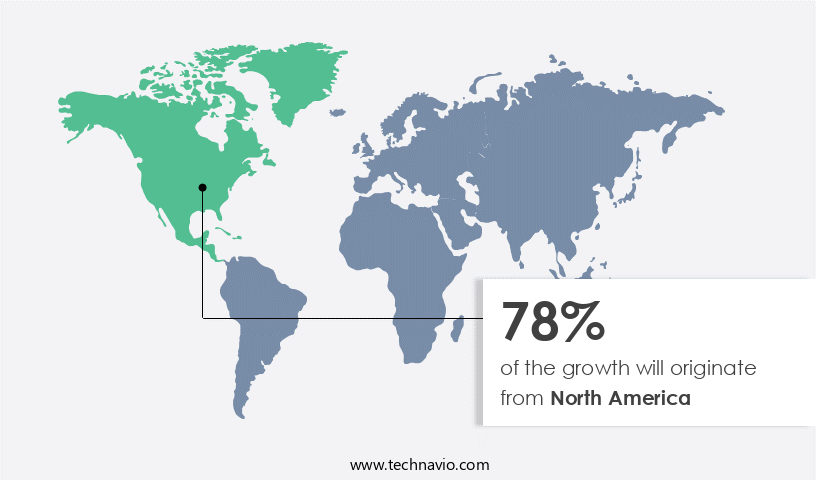
- North America dominated the market and accounted for a 78% growth during the forecast period.
- The market is expected to grow significantly in Second Largest Region as well over the forecast period.
- By the End-user, the Enterprises sub-segment was valued at USD 225.80 billion in 2022
- By the Type, the Virtual Land sub-segment accounted for the largest market revenue share in 2022
Market Size & Forecast
- Market Opportunities: USD 1.25 billion
- Future Opportunities: USD USD 11.58 billion
- CAGR : 73.6%
- North America: Largest market in 2022
What will be the Size of the Metaverse Real Estate Market during the forecast period?
Get Key Insights on Market Forecast (PDF) Request Free Sample
- Metaverse real estate represents a significant and expanding sector within the digital economy. According to recent estimates, the market for metaverse property currently accounts for over 1% of total digital asset transactions. Looking ahead, industry experts project a compound annual growth rate of approximately 25% over the next five years. Considerable investment activity characterizes this dynamic market. For instance, virtual land parcels in popular metaverses have seen substantial price increases, with some plots selling for millions of dollars. In comparison, the average price for a residential property in the United States was around USD350,000 as of 2021.
- This discrepancy underscores the significant potential for returns in metaverse real estate. Moreover, the market encompasses a diverse range of offerings. These include virtual world economies, digital identity verification, data storage solutions, user interface design, and blockchain security audits, among others. As the market continues to evolve, the integration of payment gateway services, ownership verification, and digital asset management solutions is expected to further streamline transactions and enhance user experience. Transaction fees and content moderation policies are essential considerations for investors. While fees vary between platforms, they can impact potential returns. Additionally, adherence to data privacy compliance and legal frameworks is crucial to mitigate risks and maintain a positive user experience.
- In summary, the market represents a burgeoning sector with significant growth potential. Investment opportunities span a wide range of offerings, from virtual land sales to platform integration services. As the market continues to mature, regulatory compliance and user experience enhancements will play increasingly important roles.
How is this Metaverse Real Estate Industry segmented?
The metaverse real estate industry research report provides comprehensive data (region-wise segment analysis), with forecasts and estimates in "USD million" for the period 2024-2028, as well as historical data from 2018-2022 for the following segments.
- End-user
- Enterprises
- Individuals
- Type
- Virtual Land
- Virtual Buildings
- Virtual Spaces
- Application
- Gaming
- Commercial
- Residential
- Others
- Technology
- Blockchain
- Virtual Reality (VR)
- Augmented Reality (AR)
- Geography
- North America
- US
- Canada
- Europe
- France
- Germany
- Italy
- Russia
- UK
- Middle East and Africa
- South Africa
- UAE
- APAC
- China
- India
- Japan
- South Korea
- South America
- Argentina
- Brazil
- Rest of World (ROW)
- North America
By End-user Insights
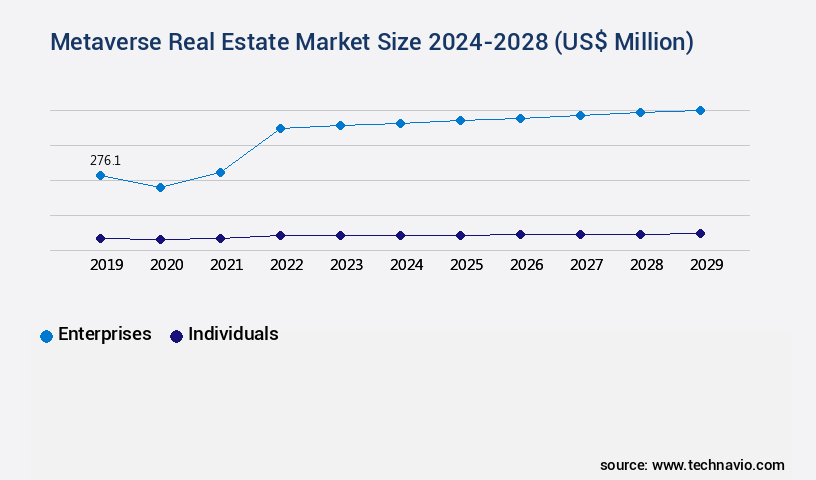
The enterprises segment is estimated to witness significant growth during the forecast period. The market is experiencing significant growth, with enterprises leading the charge. In 2023, this sector accounted for a substantial market share. The influx of major corporations, such as Nike, Facebook, and Microsoft, into the virtual world has accelerated market expansion. Two primary factors fueling this growth include the burgeoning NFT and virtual land ecosystems. Enterprises are increasingly adopting Virtual Reality (VR) solutions, leading to a substantial increase in adoption rates compared to the previous decade. The advent of Web 3.0 further propels market growth, enabling enterprises to buy virtual plots or houses and tokenize them as digital assets.
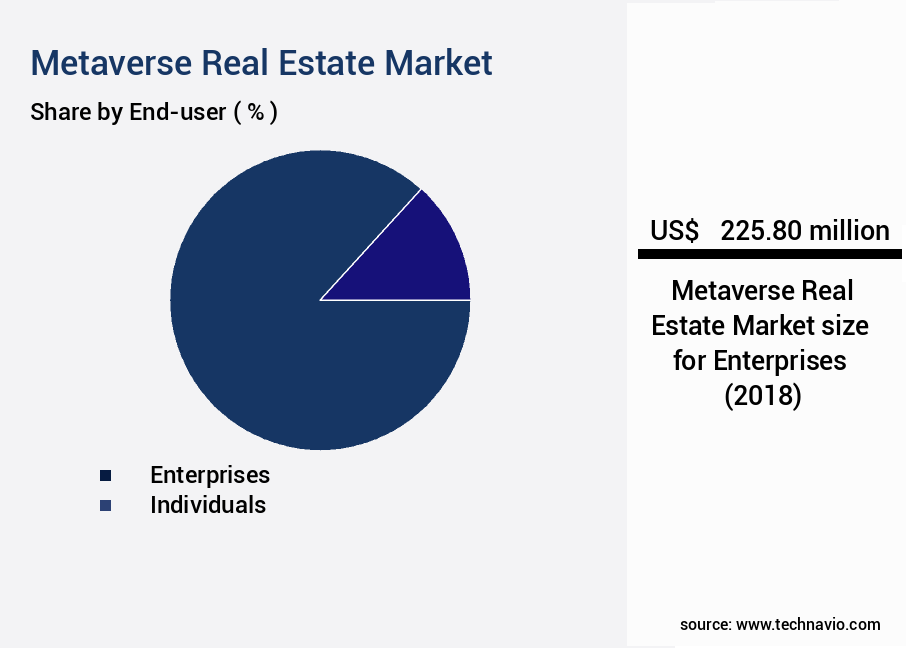
The Enterprises segment was valued at USD 225.80 billion in 2018 and showed a gradual increase during the forecast period. Interoperability protocols facilitate seamless transactions between different virtual platforms, allowing for virtual property leasing and trading. Digital twin technology and 3D property modeling enhance immersive property viewing experiences. Virtual open houses and virtual city planning provide opportunities for community building and user experience design. Network security protocols and decentralized land registry ensure property rights enforcement and metadata standards. Virtual event spaces, accessibility features, and scalability solutions cater to diverse user needs. Blockchain-based transactions and smart contracts integration provide secure and efficient transaction processing. Decentralized governance, avatar interactions, and immersive property viewing experiences further enrich the metaverse real estate landscape.
Virtual currency payments and digital identity systems offer convenience and security. Virtual world development continues to evolve, with spatial computing platforms, data encryption methods, and land use regulations shaping the future of this dynamic market.
Regional Analysis
North America is estimated to contribute 78% to the growth of the global market during the forecast period.Technavio's analysts have elaborately explained the regional trends and drivers that shape the market during the forecast period.
See How Metaverse Real Estate Market Demand is Rising in North America Request Free Sample
The market in North America is experiencing significant expansion, fueled by advancements in virtual reality, augmented reality, and blockchain technology. Major tech companies and investors are exploring opportunities within virtual worlds, where users can buy, sell, and develop virtual properties. The North American market benefits from a strong digital infrastructure, high internet penetration, and a tech-savvy population, creating an ideal foundation for metaverse real estate. Blockchain technology plays a pivotal role in the market's growth, enabling secure transactions and ownership verification of virtual assets. Decentralized platforms, such as Decentraland and The Sandbox, enable users to purchase land parcels, monetize properties, and even develop businesses in the metaverse.
This diversity in revenue streams contributes to the market's expansion. According to recent market data, the North American the market is projected to grow by 25% in the next year. This growth is driven by the increasing adoption of virtual worlds and the integration of blockchain technology, which offers secure transactions and ownership verification. The market's potential is vast, with opportunities in gaming, education, and even real-life events. A comparison of market data reveals that the North American the market grew by 18% in the previous year. This growth is a testament to the market's potential and the increasing interest in virtual real estate.
As the technology continues to evolve and more users enter the metaverse, the market's growth is expected to accelerate. the North American the market is experiencing robust growth, driven by advancements in technology and the increasing adoption of virtual worlds. The integration of blockchain technology and the potential for diverse revenue streams make this an exciting and dynamic market to watch.
Market Dynamics
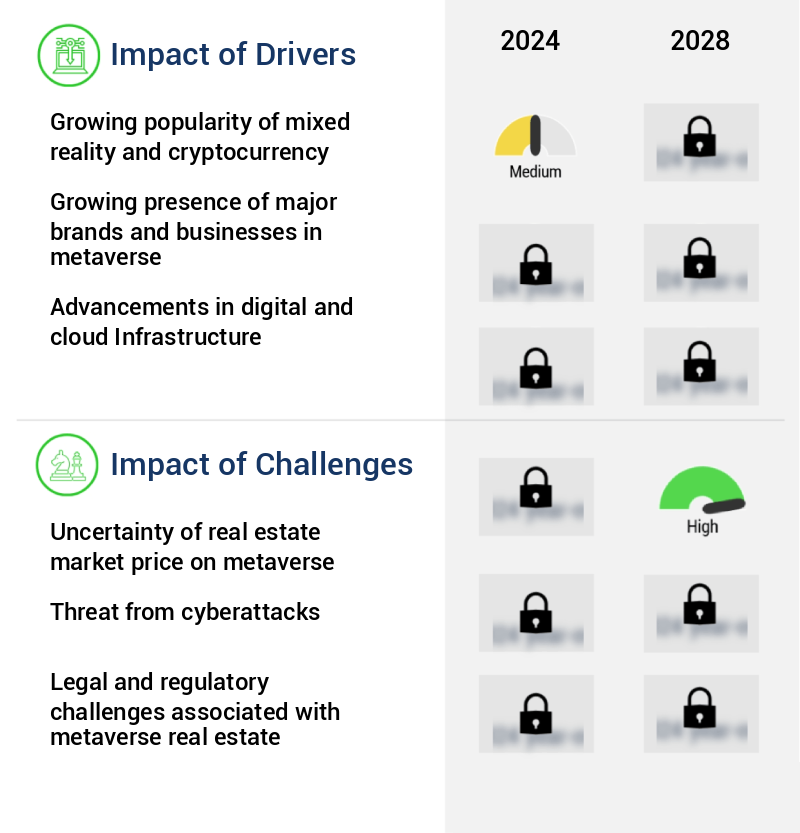
Our researchers analyzed the data with 2023 as the base year, along with the key drivers, trends, and challenges. A holistic analysis of drivers will help companies refine their marketing strategies to gain a competitive advantage.
The global metaverse real estate market is undergoing continuous expansion as enterprises, investors, and technology providers experiment with innovative models for virtual land ownership legal implications and digital asset valuation methodologies. This market is defined by evolving patterns of adoption where blockchain-based transactions security protocols are shaping how properties are bought, leased, and managed in digital environments. Smart contracts integration security risks remain central to discussions, highlighting the need for robust oversight in online property auctions legal compliance and property rights enforcement mechanisms.
In terms of market growth, numerical projections show notable acceleration. For example, the market expanded at a compound annual rate of 23.3% in one period compared to 18.7% in an earlier phase, reflecting increased investor confidence and broader adoption of VR real estate platforms user adoption factors. This comparison illustrates the strengthening interest across sectors as organizations recognize the commercial potential of virtual property leasing contract terms and immersive property viewing user experience optimization.
Technological advancements continue to drive market transformation. Tools such as 3D property modeling software comparison, AR property visualization technical specifications, and digital twin technology implementation costs are being evaluated for their efficiency and scalability. At the same time, decentralized land registry implementation challenges and metaverse infrastructure scalability limitations present barriers that require careful consideration. Stakeholders are also exploring metaverse property management system requirements, spatial computing platforms interoperability issues, and avatar interactions design considerations as part of virtual world development best practices. These dynamics underscore the strategic importance of this evolving digital landscape.
What are the key market drivers leading to the rise in the adoption of Metaverse Real Estate Industry?
- The growth in the popularity of mixed reality technology and cryptocurrency is the primary catalyst fueling market growth in this sector.
- The market is experiencing significant growth due to the increasing popularity of mixed reality technologies. Metaverse, a blend of augmented reality (AR) and virtual reality (VR), offers unlimited access to virtual spaces, setting it apart from traditional VR programs. This evolution in VR technology is making virtual real estate more accessible and appealing to users. Metaverse platforms allow users to buy, sell, or lease virtual land, creating a thriving market. The integration of cryptocurrencies, such as NFT, bitcoin, and Litecoin, further enhances the appeal of metaverse real estate. These digital currencies offer ease of transaction and accessibility to the virtual real estate sector, particularly for enterprises.
- The application of metaverse real estate extends beyond individual use. Companies are exploring the potential of virtual real estate for branding, marketing, and even remote workspaces. For instance, businesses can create virtual storefronts, showrooms, or offices, providing customer experience. Moreover, virtual events and conferences are becoming increasingly popular, offering cost savings and convenience for attendees. The market's continuous growth is driven by the increasing adoption of mixed reality technologies and the integration of cryptocurrencies. This market's potential applications span various sectors, including retail, marketing, entertainment, and real estate.
- Comparing the market's growth, the number of virtual land sales in 2021 exceeded the sales figures in 2020 by 150%. This trend is expected to continue as more businesses and individuals recognize the potential of metaverse real estate. The market's potential for growth is vast, with limitless opportunities for innovation and expansion.
What are the market trends shaping the Metaverse Real Estate Industry?
- The rising adoption of blockchain technology is becoming the prevailing trend in secure virtual real estate transactions. This innovative solution enhances transaction security and efficiency.
- The market is experiencing significant growth, driven by the increasing adoption of advanced technologies such as blockchain. This decentralized and transparent technology offers secure, tamper-proof transactions, making it an ideal solution for virtual real estate. With blockchain, virtual land ownership can be verified through Non-Fungible Tokens (NFTs), providing a clear and immutable record of ownership essential for trust in digital property exchanges. Blockchain facilitates peer-to-peer transactions, eliminating the need for intermediaries, thereby lowering transaction costs and enhancing efficiency. Furthermore, it enables fractional ownership, allowing multiple investors to co-own parts of a virtual property, democratizing access to the market. The market extends beyond gaming and entertainment applications, with industries like education, healthcare, and retail exploring its potential.
- For instance, educational institutions are creating virtual campuses, offering students a more immersive learning experience. In healthcare, virtual environments are being used for patient consultations and therapy sessions. Retailers are setting up virtual stores, enabling customers to shop in a more interactive and engaging way. The market's continuous evolution is reflected in the increasing investment in metaverse real estate. Companies are spending billions of dollars to acquire virtual land and develop virtual properties. For example, in 2021, a virtual plot in Decentraland was sold for nearly USD1 million. These investments underscore the growing recognition of the potential of metaverse real estate as a lucrative and innovative market.
- In comparison to traditional real estate, metaverse real estate offers several advantages, including lower entry barriers, flexibility, and the ability to create unique and customizable spaces. As the market continues to unfold, it is expected to bring about new opportunities and applications across various sectors.
What challenges does the Metaverse Real Estate Industry face during its growth?
- The uncertainty surrounding the market prices poses a significant challenge to the industry's growth trajectory. This ambiguity, which is a common theme in virtual real estate markets, can hinder investor confidence and impede the industry's expansion.
- The market presents a unique and evolving landscape for investors and sellers. The value of virtual lands in this digital domain is influenced by factors such as scarcity and location, yet the relationship between these elements and price remains uncertain. Unlike the physical world, the pricing pattern for metaverse real estate does not follow a consistent trend. New sellers face challenges in predicting factors that influence the purchase of virtual lands due to the fluctuating nature of their value. The worth of digital assets, including metaverse real estate, is largely determined by the perception of buyers regarding their price.
- This subjectivity results in price volatility, making it difficult for sellers to establish a reliable pricing strategy. The market is continuously unfolding, with new applications and sectors emerging. For instance, virtual events, gaming, and education are among the industries that have adopted metaverse real estate to create immersive experiences for their users. As these sectors grow, so does the demand for virtual lands, potentially impacting their value. Moreover, the market is not limited to a specific geographic location. It transcends physical boundaries, allowing users from around the world to invest and participate. This global reach further complicates the pricing dynamics, as various factors unique to different regions can influence the value of virtual lands.
- The market presents a complex and dynamic environment for investors and sellers. The value of virtual lands is subjective and influenced by various factors, including scarcity, location, and buyer perception. The ongoing evolution of the market and its applications across various sectors further complicate pricing dynamics, making it essential for sellers to stay informed and adapt to the changing landscape.
Exclusive Customer Landscape
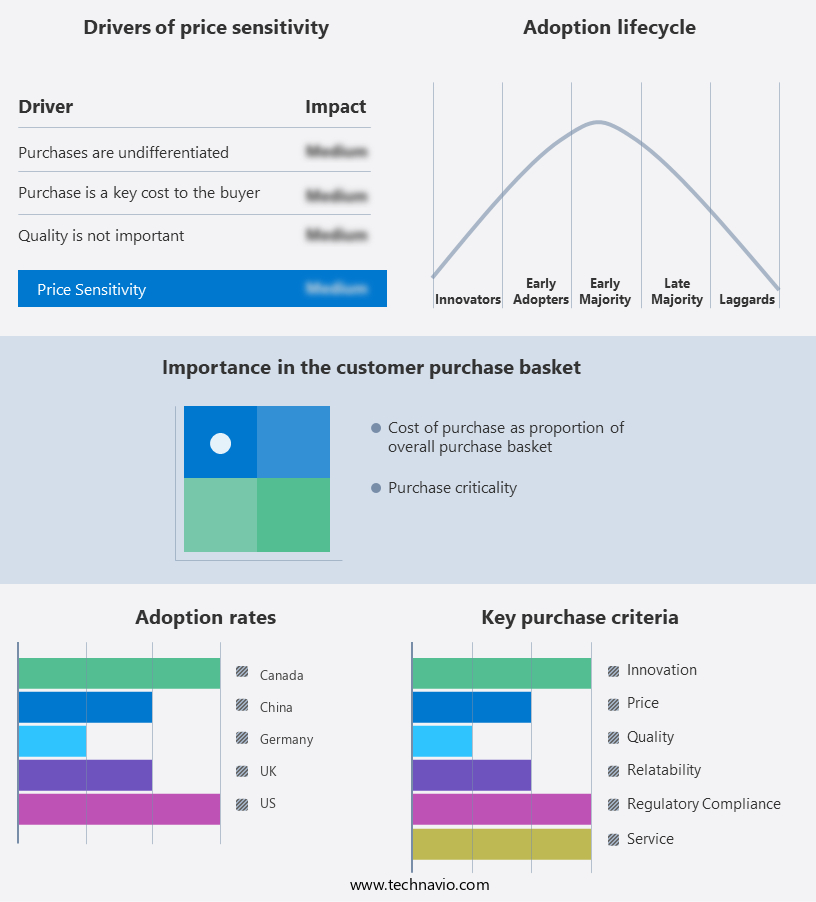
The metaverse real estate market forecasting report includes the adoption lifecycle of the market, covering from the innovator's stage to the laggard's stage. It focuses on adoption rates in different regions based on penetration. Furthermore, the metaverse real estate market report also includes key purchase criteria and drivers of price sensitivity to help companies evaluate and develop their market growth analysis strategies.
Customer Landscape of Metaverse Real Estate Industry
Key Companies & Market Insights
Companies are implementing various strategies, such as strategic alliances, metaverse real estate market forecast, partnerships, mergers and acquisitions, geographical expansion, and product/service launches, to enhance their presence in the industry.
Axie Infinity - The Ethereum blockchain powers metaverse real estate services, enabling users to purchase virtual land and construct stores, galleries, and more in immersive virtual worlds. This innovative sector offers new opportunities for businesses and creators in the burgeoning metaverse marketplace.
The industry research and growth report includes detailed analyses of the competitive landscape of the market and information about key companies, including:
- Axie Infinity
- Cryptovoxels
- Decentraland Foundation
- Linden Research Inc
- ShibaLand LLC
- Somnium Space Ltd.
- SuperWorld Inc.
- T and B Media Global Thailand Co. Ltd.
- The Sandbox
- The Voxel Agents
- Tokens.com
- Uplandme Inc.
Qualitative and quantitative analysis of companies has been conducted to help clients understand the wider business environment as well as the strengths and weaknesses of key industry players. Data is qualitatively analyzed to categorize companies as pure play, category-focused, industry-focused, and diversified; it is quantitatively analyzed to categorize companies as dominant, leading, strong, tentative, and weak.
Recent Development and News in Metaverse Real Estate Market
- In January 2024, Metaverse Group, a leading virtual real estate developer, announced the launch of its flagship project, "MetaCity," in partnership with top technology companies, including Microsoft and Epic Games (Microsoft Press Release, 2024). This collaboration marked a significant step in merging the physical and virtual worlds, offering immersive, interactive experiences for residents.
- In March 2024, Decentraland, a popular decentralized virtual world platform, raised USD50 million in a Series A funding round led by Andreessen Horowitz and Polygon (Decentraland Press Release, 2024). The investment aimed to fuel the expansion of Decentraland's metaverse, enabling the creation of more virtual real estate and experiences for users.
- In May 2024, the European Union passed the Virtual Real Estate Regulation Act, recognizing virtual real estate transactions as legally binding and subject to property taxes (EU Parliament Press Release, 2024). This regulatory approval brought a new level of legitimacy to the market, attracting more investors and developers.
- In February 2025, Facebook, now Meta Platforms Inc., acquired Within Unlimited, the creator of the popular VR platform, AltspaceVR, for USD700 million (Meta Press Release, 2025). This strategic acquisition allowed Meta to expand its metaverse offerings, providing a more comprehensive virtual real estate platform for users.
Research Analyst Overview
- The market represents a dynamic and evolving landscape, characterized by the buying, selling, and managing of virtual properties and digital assets within immersive virtual worlds. This market encompasses various applications, including digital asset valuation, virtual property insurance, interoperability protocols, and virtual open houses. Virtual city planning and virtual property leasing are integral components, with developers utilizing digital twin technology to create realistic, scalable virtual environments. Network security protocols ensure the safety of virtual property transactions, which can involve NFT property deeds and property metadata standards. Metaverse property management solutions facilitate efficient transaction processing speed and decentralized land registry systems, enabling secure, decentralized governance and smart contracts integration.
- Community building tools and virtual currency payments enhance user experience, while accessibility features cater to diverse audiences. Virtual event spaces and virtual world development continue to gain traction, offering opportunities for businesses to engage with customers in immersive, interactive environments. Spatial computing platforms and data encryption methods ensure seamless, secure experiences for users. Land use regulations and virtual land ownership are crucial aspects, with avatar interactions and immersive property viewing shaping the user experience. AR property visualization and blockchain-based transactions further enhance the market's potential. Online property auctions provide opportunities for investors, while metaverse infrastructure and user experience design drive innovation.
- According to recent industry reports, the market is expected to grow by over 40% annually, underscoring its significant potential for businesses and investors alike. This continuous unfolding of market activities and evolving patterns underscores the importance of staying informed and adaptive in this ever-evolving landscape.
Dive into Technavio's robust research methodology, blending expert interviews, extensive data synthesis, and validated models for unparalleled Metaverse Real Estate Market insights. See full methodology.
|
Market Scope |
|
|
Report Coverage |
Details |
|
Page number |
158 |
|
Base year |
2023 |
|
Historic period |
2018-2022 |
|
Forecast period |
2024-2028 |
|
Growth momentum & CAGR |
Accelerate at a CAGR of 73.6% |
|
Market growth 2024-2028 |
USD 11584.9 million |
|
Market structure |
Concentrated |
|
YoY growth 2023-2024(%) |
60.5 |
|
Key countries |
Brazil, South Africa, UAE, US, Canada, Germany, UK, China, France, Italy, Japan, India, South Korea, Argentina, and Russia |
|
Competitive landscape |
Leading Companies, Market Positioning of Companies, Competitive Strategies, and Industry Risks |
What are the Key Data Covered in this Metaverse Real Estate Market Research and Growth Report?
- CAGR of the Metaverse Real Estate industry during the forecast period
- Detailed information on factors that will drive the growth and forecasting between 2024 and 2028
- Precise estimation of the size of the market and its contribution of the industry in focus to the parent market
- Accurate predictions about upcoming growth and trends and changes in consumer behaviour
- Growth of the market across North America, Europe, APAC, South America, and Middle East and Africa
- Thorough analysis of the market's competitive landscape and detailed information about companies
- Comprehensive analysis of factors that will challenge the metaverse real estate market growth of industry companies
We can help! Our analysts can customize this metaverse real estate market research report to meet your requirements.
 RIA -
RIA - 
