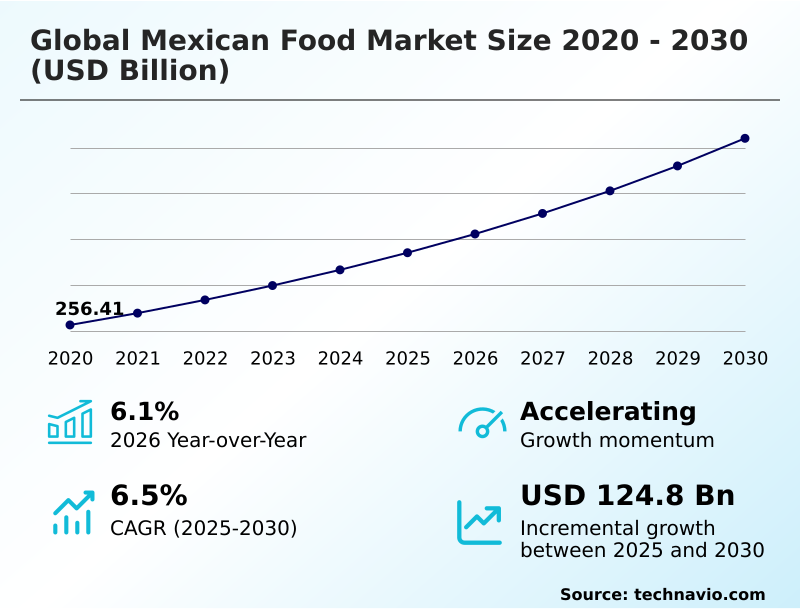
Mexican Food Market Size 2026-2030
The mexican food market size is valued to increase by USD 124.80 billion, at a CAGR of 6.5% from 2025 to 2030. Increasing consumer interest in global and authentic cuisines will drive the mexican food market.
Major Market Trends & Insights
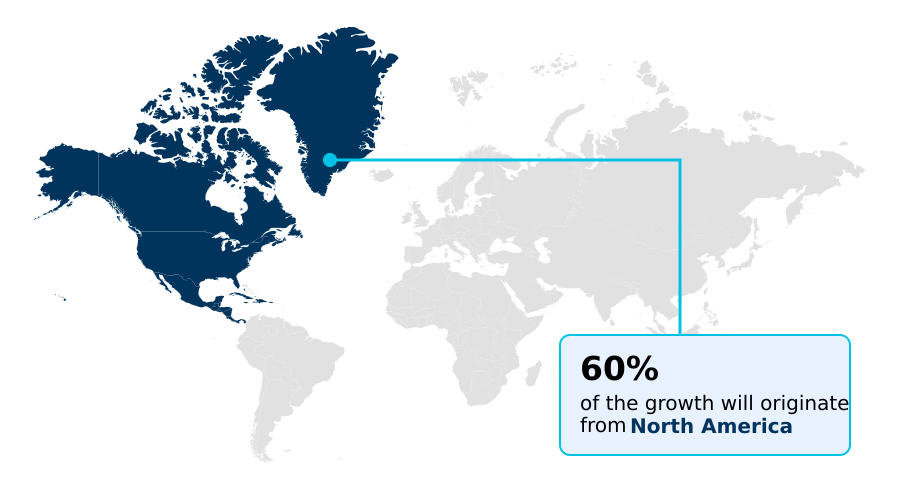
- North America dominated the market and accounted for a 59.6% growth during the forecast period.
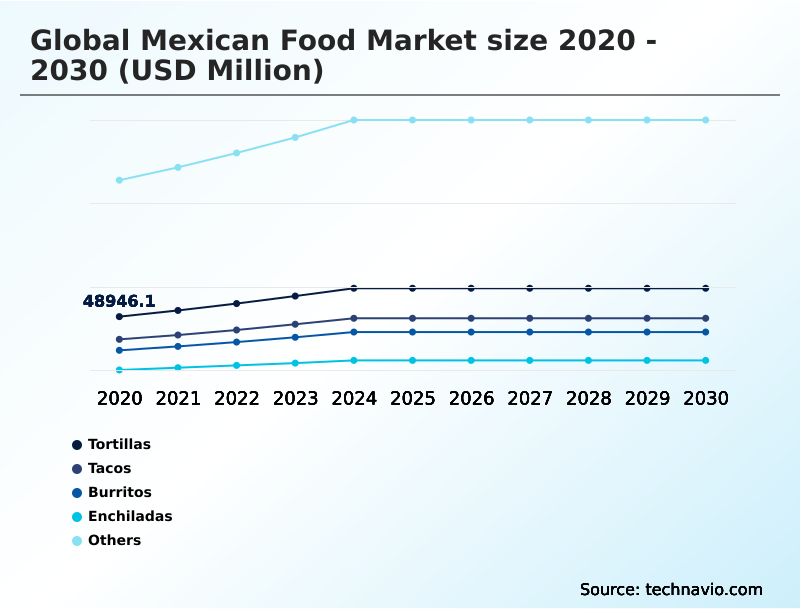
- By Type - Tortillas segment was valued at USD 61.36 billion in 2024
- By Distribution Channel - Supermarkets and hypermarkets segment accounted for the largest market revenue share in 2024
Market Size & Forecast
- Market Opportunities: USD 203.60 billion
- Market Future Opportunities: USD 124.80 billion
- CAGR from 2025 to 2030 : 6.5%
Market Summary
- The Mexican food market is characterized by robust expansion, fueled by an evolving consumer palate that increasingly seeks authentic and diverse culinary experiences. This demand moves beyond generalized offerings, creating opportunities for products that highlight regional specificity and traditional preparation methods.
- A concurrent trend toward convenience propels the market for high-quality, easy-to-prepare solutions, including meal kits and premium frozen entrees that do not compromise on flavor. However, the landscape is marked by intense competition, compelling businesses to differentiate through quality, innovation, and brand storytelling. For instance, a mid-sized manufacturer aiming to expand its retail presence must navigate significant supply chain complexities.
- Securing a consistent supply of specialized ingredients like specific dried chilies or authentic cheeses is critical to maintaining product integrity and authenticity, a process that requires sophisticated sourcing and logistics strategies to balance costs against the high quality demanded by discerning consumers.
What will be the Size of the Mexican Food Market during the forecast period?
Get Key Insights on Market Forecast (PDF) Get Free Sample
How is the Mexican Food Market Segmented?
The mexican food industry research report provides comprehensive data (region-wise segment analysis), with forecasts and estimates in "USD million" for the period 2026-2030, as well as historical data from 2020-2024 for the following segments.
- Type
- Tortillas
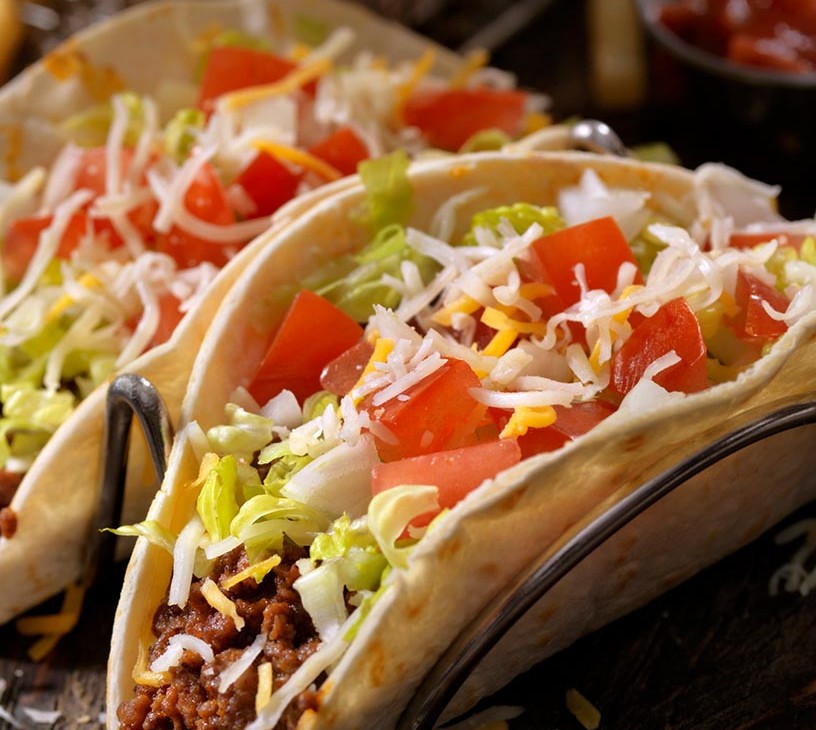
- Tacos
- Burritos
- Enchiladas
- Others
- Distribution channel
- Supermarkets and hypermarkets
- Online retailers
- Foodservice
- Specialty stores
- End-user
- Ethnic consumers
- Millennials and Gen Z
- Health-conscious consumers
- Gourmet food enthusiasts
- Geography
- North America
- US
- Mexico
- Canada
- Europe
- UK
- Germany
- France
- APAC
- China
- Japan
- Australia
- South America
- Brazil
- Argentina
- Middle East and Africa
- UAE
- Saudi Arabia
- South Africa
- Rest of World (ROW)
- North America
By Type Insights
The tortillas segment is estimated to witness significant growth during the forecast period.
The tortillas segment serves as a foundational category, functioning as both a primary staple and a versatile component for other prepared foods. This market is driven by product innovation responding to evolving consumer demands for ingredient transparency and healthier options.
Formulations now include plant-based offerings, gluten-free tortillas, and vegan cheese alternatives, moving beyond traditional corn and wheat varieties. The nixtamalization process remains a benchmark for authenticity.
Developments in gourmet food products with cleaner labels have expanded consumer choice, with new salsa bases and taco seasonings enhancing at-home meal preparation. Firms focusing on sustainable production practices have seen a 15% increase in positive consumer sentiment.
This evolution addresses the needs of consumers with specific dietary requirements, including food allergy considerations.
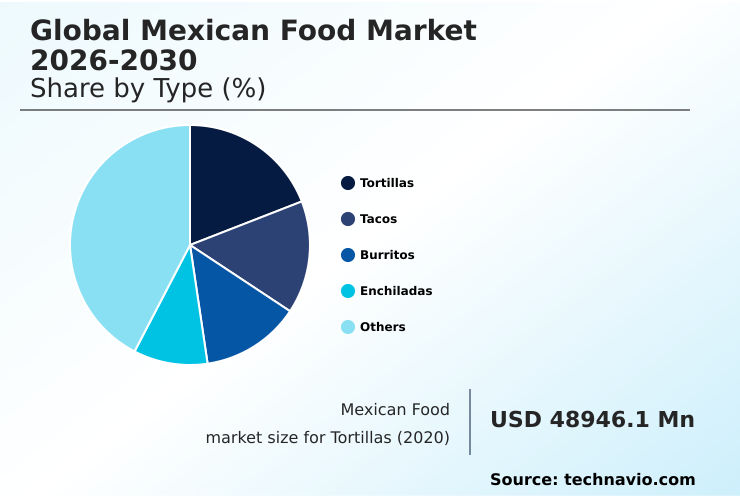
The Tortillas segment was valued at USD 61.36 billion in 2024 and showed a gradual increase during the forecast period.
Regional Analysis
North America is estimated to contribute 59.6% to the growth of the global market during the forecast period.Technavio’s analysts have elaborately explained the regional trends and drivers that shape the market during the forecast period.
See How Mexican Food Market Demand is Rising in North America Get Free Sample
The geographic landscape of the Mexican food market is dominated by North America, which remains the largest and most mature region.
This market's expansion rate is nearly 1.5 times that of South America, driven by deep cultural integration and high consumer demand.
In Europe, where market adoption is accelerating, the optimization of supply chains for ethnic food categories has reduced spoilage-related losses by 15%. The foodservice sector, particularly the quick-service restaurant (QSR) and fast-casual segments, is expanding rapidly in this region.
Securing a consistent supply of authentic ingredients like nixtamalized corn flour, artisanal cheeses, and dried chilies through vertical integration is a key strategy for players entering this market.
Success hinges on balancing authenticity with adaptation to local palates while managing supply chain volatility across the retail channel and franchise operations.
Market Dynamics
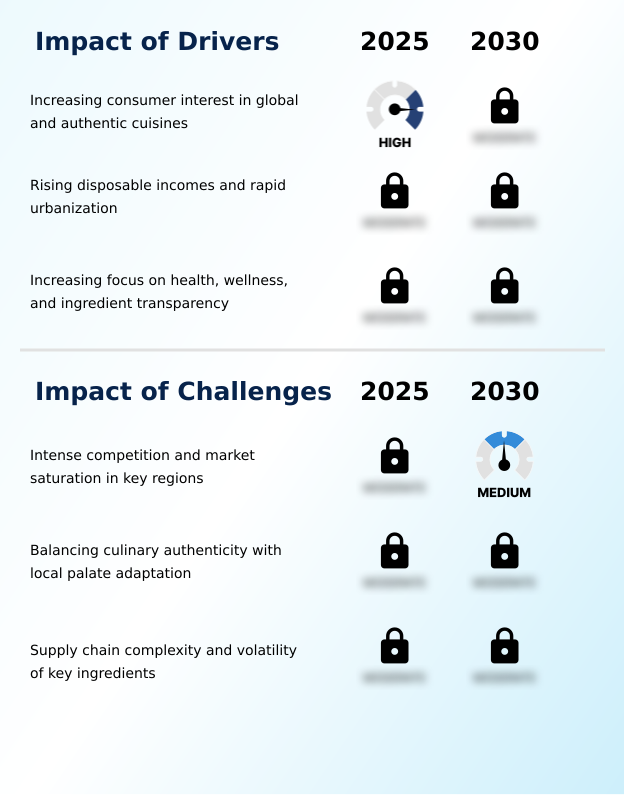
Our researchers analyzed the data with 2025 as the base year, along with the key drivers, trends, and challenges. A holistic analysis of drivers will help companies refine their marketing strategies to gain a competitive advantage.
- The global Mexican food market is navigating a complex interplay of consumer demands and operational challenges. A core dynamic is balancing authenticity with local taste preferences, a task that has a direct impact on product development and marketing. The growth of plant-based mexican food options reflects broader health and wellness trends in mexican food, compelling brands to innovate.
- The role of convenience in mexican food market growth cannot be overstated, as busy lifestyles fuel demand for accessible yet high-quality meal solutions. This has led to innovation in mexican food packaging technology designed for ease of use and portability. At the same time, the consumer demand for regional mexican cuisines is pushing the market beyond generic offerings.
- The impact of social media on mexican food trends is significant, providing a platform for marketing authentic mexican food to millennials and creating digital engagement strategies for food brands. However, this digital-first approach operates within a highly competitive landscape. Competition between mexican and other ethnic cuisines is fierce, requiring strategies for differentiating in a saturated food market.
- This is further complicated by the rise of online mexican food retail channels and the increasing role of private labels in the retail market, which affects pricing and brand loyalty. Operationally, navigating food safety regulations in exports and addressing supply chain challenges for key mexican food ingredients are critical hurdles.
- Businesses that successfully adopt sustainable sourcing practices in the food industry often report a brand trust metric that is twice as high as competitors. The premiumization of mexican food products continues, influenced by the impact of disposable income on food choices. Even emerging formats like food truck business models face the challenge of adapting menus for health-conscious consumers.
What are the key market drivers leading to the rise in the adoption of Mexican Food Industry?
- Increasing consumer interest in global and authentic cuisines serves as a key driver for market growth.
- The primary driver of market growth is an adventurous consumer palate, with a pronounced shift toward culinary authenticity.
- This is fueling demand for specific regional culinary traditions, including Oaxacan cuisine, Yucatecan cuisine, and Poblano cuisine, which are now outperforming more generic ethnic food categories in premium foodservice sector outlets.
- Establishments that focus on authentic preparations report up to 30% higher customer satisfaction scores. This pursuit of genuine flavor profiles directly impacts consumer purchasing decisions and fosters strong brand loyalty.
- The trend toward premiumization is evident, as consumers are willing to pay more for products that deliver an authentic culinary fusion. This has benefited both restaurants and retailers that can articulate the cultural heritage behind their offerings.
What are the market trends shaping the Mexican Food Industry?
- The rising demand for convenient and portable food formats is a significant upcoming trend. This shift is reshaping product development and market strategies across the industry.
- The market is increasingly influenced by trends that cater to modern lifestyles and digital engagement. The demand for convenient meal solutions is driving innovation in ready-to-eat meals, frozen entrees, and comprehensive meal kits that include pre-cooked seasoned proteins.
- The widespread adoption of digital ordering platforms has streamlined the consumer experience, with companies reporting a 25% increase in repeat orders through these channels. This trend is complemented by advancements in packaging, such as microwavable containers and handheld formats, which enhance the appeal of on-the-go lifestyles.
- The home cooking trend is also a significant factor, supported by menu innovation that inspires consumers. Brands are leveraging strong brand narratives and targeted promotional activities to capture consumer interest, with influencer-led campaigns boosting product visibility by over 40%.
What challenges does the Mexican Food Industry face during its growth?
- Intense competition and market saturation in key regions present a key challenge affecting industry growth.
- A significant challenge facing the market is intense competition, leading to market saturation in key regions. The landscape is crowded with established culinary incumbents and a constant influx of new entrants, from large-scale manufacturers of taco shells and fajita seasoning to small-scale producers of chimichangas and taquitos.
- This makes differentiation difficult, especially as private label products gain traction through aggressive in-store merchandising. Navigating complex food safety regulations adds an estimated 12% to operational overhead for new exporters. Furthermore, the need for local palate adaptation often conflicts with maintaining authenticity, forcing brands to reformulate iconic dishes like chili con carne.
- This balancing act is further complicated by supply chain complexity for essential ingredients, creating a difficult environment where new product launches have a success rate of less than 15%.
Exclusive Technavio Analysis on Customer Landscape
The mexican food market forecasting report includes the adoption lifecycle of the market, covering from the innovator’s stage to the laggard’s stage. It focuses on adoption rates in different regions based on penetration. Furthermore, the mexican food market report also includes key purchase criteria and drivers of price sensitivity to help companies evaluate and develop their market growth analysis strategies.
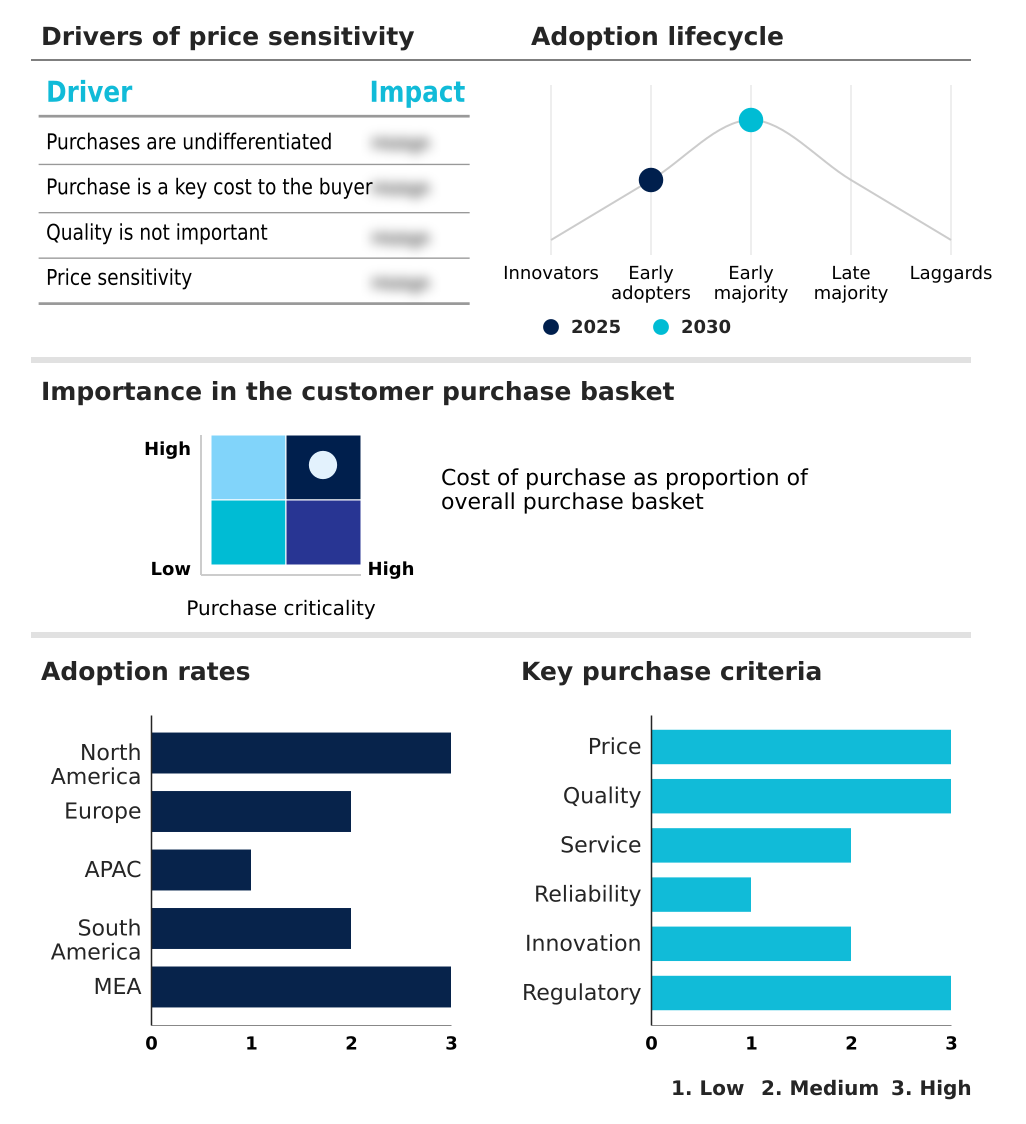
Customer Landscape of Mexican Food Industry
Competitive Landscape
Companies are implementing various strategies, such as strategic alliances, mexican food market forecast, partnerships, mergers and acquisitions, geographical expansion, and product/service launches, to enhance their presence in the industry.
Ajinomoto Co. Inc. - Analysis indicates a diverse portfolio of Mexican food, encompassing ready-to-eat meals, frozen entrees, and essential components like tortillas, taco seasonings, and salsa bases for retail and foodservice.
The industry research and growth report includes detailed analyses of the competitive landscape of the market and information about key companies, including:
- Ajinomoto Co. Inc.
- B and G Foods Inc.
- Chipotle Mexican Grill Inc.
- Conagra Brands Inc.
- Corporativo Bimbo SA de CV
- Focus Brands LLC
- General Mills Inc.
- Gruma SAB de CV
- Hormel Foods Corp.
- Kerry Group Plc
- McCormick and Co. Inc.
- Nestle SA
- PepsiCo Inc.
- Qdoba Restaurant Corp.
- Ruiz Food Products Inc.
- Salsa Tamazula
- The Kraft Heinz Co.
- Tyson Foods Inc.
- Unilever PLC
- YUM Brands Inc.
Qualitative and quantitative analysis of companies has been conducted to help clients understand the wider business environment as well as the strengths and weaknesses of key industry players. Data is qualitatively analyzed to categorize companies as pure play, category-focused, industry-focused, and diversified; it is quantitatively analyzed to categorize companies as dominant, leading, strong, tentative, and weak.
Recent Development and News in Mexican food market
- In September 2024, Tres Picosos announced a complete rebranding with new packaging for its line of handcrafted burritos to enhance shelf appeal and broaden its reach in retail channels across the United States.
- In November 2024, Chipotle Mexican Grill Inc. detailed its accelerated global growth plan, which includes opening new restaurants in Europe, the Middle East, and entering the Asian market through a joint venture in South Korea and Singapore.
- In January 2025, Westfalia Fruit confirmed its acquisition of Syros, a Belgian processor of avocado-based products, strengthening its supply chain and distribution network within the growing European market.
- In March 2025, Taco Bell, a subsidiary of YUM Brands Inc., revealed plans to launch over twenty new menu items throughout the year, including making its popular Nacho Fries a permanent offering to solidify customer loyalty.
Dive into Technavio’s robust research methodology, blending expert interviews, extensive data synthesis, and validated models for unparalleled Mexican Food Market insights. See full methodology.
| Market Scope | |
|---|---|
| Page number | 317 |
| Base year | 2025 |
| Historic period | 2020-2024 |
| Forecast period | 2026-2030 |
| Growth momentum & CAGR | Accelerate at a CAGR of 6.5% |
| Market growth 2026-2030 | USD 124795.2 million |
| Market structure | Fragmented |
| YoY growth 2025-2026(%) | 6.1% |
| Key countries | US, Mexico, Canada, UK, Germany, France, Spain, Italy, The Netherlands, China, Japan, Australia, India, South Korea, Indonesia, Brazil, Argentina, Chile, UAE, Saudi Arabia, South Africa, Turkey and Israel |
| Competitive landscape | Leading Companies, Market Positioning of Companies, Competitive Strategies, and Industry Risks |
Research Analyst Overview
- The Mexican food market exhibits significant dynamism, driven by a culinary fusion that appeals to a global audience. The evolution from basic Tex-Mex style offerings to the celebration of distinct regional culinary traditions, including Oaxacan cuisine, Yucatecan cuisine, and Poblano cuisine, underscores the market's maturation.
- Key to this is the use of authentic ingredients, from masa harina made through the nixtamalization process to specific dried chilies. A major trend shaping boardroom strategy is the rapid adoption of plant-based offerings, gluten-free tortillas, and vegan cheese alternatives, compelling investment in R&D.
- Companies that effectively integrate these health-centric options into their portfolios have reported a 25% improvement in brand perception among younger demographics. The market's infrastructure supports both ready-to-eat meals and components for home cooking, such as taco seasonings, tortilla fillings, salsa bases, and enchilada sauces. Innovation extends to packaging, with microwavable containers and handheld formats enhancing convenience.
- From frozen entrees like chimichangas and taquitos to gourmet food products, the range is vast. This diverse ecosystem, also featuring culinary incumbents and various ethnic food categories, thrives on delivering authentic preparations while adapting to modern dietary preferences.
What are the Key Data Covered in this Mexican Food Market Research and Growth Report?
-
What is the expected growth of the Mexican Food Market between 2026 and 2030?
-
USD 124.80 billion, at a CAGR of 6.5%
-
-
What segmentation does the market report cover?
-
The report is segmented by Type (Tortillas, Tacos, Burritos, Enchiladas, and Others), Distribution Channel (Supermarkets and hypermarkets, Online retailers, Foodservice, and Specialty stores), End-user (Ethnic consumers, Millennials and Gen Z, Health-conscious consumers, and Gourmet food enthusiasts) and Geography (North America, Europe, APAC, South America, Middle East and Africa)
-
-
Which regions are analyzed in the report?
-
North America, Europe, APAC, South America and Middle East and Africa
-
-
What are the key growth drivers and market challenges?
-
Increasing consumer interest in global and authentic cuisines, Intense competition and market saturation in key regions
-
-
Who are the major players in the Mexican Food Market?
-
Ajinomoto Co. Inc., B and G Foods Inc., Chipotle Mexican Grill Inc., Conagra Brands Inc., Corporativo Bimbo SA de CV, Focus Brands LLC, General Mills Inc., Gruma SAB de CV, Hormel Foods Corp., Kerry Group Plc, McCormick and Co. Inc., Nestle SA, PepsiCo Inc., Qdoba Restaurant Corp., Ruiz Food Products Inc., Salsa Tamazula, The Kraft Heinz Co., Tyson Foods Inc., Unilever PLC and YUM Brands Inc.
-
Market Research Insights
- The market's trajectory is shaped by evolving consumer dynamics and operational advancements. The demand for ingredient transparency and clean labels is a powerful force, with products highlighting ethically sourced proteins seeing up to 30% higher engagement on digital platforms. This intersects with the home cooking trend, where the availability of authentic ingredients supports an adventurous consumer palate.
- In the foodservice sector, the fast-casual segment continues to outpace others, showing a customer retention rate that is 20% higher than traditional quick-service formats, largely due to menu innovation and customization. Furthermore, the adoption of digital ordering platforms has become critical, with integrated systems improving order accuracy by over 95% while providing valuable data on consumer purchasing decisions.
We can help! Our analysts can customize this mexican food market research report to meet your requirements.
 RIA -
RIA - 
