Military Laser Systems Market Analysis, Size, and Forecast 2026-2030: North America (US, Canada, and Mexico), APAC (China, India, and Japan), Europe (Germany, UK, and France), Middle East and Africa (Israel, Saudi Arabia, and UAE), South America (Brazil and Argentina), and Rest of World (ROW)

Military Laser Systems Market Analysis, Size, and Forecast 2026-2030:
North America (US, Canada, and Mexico), APAC (China, India, and Japan), Europe (Germany, UK, and France), Middle East and Africa (Israel, Saudi Arabia, and UAE), South America (Brazil and Argentina), and Rest of World (ROW)

Published: Jan 2026 298 Pages SKU: IRTNTR45251

Market Overview at a Glance

$1.99 B
Market Opportunity
6.2%
CAGR 2025 - 2030
41.3%
North America Growth
$2.74 B
Laser weapon systems segment 2024

Military Laser Systems Market Size 2026-2030

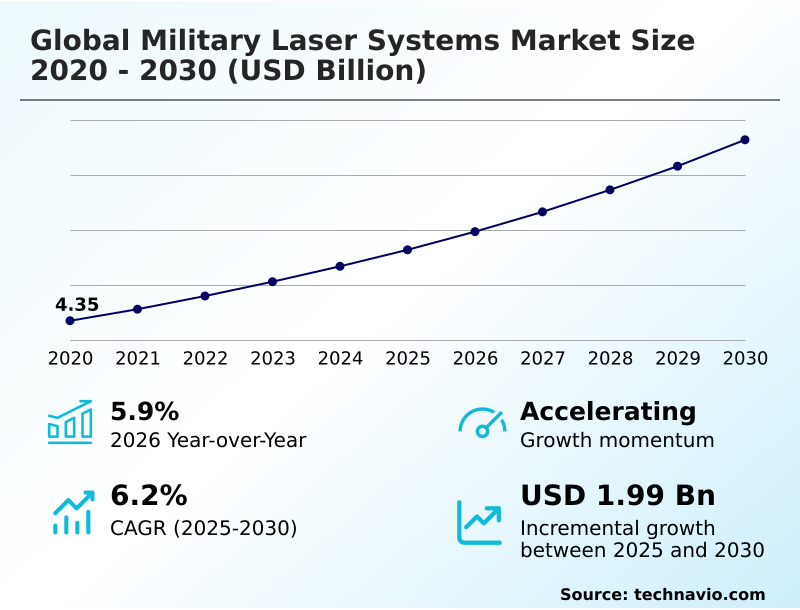
The military laser systems market size is valued to increase by USD 1.99 billion, at a CAGR of 6.2% from 2025 to 2030. Favorable cost-exchange ratio compared to kinetic interceptors will drive the military laser systems market.

Major Market Trends & Insights

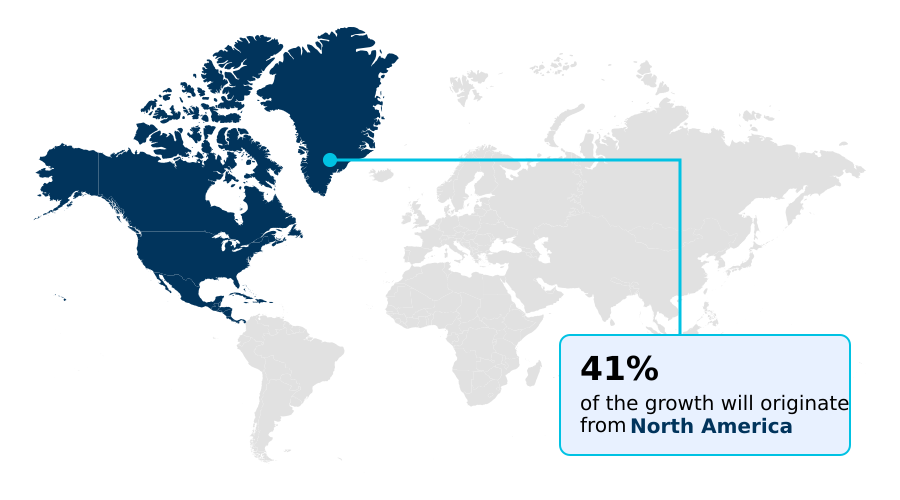
  • North America dominated the market and accounted for a 41.3% growth during the forecast period.
  • By Product Type - Laser weapon systems segment was valued at USD 2.74 billion in 2024
  • By Application - Non-weapons segment accounted for the largest market revenue share in 2024

Market Size & Forecast

  • Market Opportunities: USD 3.29 billion
  • Market Future Opportunities: USD 1.99 billion
  • CAGR from 2025 to 2030 : 6.2%

Market Summary

  • The Military Laser Systems Market is undergoing a strategic transformation, pivoting from traditional kinetic interceptors to directed energy solutions. This shift is motivated by the need to counter asymmetric threats, such as unmanned aerial systems and mortar projectiles, in a more financially sustainable manner. The core appeal lies in the low cost-per-shot and deep magazine capacity inherent to laser technology.
  • Key advancements in solid-state and fiber lasers, coupled with innovations in beam combining and thermal management, are enabling the development of more compact, powerful, and ruggedized systems. Consequently, high-energy lasers are being integrated into a variety of platforms, including naval vessels, armored vehicles, and aircraft.
  • However, operational deployment faces hurdles such as atmospheric interference and the immense power and cooling requirements for high-power systems. For instance, a defense contractor must now balance R&D investments between scaling laser power and perfecting AI-driven adaptive optics to ensure beam quality remains effective over tactical distances, directly impacting their long-term product viability and supply chain strategy.

What will be the Size of the Military Laser Systems Market during the forecast period?

Get Key Insights on Market Forecast (PDF) Request Free Sample

How is the Military Laser Systems Market Segmented?

The military laser systems industry research report provides comprehensive data (region-wise segment analysis), with forecasts and estimates in "USD million" for the period 2026-2030, as well as historical data from 2020-2024 for the following segments.
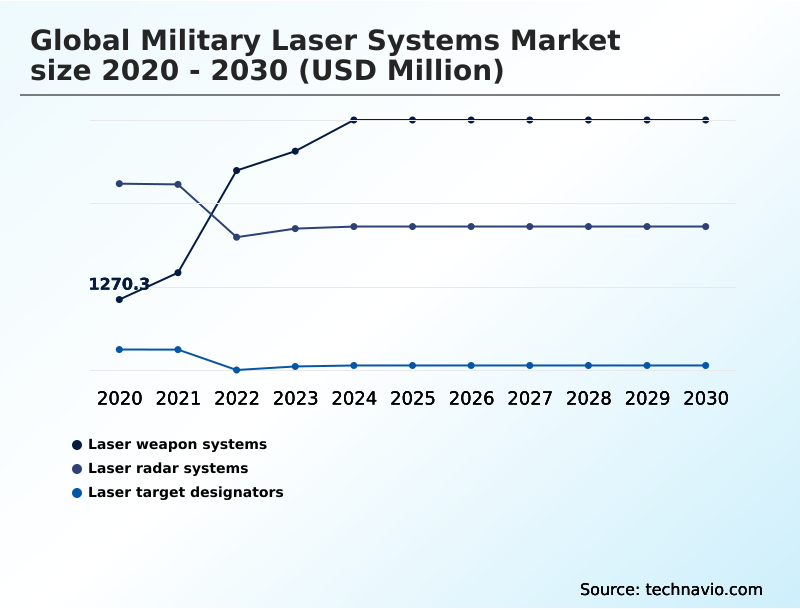
  • Product type
    • Laser weapon systems
    • Laser radar systems
    • Laser target designators
  • Application
    • Non-weapons
    • Weapons
  • Power output
    • 10 kW TO 100 kW
    • More than 100 kW
    • 10 kW
  • Geography
    • North America
      • US
      • Canada
      • Mexico
    • APAC
      • China
      • India
      • Japan
    • Europe
      • Germany
      • UK
      • France
    • Middle East and Africa
      • Israel
      • Saudi Arabia
      • UAE
    • South America
      • Brazil
      • Argentina
    • Rest of World (ROW)

By Product Type Insights

The laser weapon systems segment is estimated to witness significant growth during the forecast period.

The laser weapon systems segment is shifting from demonstration units to operationally deployed systems. These hard-kill defensive systems utilize a high-energy laser to neutralize threats, offering a superior cost-exchange ratio compared to kinetic interceptors.

A primary driver is the ability to engage unmanned aerial systems and cruise missiles effectively. Technological advances in scalable laser architecture and laser power scaling allow for outputs exceeding 300 kilowatts, essential for hardened targets.

Defense agencies are integrating these systems onto diverse platforms, including naval laser weapon system and ground-based air defense vehicles. This operational pivot reduces engagement costs by over 95% in certain scenarios.

Key technologies include LIDAR systems and electro-optical/infrared sensors, which are crucial for the target acquisition system. Progress in this area is a focus of naval laser defense integration and airborne laser weapon development.

Request Free Sample

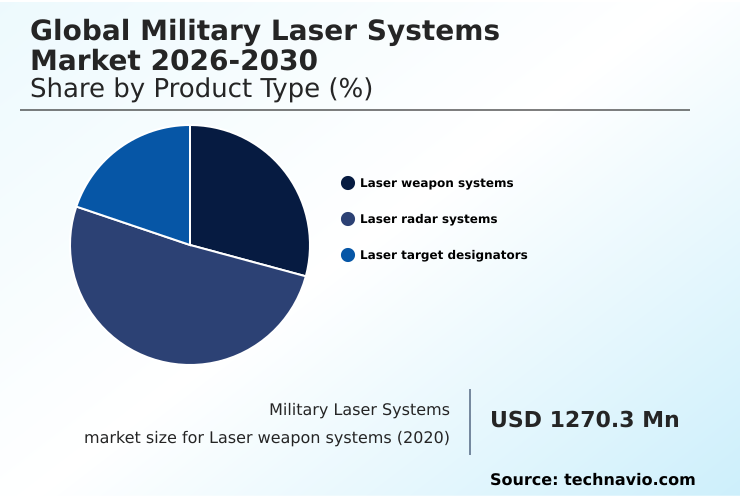
The Laser weapon systems segment was valued at USD 2.74 billion in 2024 and showed a gradual increase during the forecast period.

Request Free Sample

Regional Analysis

North America is estimated to contribute 41.3% to the growth of the global market during the forecast period.Technavio’s analysts have elaborately explained the regional trends and drivers that shape the market during the forecast period.

See How Military Laser Systems Market Demand is Rising in North America Request Free Sample

The geographic landscape of the Military Laser Systems Market is led by North America, which is projected to contribute over 41% of the market's incremental growth, driven by substantial US investment in short-range air defense programs using directed energy weapons.

Concurrently, APAC is experiencing rapid expansion due to geopolitical tensions, with nations focusing on indigenous research into airborne laser systems and laser radar.

Europe is advancing through collaborative programs focused on creating sovereign capabilities, with a strong emphasis on naval applications and laser jamming technologies.

The successful deployment of Israel's Iron Beam system has demonstrated an operational cost reduction of over 98% for certain interception scenarios, setting a new benchmark for cost-exchange ratio analysis. Such hybrid kinetic-laser defense models are influencing global procurement.

The market is also seeing advances in space-based laser technology and shipboard laser weapon integration.
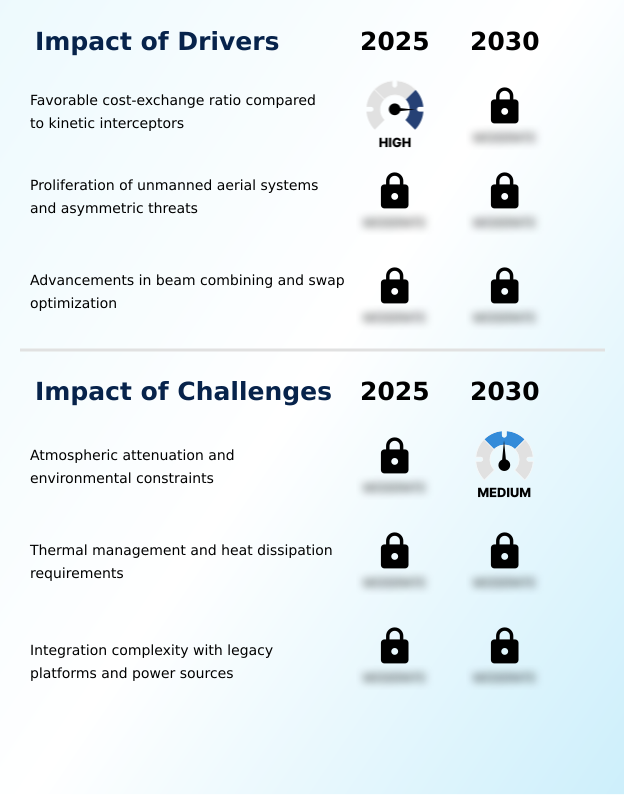
Market Dynamics

Our researchers analyzed the data with 2025 as the base year, along with the key drivers, trends, and challenges. A holistic analysis of drivers will help companies refine their marketing strategies to gain a competitive advantage.

  • The strategic calculus for adopting directed energy is increasingly shaped by a detailed analysis of the cost-exchange ratio of laser weapons compared to legacy munitions. This financial driver is compelling military planners to prioritize SWaP optimization for mobile laser systems, enabling deployment on a wider range of tactical platforms.
  • However, the laser effectiveness in adverse weather conditions remains a significant technical hurdle, prompting a strategic move toward layered defense with kinetic and laser systems to ensure all-weather capability. A critical element in improving performance is the use of AI algorithms in advanced laser targeting, which compensates for atmospheric turbulence and enhances precision.
  • Development efforts are also targeting high-energy laser for counter-hypersonic threats, pushing the boundaries of power and beam control. Addressing thermal management challenges in HEL systems is paramount, as inefficient cooling can severely limit operational endurance. To achieve higher outputs, engineers rely on spectral beam combining for power scaling, a complex but essential technique.
  • The difficulty of integrating laser weapons on legacy platforms, which often lack sufficient power and cooling, remains a major logistical challenge. The focus on solid-state laser reliability in combat underscores the demand for robust, field-tested solutions.
  • Meanwhile, applications for a non-lethal laser dazzler for crowd control and improving laser rangefinder accuracy for artillery continue to expand the technology's utility beyond hard-kill missions.

What are the key market drivers leading to the rise in the adoption of Military Laser Systems Industry?

  • The market's growth is primarily driven by the favorable cost-exchange ratio that military laser systems offer when compared to traditional kinetic interceptors.

  • The primary market driver remains the unparalleled cost-exchange ratio, as a directed energy weapon can neutralize low-cost aerial threats for less than 1% of the cost of a traditional missile interceptor. This economic advantage is fueling directed energy weapon proliferation.
  • A second major driver is the need to counter asymmetric threats like drone swarms, which has accelerated investment in counter-UAS laser effectiveness. Technological maturity, particularly in size, weight, and power (SWaP) optimization, is a critical enabler.
  • Recent efforts in developing compact laser weapon systems have reduced the physical footprint of mobile units by over 50%, enabling integration onto a wider array of tactical vehicles.
  • This facilitates the deployment of mobile laser air defense platforms and supports future soldier laser systems with ruggedized military optronics.

What are the market trends shaping the Military Laser Systems Industry?

  • A key trend influencing the market is the integration of artificial intelligence for advanced beam control and targeting. This development is reshaping the technological landscape of military laser systems.

  • The market is experiencing a structural shift toward modular, open-system architectures, a trend that is projected to reduce system upgrade costs by up to 40% over a platform's lifecycle. This approach, driven by the need for a tactical laser that can be easily adapted, facilitates rapid technology insertion and simplifies logistics.
  • Another key trend is the integration of AI, where AI-driven laser targeting has demonstrated the ability to decrease target engagement time by 30%. This is critical for countering drone swarms. The development of hybrid layered air defense network combining high-power microwave weapons with kinetic interceptors optimizes defense economics.
  • Innovations in free-space optical communications and optical dazzler technologies are also expanding the utility of laser-based systems beyond destructive applications, with a focus on laser communication security.

What challenges does the Military Laser Systems Industry face during its growth?

  • A significant challenge affecting the market is atmospheric attenuation, where environmental factors can degrade the performance and effective range of laser systems.

  • A fundamental challenge is laser system atmospheric propagation, as environmental factors like fog and dust can reduce a laser's effective range by over 80%. This limitation necessitates maintaining redundant kinetic systems, complicating logistics. Another significant engineering hurdle is thermal management.
  • Current solid-state lasers convert up to 60% of their input power into waste heat, requiring cooling systems that can double the total system volume and weight, a critical issue for laser weapon system SWaP. Integration with legacy platforms, which often lack the requisite electrical power generation and structural support, poses further difficulties.
  • These technical constraints temper the pace of widespread adoption, especially for high-power laser for missile defense applications. The development of anti-satellite laser weapons faces similar physics-based constraints.

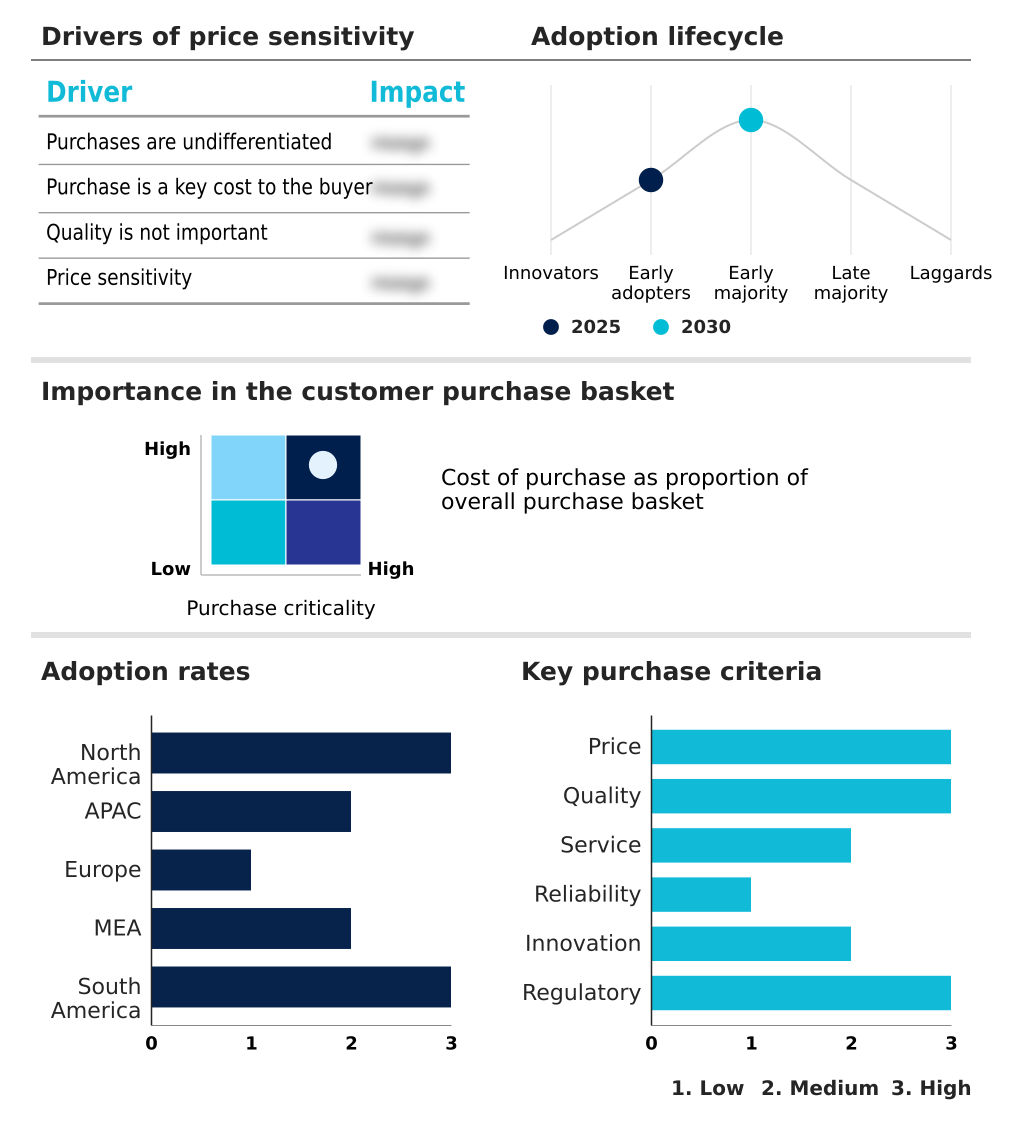
Exclusive Technavio Analysis on Customer Landscape

The military laser systems market forecasting report includes the adoption lifecycle of the market, covering from the innovator’s stage to the laggard’s stage. It focuses on adoption rates in different regions based on penetration. Furthermore, the military laser systems market report also includes key purchase criteria and drivers of price sensitivity to help companies evaluate and develop their market growth analysis strategies.

Customer Landscape of Military Laser Systems Industry

Competitive Landscape

Companies are implementing various strategies, such as strategic alliances, military laser systems market forecast, partnerships, mergers and acquisitions, geographical expansion, and product/service launches, to enhance their presence in the industry.

BAE Systems Plc - Offerings include integrated laser-guided rockets and advanced 3D LIDAR mapping solutions, alongside the development of high-energy laser effectors for modern military applications.

The industry research and growth report includes detailed analyses of the competitive landscape of the market and information about key companies, including:

  • BAE Systems Plc
  • Coherent Corp.
  • Elbit Systems Ltd.
  • General Atomics
  • Israel Aerospace Ltd.
  • Kratos Defense and Security Inc.
  • L3Harris Technologies Inc.
  • Leonardo S.p.A.
  • Lockheed Martin Corp.
  • MBDA
  • MKS Instruments Inc.
  • Newport Corp.
  • Northrop Grumman Corp.
  • QinetiQ Ltd.
  • Rafael Advanced Defense Ltd.
  • Rheinmetall AG
  • RTX Corp.
  • Saab AB
  • Safran SA
  • Thales Group
  • The Boeing Co.

Qualitative and quantitative analysis of companies has been conducted to help clients understand the wider business environment as well as the strengths and weaknesses of key industry players. Data is qualitatively analyzed to categorize companies as pure play, category-focused, industry-focused, and diversified; it is quantitatively analyzed to categorize companies as dominant, leading, strong, tentative, and weak.

Recent Development and News in Military laser systems market

  • In August 2025, RTX Corp. announced the delivery of an enhanced 50-kilowatt class High Energy Laser Weapon System to the US Army, featuring upgraded beam control software to decrease the time required to defeat maneuvering drone threats.
  • In January 2025, Lockheed Martin Corp. confirmed the delivery of another battery of 300-kilowatt class laser weapon systems to the United States Army, significantly expanding the operational footprint of the IFPC-HEL program.
  • In March 2025, Northrop Grumman Corp. reported the successful fielding of an upgraded lightweight laser target designator module, which provides extended battery life and improved beam stability for dismounted infantry units.
  • In April 2025, Rheinmetall AG announced the successful integration and live-fire testing of a new high-energy laser effector on its Skyranger 30 mobile air defense vehicle, proving its capability to neutralize multiple drone threats in rapid succession.

Dive into Technavio’s robust research methodology, blending expert interviews, extensive data synthesis, and validated models for unparalleled Military Laser Systems Market insights. See full methodology.

Market Scope
Page number 298
Base year 2025
Historic period 2020-2024
Forecast period 2026-2030
Growth momentum & CAGR Accelerate at a CAGR of 6.2%
Market growth 2026-2030 USD 1994.3 million
Market structure Fragmented
YoY growth 2025-2026(%) 5.9%
Key countries US, Canada, Mexico, China, India, Japan, South Korea, Australia, Indonesia, Germany, UK, France, Italy, Spain, The Netherlands, Israel, Saudi Arabia, UAE, Turkey, South Africa, Brazil, Argentina and Chile
Competitive landscape Leading Companies, Market Positioning of Companies, Competitive Strategies, and Industry Risks

Request Free Sample

Research Analyst Overview

  • The Military Laser Systems Market is defined by a rapid transition toward advanced directed energy weapon platforms. The underlying technology has evolved from chemical lasers to more efficient and compact fiber laser technology and solid-state laser designs. Central to their effectiveness are sophisticated beam control systems and adaptive optics, which mitigate atmospheric distortion and thermal blooming compensation.
  • As systems scale in power, thermal management solutions become critical. Innovations like spectral beam combining enable laser power scaling to hundreds of kilowatts, making high-energy laser effectors viable for short-range air defense and counter-rocket, artillery, and mortar roles. The integration of directed infrared countermeasures has improved aircraft survivability against heat-seeking missiles by over 75%.
  • This trend toward intelligent systems is forcing boardroom-level decisions on R&D budgets, shifting focus from raw power to AI-driven targeting, which uses pulse repetition frequency coding for precision. This impacts everything from the development of a laser guidance kit to a full naval laser weapon system or airborne laser systems.

What are the Key Data Covered in this Military Laser Systems Market Research and Growth Report?

  • What is the expected growth of the Military Laser Systems Market between 2026 and 2030?

    • USD 1.99 billion, at a CAGR of 6.2%

  • What segmentation does the market report cover?

    • The report is segmented by Product Type (Laser weapon systems, Laser radar systems, and Laser target designators), Application (Non-weapons, and Weapons), Power Output (10 kW TO 100 kW, More than 100 kW, and 10 kW) and Geography (North America, APAC, Europe, Middle East and Africa, South America)

  • Which regions are analyzed in the report?

    • North America, APAC, Europe, Middle East and Africa and South America

  • What are the key growth drivers and market challenges?

    • Favorable cost-exchange ratio compared to kinetic interceptors, Atmospheric attenuation and environmental constraints

  • Who are the major players in the Military Laser Systems Market?

    • BAE Systems Plc, Coherent Corp., Elbit Systems Ltd., General Atomics, Israel Aerospace Ltd., Kratos Defense and Security Inc., L3Harris Technologies Inc., Leonardo S.p.A., Lockheed Martin Corp., MBDA, MKS Instruments Inc., Newport Corp., Northrop Grumman Corp., QinetiQ Ltd., Rafael Advanced Defense Ltd., Rheinmetall AG, RTX Corp., Saab AB, Safran SA, Thales Group and The Boeing Co.

Market Research Insights

  • The strategic dynamics of the Military Laser Systems Market are shaped by the proliferation of directed energy weapons and the pursuit of cost-effective defense. The adoption of counter-UAS laser effectiveness has shown a 90% reduction in engagement costs against certain threats, compelling investment in mobile laser air defense platforms.
  • Furthermore, integrating AI-driven laser targeting has improved tracking accuracy against maneuvering targets by up to 40%, a crucial factor in complex combat scenarios. This move toward ruggedized military optronics and tactical high-energy laser applications is central to modern force structures.
  • Development is also focused on non-lethal laser deterrents and ensuring laser communication security, which are vital for future soldier laser systems and maintaining information superiority on the battlefield.

We can help! Our analysts can customize this military laser systems market research report to meet your requirements.

Get in touch

1. Executive Summary

1.1 Market overview

Executive Summary - Chart on Market Overview
Executive Summary - Data Table on Market Overview
Executive Summary - Chart on Global Market Characteristics
Executive Summary - Chart on Market by Geography
Executive Summary - Chart on Market Segmentation by Product Type
Executive Summary - Chart on Market Segmentation by Application
Executive Summary - Chart on Market Segmentation by Power Output
Executive Summary - Chart on Incremental Growth
Executive Summary - Data Table on Incremental Growth
Executive Summary - Chart on Company Market Positioning

2. Technavio Analysis

2.1 Analysis of price sensitivity, lifecycle, customer purchase basket, adoption rates, and purchase criteria

2.2 Criticality of inputs and Factors of differentiation

Chart on Overview on criticality of inputs and factors of differentiation

2.3 Factors of disruption

Chart on Overview on factors of disruption

2.4 Impact of drivers and challenges

Chart on Impact of drivers and challenges in 2025 and 2030

3. Market Landscape

3.1 Market ecosystem

Chart on Parent Market
Data Table on - Parent Market

3.2 Market characteristics

Chart on Market characteristics analysis

3.3 Value chain analysis

Chart on Value chain analysis

4. Market Sizing

4.1 Market definition

Data Table on Offerings of companies included in the market definition

4.2 Market segment analysis

Market segments

4.3 Market size 2025

4.4 Market outlook: Forecast for 2025-2030

Chart on Global - Market size and forecast 2025-2030 ($ million)
Data Table on Global - Market size and forecast 2025-2030 ($ million)
Chart on Global Market: Year-over-year growth 2025-2030 (%)
Data Table on Global Market: Year-over-year growth 2025-2030 (%)

5. Historic Market Size

5.1 Global Military Laser Systems Market 2020 - 2024

Historic Market Size - Data Table on Global Military Laser Systems Market 2020 - 2024 ($ million)

5.2 Product Type segment analysis 2020 - 2024

Historic Market Size - Product Type Segment 2020 - 2024 ($ million)

5.3 Application segment analysis 2020 - 2024

Historic Market Size - Application Segment 2020 - 2024 ($ million)

5.4 Power Output segment analysis 2020 - 2024

Historic Market Size - Power Output Segment 2020 - 2024 ($ million)

5.5 Geography segment analysis 2020 - 2024

Historic Market Size - Geography Segment 2020 - 2024 ($ million)

5.6 Country segment analysis 2020 - 2024

Historic Market Size - Country Segment 2020 - 2024 ($ million)

6. Qualitative Analysis

6.1 Impact of AI on global military laser systems market

7. Five Forces Analysis

7.1 Five forces summary

Five forces analysis - Comparison between 2025 and 2030

7.2 Bargaining power of buyers

Bargaining power of buyers - Impact of key factors 2025 and 2030

7.3 Bargaining power of suppliers

Bargaining power of suppliers - Impact of key factors in 2025 and 2030

7.4 Threat of new entrants

Threat of new entrants - Impact of key factors in 2025 and 2030

7.5 Threat of substitutes

Threat of substitutes - Impact of key factors in 2025 and 2030

7.6 Threat of rivalry

Threat of rivalry - Impact of key factors in 2025 and 2030

7.7 Market condition

Chart on Market condition - Five forces 2025 and 2030

8. Market Segmentation by Product Type

8.1 Market segments

Chart on Product Type - Market share 2025-2030 (%)
Data Table on Product Type - Market share 2025-2030 (%)

8.2 Comparison by Product Type

Chart on Comparison by Product Type
Data Table on Comparison by Product Type

8.3 Laser weapon systems - Market size and forecast 2025-2030

Chart on Laser weapon systems - Market size and forecast 2025-2030 ($ million)
Data Table on Laser weapon systems - Market size and forecast 2025-2030 ($ million)
Chart on Laser weapon systems - Year-over-year growth 2025-2030 (%)
Data Table on Laser weapon systems - Year-over-year growth 2025-2030 (%)

8.4 Laser radar systems - Market size and forecast 2025-2030

Chart on Laser radar systems - Market size and forecast 2025-2030 ($ million)
Data Table on Laser radar systems - Market size and forecast 2025-2030 ($ million)
Chart on Laser radar systems - Year-over-year growth 2025-2030 (%)
Data Table on Laser radar systems - Year-over-year growth 2025-2030 (%)

8.5 Laser target designators - Market size and forecast 2025-2030

Chart on Laser target designators - Market size and forecast 2025-2030 ($ million)
Data Table on Laser target designators - Market size and forecast 2025-2030 ($ million)
Chart on Laser target designators - Year-over-year growth 2025-2030 (%)
Data Table on Laser target designators - Year-over-year growth 2025-2030 (%)

8.6 Market opportunity by Product Type

Market opportunity by Product Type ($ million)
Data Table on Market opportunity by Product Type ($ million)

9. Market Segmentation by Application

9.1 Market segments

Chart on Application - Market share 2025-2030 (%)
Data Table on Application - Market share 2025-2030 (%)

9.2 Comparison by Application

Chart on Comparison by Application
Data Table on Comparison by Application

9.3 Non-weapons - Market size and forecast 2025-2030

Chart on Non-weapons - Market size and forecast 2025-2030 ($ million)
Data Table on Non-weapons - Market size and forecast 2025-2030 ($ million)
Chart on Non-weapons - Year-over-year growth 2025-2030 (%)
Data Table on Non-weapons - Year-over-year growth 2025-2030 (%)

9.4 Weapons - Market size and forecast 2025-2030

Chart on Weapons - Market size and forecast 2025-2030 ($ million)
Data Table on Weapons - Market size and forecast 2025-2030 ($ million)
Chart on Weapons - Year-over-year growth 2025-2030 (%)
Data Table on Weapons - Year-over-year growth 2025-2030 (%)

9.5 Market opportunity by Application

Market opportunity by Application ($ million)
Data Table on Market opportunity by Application ($ million)

10. Market Segmentation by Power Output

10.1 Market segments

Chart on Power Output - Market share 2025-2030 (%)
Data Table on Power Output - Market share 2025-2030 (%)

10.2 Comparison by Power Output

Chart on Comparison by Power Output
Data Table on Comparison by Power Output

10.3 10 kW TO 100 kW - Market size and forecast 2025-2030

Chart on 10 kW TO 100 kW - Market size and forecast 2025-2030 ($ million)
Data Table on 10 kW TO 100 kW - Market size and forecast 2025-2030 ($ million)
Chart on 10 kW TO 100 kW - Year-over-year growth 2025-2030 (%)
Data Table on 10 kW TO 100 kW - Year-over-year growth 2025-2030 (%)

10.4 More than 100 kW - Market size and forecast 2025-2030

Chart on More than 100 kW - Market size and forecast 2025-2030 ($ million)
Data Table on More than 100 kW - Market size and forecast 2025-2030 ($ million)
Chart on More than 100 kW - Year-over-year growth 2025-2030 (%)
Data Table on More than 100 kW - Year-over-year growth 2025-2030 (%)

10.5 10 kW - Market size and forecast 2025-2030

Chart on 10 kW - Market size and forecast 2025-2030 ($ million)
Data Table on 10 kW - Market size and forecast 2025-2030 ($ million)
Chart on 10 kW - Year-over-year growth 2025-2030 (%)
Data Table on 10 kW - Year-over-year growth 2025-2030 (%)

10.6 Market opportunity by Power Output

Market opportunity by Power Output ($ million)
Data Table on Market opportunity by Power Output ($ million)

11. Customer Landscape

11.1 Customer landscape overview

Analysis of price sensitivity, lifecycle, customer purchase basket, adoption rates, and purchase criteria

12. Geographic Landscape

12.1 Geographic segmentation

Chart on Market share by geography 2025-2030 (%)
Data Table on Market share by geography 2025-2030 (%)

12.2 Geographic comparison

Chart on Geographic comparison
Data Table on Geographic comparison

12.3 North America - Market size and forecast 2025-2030

Chart on North America - Market size and forecast 2025-2030 ($ million)
Data Table on North America - Market size and forecast 2025-2030 ($ million)
Chart on North America - Year-over-year growth 2025-2030 (%)
Data Table on North America - Year-over-year growth 2025-2030 (%)
Chart on Regional Comparison - North America
Data Table on Regional Comparison - North America

12.3.1 US - Market size and forecast 2025-2030

Chart on US - Market size and forecast 2025-2030 ($ million)
Data Table on US - Market size and forecast 2025-2030 ($ million)
Chart on US - Year-over-year growth 2025-2030 (%)
Data Table on US - Year-over-year growth 2025-2030 (%)

12.3.2 Canada - Market size and forecast 2025-2030

Chart on Canada - Market size and forecast 2025-2030 ($ million)
Data Table on Canada - Market size and forecast 2025-2030 ($ million)
Chart on Canada - Year-over-year growth 2025-2030 (%)
Data Table on Canada - Year-over-year growth 2025-2030 (%)

12.3.3 Mexico - Market size and forecast 2025-2030

Chart on Mexico - Market size and forecast 2025-2030 ($ million)
Data Table on Mexico - Market size and forecast 2025-2030 ($ million)
Chart on Mexico - Year-over-year growth 2025-2030 (%)
Data Table on Mexico - Year-over-year growth 2025-2030 (%)

12.4 APAC - Market size and forecast 2025-2030

Chart on APAC - Market size and forecast 2025-2030 ($ million)
Data Table on APAC - Market size and forecast 2025-2030 ($ million)
Chart on APAC - Year-over-year growth 2025-2030 (%)
Data Table on APAC - Year-over-year growth 2025-2030 (%)
Chart on Regional Comparison - APAC
Data Table on Regional Comparison - APAC

12.4.1 China - Market size and forecast 2025-2030

Chart on China - Market size and forecast 2025-2030 ($ million)
Data Table on China - Market size and forecast 2025-2030 ($ million)
Chart on China - Year-over-year growth 2025-2030 (%)
Data Table on China - Year-over-year growth 2025-2030 (%)

12.4.2 India - Market size and forecast 2025-2030

Chart on India - Market size and forecast 2025-2030 ($ million)
Data Table on India - Market size and forecast 2025-2030 ($ million)
Chart on India - Year-over-year growth 2025-2030 (%)
Data Table on India - Year-over-year growth 2025-2030 (%)

12.4.3 Japan - Market size and forecast 2025-2030

Chart on Japan - Market size and forecast 2025-2030 ($ million)
Data Table on Japan - Market size and forecast 2025-2030 ($ million)
Chart on Japan - Year-over-year growth 2025-2030 (%)
Data Table on Japan - Year-over-year growth 2025-2030 (%)

12.4.4 South Korea - Market size and forecast 2025-2030

Chart on South Korea - Market size and forecast 2025-2030 ($ million)
Data Table on South Korea - Market size and forecast 2025-2030 ($ million)
Chart on South Korea - Year-over-year growth 2025-2030 (%)
Data Table on South Korea - Year-over-year growth 2025-2030 (%)

12.4.5 Australia - Market size and forecast 2025-2030

Chart on Australia - Market size and forecast 2025-2030 ($ million)
Data Table on Australia - Market size and forecast 2025-2030 ($ million)
Chart on Australia - Year-over-year growth 2025-2030 (%)
Data Table on Australia - Year-over-year growth 2025-2030 (%)

12.4.6 Indonesia - Market size and forecast 2025-2030

Chart on Indonesia - Market size and forecast 2025-2030 ($ million)
Data Table on Indonesia - Market size and forecast 2025-2030 ($ million)
Chart on Indonesia - Year-over-year growth 2025-2030 (%)
Data Table on Indonesia - Year-over-year growth 2025-2030 (%)

12.5 Europe - Market size and forecast 2025-2030

Chart on Europe - Market size and forecast 2025-2030 ($ million)
Data Table on Europe - Market size and forecast 2025-2030 ($ million)
Chart on Europe - Year-over-year growth 2025-2030 (%)
Data Table on Europe - Year-over-year growth 2025-2030 (%)
Chart on Regional Comparison - Europe
Data Table on Regional Comparison - Europe

12.5.1 Germany - Market size and forecast 2025-2030

Chart on Germany - Market size and forecast 2025-2030 ($ million)
Data Table on Germany - Market size and forecast 2025-2030 ($ million)
Chart on Germany - Year-over-year growth 2025-2030 (%)
Data Table on Germany - Year-over-year growth 2025-2030 (%)

12.5.2 UK - Market size and forecast 2025-2030

Chart on UK - Market size and forecast 2025-2030 ($ million)
Data Table on UK - Market size and forecast 2025-2030 ($ million)
Chart on UK - Year-over-year growth 2025-2030 (%)
Data Table on UK - Year-over-year growth 2025-2030 (%)

12.5.3 France - Market size and forecast 2025-2030

Chart on France - Market size and forecast 2025-2030 ($ million)
Data Table on France - Market size and forecast 2025-2030 ($ million)
Chart on France - Year-over-year growth 2025-2030 (%)
Data Table on France - Year-over-year growth 2025-2030 (%)

12.5.4 Italy - Market size and forecast 2025-2030

Chart on Italy - Market size and forecast 2025-2030 ($ million)
Data Table on Italy - Market size and forecast 2025-2030 ($ million)
Chart on Italy - Year-over-year growth 2025-2030 (%)
Data Table on Italy - Year-over-year growth 2025-2030 (%)

12.5.5 Spain - Market size and forecast 2025-2030

Chart on Spain - Market size and forecast 2025-2030 ($ million)
Data Table on Spain - Market size and forecast 2025-2030 ($ million)
Chart on Spain - Year-over-year growth 2025-2030 (%)
Data Table on Spain - Year-over-year growth 2025-2030 (%)

12.5.6 The Netherlands - Market size and forecast 2025-2030

Chart on The Netherlands - Market size and forecast 2025-2030 ($ million)
Data Table on The Netherlands - Market size and forecast 2025-2030 ($ million)
Chart on The Netherlands - Year-over-year growth 2025-2030 (%)
Data Table on The Netherlands - Year-over-year growth 2025-2030 (%)

12.6 Middle East and Africa - Market size and forecast 2025-2030

Chart on Middle East and Africa - Market size and forecast 2025-2030 ($ million)
Data Table on Middle East and Africa - Market size and forecast 2025-2030 ($ million)
Chart on Middle East and Africa - Year-over-year growth 2025-2030 (%)
Data Table on Middle East and Africa - Year-over-year growth 2025-2030 (%)
Chart on Regional Comparison - Middle East and Africa
Data Table on Regional Comparison - Middle East and Africa

12.6.1 Israel - Market size and forecast 2025-2030

Chart on Israel - Market size and forecast 2025-2030 ($ million)
Data Table on Israel - Market size and forecast 2025-2030 ($ million)
Chart on Israel - Year-over-year growth 2025-2030 (%)
Data Table on Israel - Year-over-year growth 2025-2030 (%)

12.6.2 Saudi Arabia - Market size and forecast 2025-2030

Chart on Saudi Arabia - Market size and forecast 2025-2030 ($ million)
Data Table on Saudi Arabia - Market size and forecast 2025-2030 ($ million)
Chart on Saudi Arabia - Year-over-year growth 2025-2030 (%)
Data Table on Saudi Arabia - Year-over-year growth 2025-2030 (%)

12.6.3 UAE - Market size and forecast 2025-2030

Chart on UAE - Market size and forecast 2025-2030 ($ million)
Data Table on UAE - Market size and forecast 2025-2030 ($ million)
Chart on UAE - Year-over-year growth 2025-2030 (%)
Data Table on UAE - Year-over-year growth 2025-2030 (%)

12.6.4 Turkey - Market size and forecast 2025-2030

Chart on Turkey - Market size and forecast 2025-2030 ($ million)
Data Table on Turkey - Market size and forecast 2025-2030 ($ million)
Chart on Turkey - Year-over-year growth 2025-2030 (%)
Data Table on Turkey - Year-over-year growth 2025-2030 (%)

12.6.5 South Africa - Market size and forecast 2025-2030

Chart on South Africa - Market size and forecast 2025-2030 ($ million)
Data Table on South Africa - Market size and forecast 2025-2030 ($ million)
Chart on South Africa - Year-over-year growth 2025-2030 (%)
Data Table on South Africa - Year-over-year growth 2025-2030 (%)

12.7 South America - Market size and forecast 2025-2030

Chart on South America - Market size and forecast 2025-2030 ($ million)
Data Table on South America - Market size and forecast 2025-2030 ($ million)
Chart on South America - Year-over-year growth 2025-2030 (%)
Data Table on South America - Year-over-year growth 2025-2030 (%)
Chart on Regional Comparison - South America
Data Table on Regional Comparison - South America

12.7.1 Brazil - Market size and forecast 2025-2030

Chart on Brazil - Market size and forecast 2025-2030 ($ million)
Data Table on Brazil - Market size and forecast 2025-2030 ($ million)
Chart on Brazil - Year-over-year growth 2025-2030 (%)
Data Table on Brazil - Year-over-year growth 2025-2030 (%)

12.7.2 Argentina - Market size and forecast 2025-2030

Chart on Argentina - Market size and forecast 2025-2030 ($ million)
Data Table on Argentina - Market size and forecast 2025-2030 ($ million)
Chart on Argentina - Year-over-year growth 2025-2030 (%)
Data Table on Argentina - Year-over-year growth 2025-2030 (%)

12.7.3 Chile - Market size and forecast 2025-2030

Chart on Chile - Market size and forecast 2025-2030 ($ million)
Data Table on Chile - Market size and forecast 2025-2030 ($ million)
Chart on Chile - Year-over-year growth 2025-2030 (%)
Data Table on Chile - Year-over-year growth 2025-2030 (%)

12.8 Market opportunity by geography

Market opportunity by geography ($ million)
Data Tables on Market opportunity by geography ($ million)

13. Drivers, Challenges, and Opportunity

13.1 Market drivers

Favorable cost-exchange ratio compared to kinetic interceptors
Proliferation of unmanned aerial systems and asymmetric threats
Advancements in beam combining and swap optimization

13.2 Market challenges

Atmospheric attenuation and environmental constraints
Thermal management and heat dissipation requirements
Integration complexity with legacy platforms and power sources

13.3 Impact of drivers and challenges

Impact of drivers and challenges in 2025 and 2030

13.4 Market opportunities

Integration of artificial intelligence for advanced beam control and targeting
Transition toward modular and open systems architectures
Implementation of hybrid kinetic and directed energy layered defense

14. Competitive Landscape

14.1 Overview

14.2

Overview on criticality of inputs and factors of differentiation

14.3 Landscape disruption

Overview on factors of disruption

14.4 Industry risks

Impact of key risks on business

15. Competitive Analysis

15.1 Companies profiled

Companies covered

15.2 Company ranking index

15.3 Market positioning of companies

Matrix on companies position and classification

15.4 BAE Systems Plc

BAE Systems Plc - Overview
BAE Systems Plc - Business segments
BAE Systems Plc - Key news
BAE Systems Plc - Key offerings
BAE Systems Plc - Segment focus
SWOT

15.5 Elbit Systems Ltd.

Elbit Systems Ltd. - Overview
Elbit Systems Ltd. - Product / Service
Elbit Systems Ltd. - Key news
Elbit Systems Ltd. - Key offerings
SWOT

15.6 General Atomics

General Atomics - Overview
General Atomics - Product / Service
General Atomics - Key offerings
SWOT

15.7 Israel Aerospace Ltd.

Israel Aerospace Ltd. - Overview
Israel Aerospace Ltd. - Product / Service
Israel Aerospace Ltd. - Key news
Israel Aerospace Ltd. - Key offerings
SWOT

15.8 L3Harris Technologies Inc.

L3Harris Technologies Inc. - Overview
L3Harris Technologies Inc. - Business segments
L3Harris Technologies Inc. - Key news
L3Harris Technologies Inc. - Key offerings
L3Harris Technologies Inc. - Segment focus
SWOT

15.9 Leonardo S.p.A.

Leonardo S.p.A. - Overview
Leonardo S.p.A. - Business segments
Leonardo S.p.A. - Key offerings
Leonardo S.p.A. - Segment focus
SWOT

15.10 Lockheed Martin Corp.

Lockheed Martin Corp. - Overview
Lockheed Martin Corp. - Business segments
Lockheed Martin Corp. - Key news
Lockheed Martin Corp. - Key offerings
Lockheed Martin Corp. - Segment focus
SWOT

15.11 MBDA

MBDA - Overview
MBDA - Product / Service
MBDA - Key offerings
SWOT

15.12 Northrop Grumman Corp.

Northrop Grumman Corp. - Overview
Northrop Grumman Corp. - Business segments
Northrop Grumman Corp. - Key news
Northrop Grumman Corp. - Key offerings
Northrop Grumman Corp. - Segment focus
SWOT

15.13 Rafael Advanced Defense Ltd.

Rafael Advanced Defense Ltd. - Overview
Rafael Advanced Defense Ltd. - Product / Service
Rafael Advanced Defense Ltd. - Key offerings
SWOT

15.14 Rheinmetall AG

Rheinmetall AG - Overview
Rheinmetall AG - Business segments
Rheinmetall AG - Key offerings
Rheinmetall AG - Segment focus
SWOT

15.15 RTX Corp.

RTX Corp. - Overview
RTX Corp. - Business segments
RTX Corp. - Key news
RTX Corp. - Key offerings
RTX Corp. - Segment focus
SWOT

15.16 Saab AB

Saab AB - Overview
Saab AB - Business segments
Saab AB - Key news
Saab AB - Key offerings
Saab AB - Segment focus
SWOT

15.17 Thales Group

Thales Group - Overview
Thales Group - Business segments
Thales Group - Key news
Thales Group - Key offerings
Thales Group - Segment focus
SWOT

15.18 The Boeing Co.

The Boeing Co. - Overview
The Boeing Co. - Business segments
The Boeing Co. - Key news
The Boeing Co. - Key offerings
The Boeing Co. - Segment focus
SWOT

16. Appendix

16.1 Scope of the report

Market definition
Objectives
Notes and caveats

16.2 Inclusions and exclusions checklist

Inclusions checklist
Exclusions checklist

16.3 Currency conversion rates for US$

16.4 Research methodology

16.5 Data procurement

Information sources

16.6 Data validation

16.7 Validation techniques employed for market sizing

16.8 Data synthesis

16.9 360 degree market analysis

16.10 List of abbreviations

Research Methodology

Technavio presents a detailed picture of the market by way of study, synthesis, and summation of data from multiple sources. The analysts have presented the various facets of the market with a particular focus on identifying the key industry influencers. The data thus presented is comprehensive, reliable, and the result of extensive research, both primary and secondary.

INFORMATION SOURCES

Primary sources

  • Manufacturers and suppliers
  • Channel partners
  • Industry experts
  • Strategic decision makers

Secondary sources

  • Industry journals and periodicals
  • Government data
  • Financial reports of key industry players
  • Historical data
  • Press releases

DATA ANALYSIS

Data Synthesis

  • Collation of data
  • Estimation of key figures
  • Analysis of derived insights

Data Validation

  • Triangulation with data models
  • Reference against proprietary databases
  • Corroboration with industry experts

REPORT WRITING

Qualitative

  • Market drivers
  • Market challenges
  • Market trends
  • Five forces analysis

Quantitative

  • Market size and forecast
  • Market segmentation
  • Geographical insights
  • Competitive landscape

Interested in this report?

Get your sample now to see our research methodology and insights!

Download Now

Frequently Asked Questions

Military Laser Systems market growth will increase by USD 1994.3 million during 2026-2030.

The Military Laser Systems market is expected to grow at a CAGR of 6.2% during 2026-2030.

Military Laser Systems market is segmented by Product type (Laser weapon systems, Laser radar systems, Laser target designators) Application (Non-weapons, Weapons) Power output (10 kW TO 100 kW, More than 100 kW, 10 kW)

BAE Systems Plc, Coherent Corp., Elbit Systems Ltd., General Atomics, Israel Aerospace Ltd., Kratos Defense and Security Inc., L3Harris Technologies Inc., Leonardo S.p.A., Lockheed Martin Corp., MBDA, MKS Instruments Inc., Newport Corp., Northrop Grumman Corp., QinetiQ Ltd., Rafael Advanced Defense Ltd., Rheinmetall AG, RTX Corp., Saab AB, Safran SA, Thales Group, The Boeing Co. are a few of the key vendors in the Military Laser Systems market.

North America will register the highest growth rate of 41.3% among the other regions. Therefore, the Military Laser Systems market in North America is expected to garner significant business opportunities for the vendors during the forecast period.

US, Canada, Mexico, China, India, Japan, South Korea, Australia, Indonesia, Germany, UK, France, Italy, Spain, The Netherlands, Israel, Saudi Arabia, UAE, Turkey, South Africa, Brazil, Argentina, Chile

  • Favorable cost-exchange ratio compared to kinetic interceptors is the driving factor this market.

The Military Laser Systems market vendors should focus on grabbing business opportunities from the Product type segment as it accounted for the largest market share in the base year.