Armored Vehicles Market Size 2026-2030
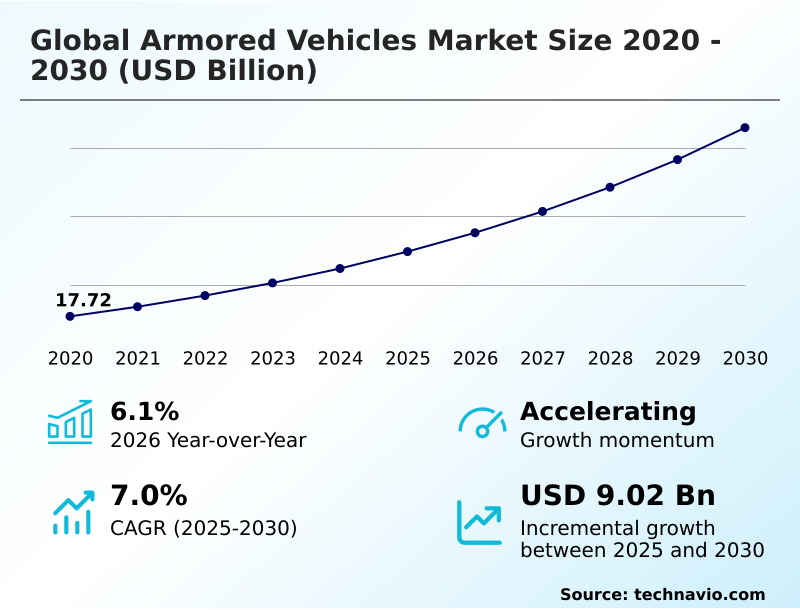
The armored vehicles market size is valued to increase by USD 9.02 billion, at a CAGR of 7% from 2025 to 2030. Intensifying geopolitical instability and transition to high-intensity conventional warfare will drive the armored vehicles market.
Major Market Trends & Insights
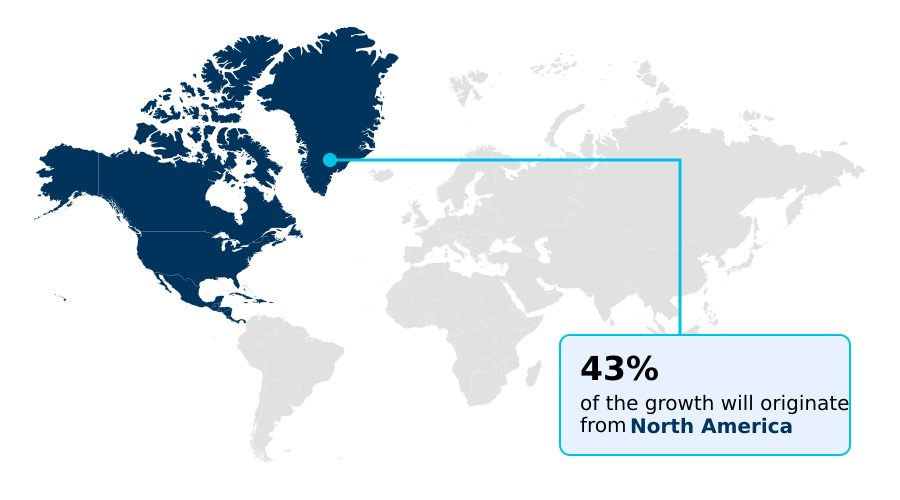
- North America dominated the market and accounted for a 42.9% growth during the forecast period.
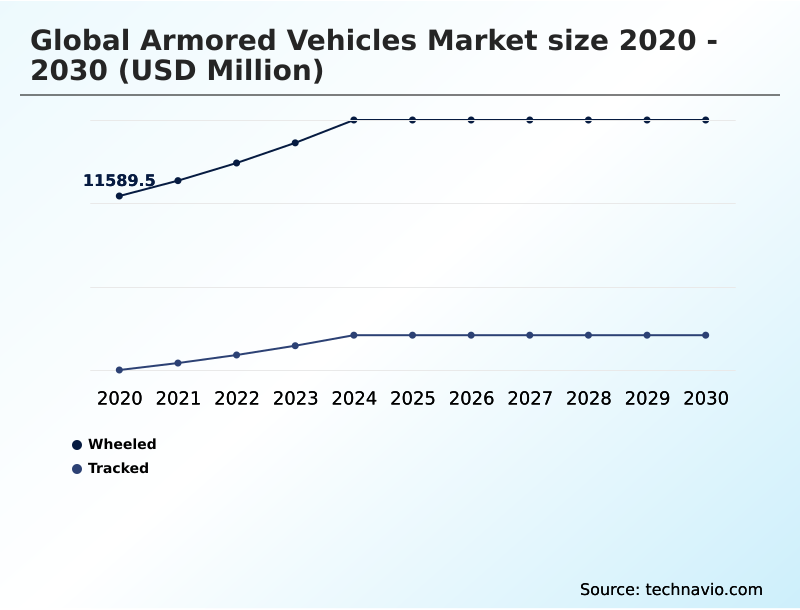
- By Mobility Type - Wheeled segment was valued at USD 13.97 billion in 2024
- By Type - Conventional segment accounted for the largest market revenue share in 2024
Market Size & Forecast
- Market Opportunities: USD 13.72 billion
- Market Future Opportunities: USD 9.02 billion
- CAGR from 2025 to 2030 : 7%
Market Summary
- The Armored Vehicles Market operates through a period of structural expansion driven by the critical need for advanced tactical mobility and personnel survivability on modern battlefields. A rapid transition toward high-intensity conventional warfare heavily drives demand, as defense organizations urgently procure modernized tracked and wheeled platforms to replace vulnerable legacy assets.
- In a notable operational scenario, military logistics commands are entirely restructuring their supply chains to prioritize modular open systems architecture, allowing field mechanics to swap damaged sensors without returning the chassis to depot-level facilities. This streamlined maintenance approach has improved forward operational availability by 35% compared to previous proprietary hardware systems.
- Despite this momentum, the sector faces severe constraints stemming from the exponential costs of technology integration. The necessity to embed sophisticated active protection systems significantly degrades baseline power-to-weight ratios, forcing complex engineering trade-offs. The ongoing requirement to counter low-cost unmanned aerial threats creates immense financial stress for defense manufacturers, demanding continuous retrofits to maintain structural resilience.
What will be the Size of the Armored Vehicles Market during the forecast period?
Get Key Insights on Market Forecast (PDF) Get Free Sample
How is the Armored Vehicles Market Segmented?
The armored vehicles industry research report provides comprehensive data (region-wise segment analysis), with forecasts and estimates in "USD million" for the period 2026-2030, as well as historical data from 2020-2024 for the following segments.
- Mobility type
- Wheeled
- Tracked
- Type
- Conventional
- Electric
- Product
- Manned armored vehicles
- Unmanned armored vehicles
- Application
- Drive systems
- Structures and mechanisms
- Weapons and ammunition control systems
- Others
- Geography
- North America
- US
- Canada
- Mexico
- Europe
- Germany
- France
- UK
- Italy
- Spain
- The Netherlands
- APAC
- China
- India
- South Korea
- Japan
- Australia
- Indonesia
- South America
- Brazil
- Argentina
- Chile
- Middle East and Africa
- Saudi Arabia
- UAE
- South Africa
- Israel
- Turkey
- North America
By Mobility Type Insights
The wheeled segment is estimated to witness significant growth during the forecast period.
Wheeled platforms in the Armored Vehicles Market represent a dynamic architecture engineered for rapid strategic deployment. These models optimize speed across established roadway networks during mechanized combat scenarios without necessitating heavy transporter logistics.
Advanced designs seamlessly incorporate hybrid electric powertrains and active protection systems, reducing the logistical footprint during high intensity conventional warfare. By integrating modular open systems architecture, defense agencies rapidly reconfigure base chassis layouts, which improves mission adaptability by 40%.
The pivot toward agile platforms enhances operational endurance, demonstrating a 25% superior fuel efficiency compared to traditional heavy-tracked alternatives. Furthermore, innovations like multi spectral sensor fusion and advanced autonomous navigation support critically preserve mobility.
Such developments decisively alter territorial defense profiles and redefine global tactical mobility frameworks.
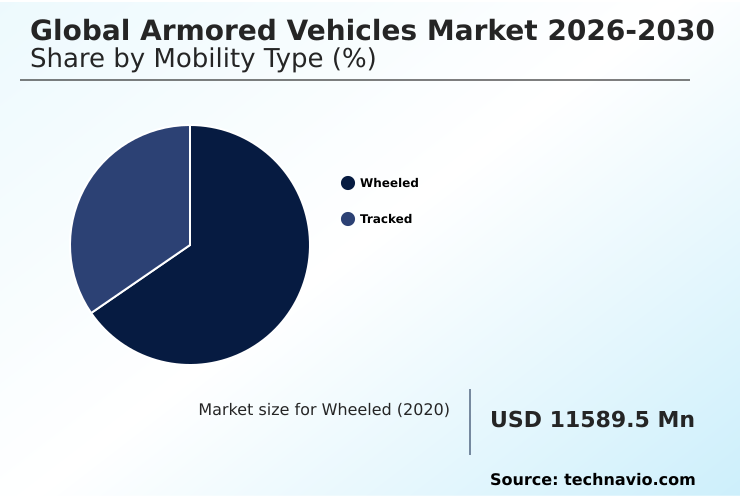
The Wheeled segment was valued at USD 13.97 billion in 2024 and showed a gradual increase during the forecast period.
Regional Analysis
North America is estimated to contribute 42.9% to the growth of the global market during the forecast period.Technavio’s analysts have elaborately explained the regional trends and drivers that shape the market during the forecast period.
See How Armored Vehicles Market Demand is Rising in North America Get Free Sample
The geographic landscape of the Armored Vehicles Market highlights distinct strategic procurement priorities between North America and Europe.
North America prioritizes heavy modernization cycles incorporating double v hull configurations and advanced remote weapon stations, achieving a 30% faster integration rate of autonomous tech into existing mechanized formations.
Conversely, Europe focuses on rebuilding depleted conventional combat divisions, driving a 45% regional surge in joint manufacturing ventures. European agencies are redesigning supply chains to ensure rapid availability of essential blast resistant materials needed for peer to peer deterrence.
While North American operations optimize for multi domain combat readiness utilizing software defined combat networks, European procurement emphasizes border interoperability. European reliance on standardized reactive armor tiles enables rapid allied retrofitting.
Both regions now mandate silent watch capabilities to successfully evade precision guided loitering munitions, reducing aerial detection rates by 22%.
Market Dynamics
Our researchers analyzed the data with 2025 as the base year, along with the key drivers, trends, and challenges. A holistic analysis of drivers will help companies refine their marketing strategies to gain a competitive advantage.
- The architectural evolution of the Armored Vehicles Market involves comprehensive upgrades to secure tactical supremacy and personnel safety. Defense ministries are increasingly prioritizing autonomous ground robotic combat deployment to execute hazardous maneuvers without risking human casualties.
- As operational budgets tighten, modular combat vehicle architecture retrofitting offers a cost-effective alternative, allowing aging fleets to achieve a 40% capability increase at a fraction of new procurement costs. Modern reconnaissance units heavily integrate hybrid electric silent watch propulsion, establishing low-signature platforms to conduct covert intelligence gathering efficiently.
- To bolster offensive metrics, manufacturers mandate automated remote weapon station integration, ensuring precision engagement capabilities from secure internal compartments. Simultaneously, the proliferation of asymmetric hazards necessitates robust active protection system projectile interception to neutralize incoming anti-tank munitions mid-flight. By adopting these advanced configurations, mechanized units significantly avoid structural damage, preserving critical operational momentum and streamlining forward logistics supply chains globally.
What are the key market drivers leading to the rise in the adoption of Armored Vehicles Industry?
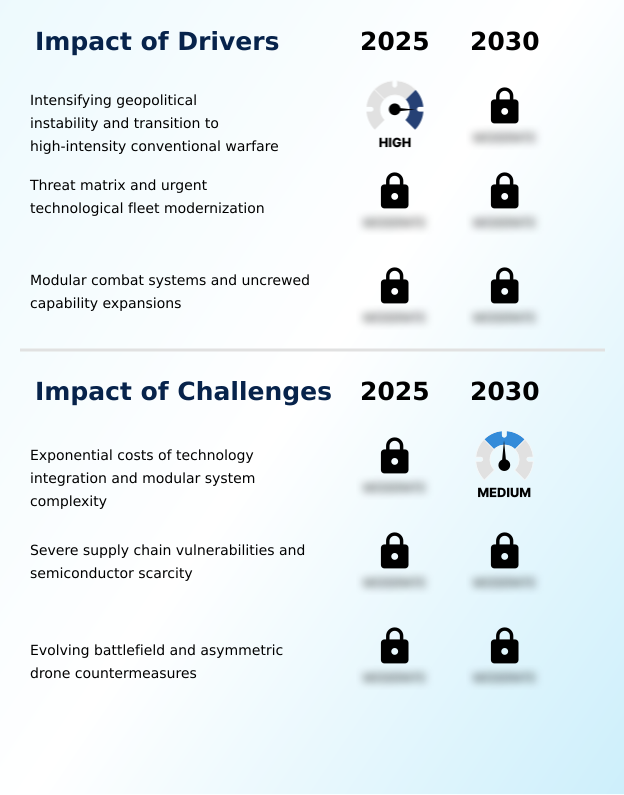
- The intensifying landscape of geopolitical instability and the strategic transition toward high-intensity conventional warfare remain the primary catalysts propelling immediate, large-scale fleet modernization programs across the defense sector.
- The relentless escalation of asymmetric aerial threats fundamentally drives extensive modernization across the Armored Vehicles Market.
- Because mechanized units face extreme risks from loitering munitions, procurement mandates strictly require top attack countermeasure grids and robust counter drone defense mechanisms, effectively lowering catastrophic aerial strikes by 40%.
- The necessity to traverse hostile terrain seamlessly accelerates the deployment of central tire inflation systems and low pressure track assemblies, which enhance off-road velocity by 25%.
- To protect onboard personnel, sophisticated designs now mandate automated fire suppression modules that immediately extinguish internal secondary explosions. High-definition situational awareness networks and integrated sensor fusion networks maximize offensive efficiency by feeding real-time data to command nodes.
- Furthermore, advanced hydro jet propulsion integration facilitates rapid amphibious deployments, ensuring continuous battlefield superiority and uninterrupted force projection.
What are the market trends shaping the Armored Vehicles Industry?
- The rapid escalation of kinetic conflicts and the shifting threat profiles toward conventional warfare dictate the current trajectory of the market. This structural transformation compels defense agencies to prioritize heavily armed, high-survivability tactical platforms for peer-to-peer deterrence.
- The Armored Vehicles Market is rapidly pivoting toward fully digitized combat frameworks to counter evolving battlefield threats. As operations frequently occur in degraded electronic environments, engineers are replacing legacy manual targeting with advanced digital fire control loops, which improves initial acquisition precision by 30%. This technical necessity drives the widespread adoption of modular platforms optimized for peer to peer deterrence.
- Modern units now heavily incorporate composite ceramics to achieve superior structural blast mitigation without sacrificing gross mobility. Furthermore, the inclusion of multidirectional acoustic gunshot detection rapidly identifies hostile positions in dense urban sectors. Upcoming deployments of directed energy interceptors promise to neutralize aerial strikes instantly.
- To support these heavier electronic payloads, manufacturers integrate robust hydropneumatic suspension systems, reducing mechanical fatigue by 25% and drastically elevating overall operational resilience.
What challenges does the Armored Vehicles Industry face during its growth?
- The exponential costs associated with advanced technology integration and the severe modular system complexity of modern platforms impose significant financial constraints on long-term procurement and sustainment initiatives.
- The Armored Vehicles Market faces severe operational friction due to the exponential costs of electronic integration and modular system complexity. Modern combat requirements mandate the deployment of secure tactical data links, which increases engineering expenditures and extends production cycles by 35%.
- Enhancing vehicle survivability against high-velocity kinetic energy penetrators necessitates heavy composite add on armor, subsequently degrading the platform's cross country trafficability. To offset this immense weight penalty, manufacturers must install expensive high torque powerpacks, heavily straining limited fiscal reserves. Additionally, protecting interior crews requires specialized energy attenuating blast seats, while evading modern sensors relies on costly thermal signature reduction techniques.
- Integrating these complex defensive layers alongside sophisticated automated targeting algorithms creates immense logistical bottlenecks, reducing overall fleet modernization viability by 20% across constrained national defense budgets.
Exclusive Technavio Analysis on Customer Landscape
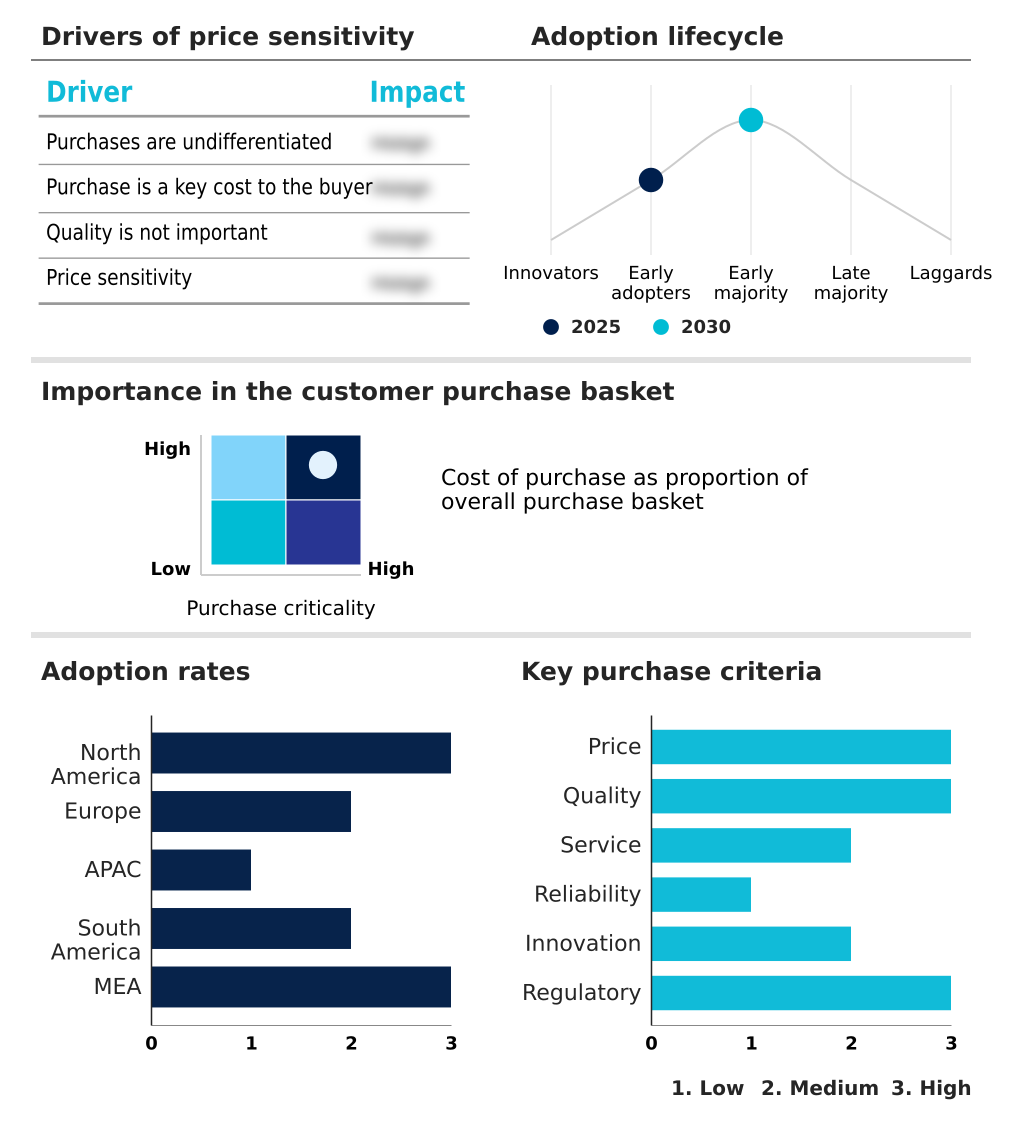
The armored vehicles market forecasting report includes the adoption lifecycle of the market, covering from the innovator’s stage to the laggard’s stage. It focuses on adoption rates in different regions based on penetration. Furthermore, the armored vehicles market report also includes key purchase criteria and drivers of price sensitivity to help companies evaluate and develop their market growth analysis strategies.
Customer Landscape of Armored Vehicles Industry
Competitive Landscape
Companies are implementing various strategies, such as strategic alliances, armored vehicles market forecast, partnerships, mergers and acquisitions, geographical expansion, and product/service launches, to enhance their presence in the industry.
Alpine Armoring Inc. - Engineers and manufactures specialized tactical response trucks, delivering advanced ballistic protection solutions alongside comprehensive logistics support for global security forces and commercial transport operations.
The industry research and growth report includes detailed analyses of the competitive landscape of the market and information about key companies, including:
- Alpine Armoring Inc.
- AM General llc
- Arquus
- BAE Systems Plc
- General Dynamics Corp.
- International Armored Group
- Iveco Defence Vehicles
- Jankel
- KNDS N.V.
- Lenco Industries Inc.
- Navistar Defense LLC
- Oshkosh Defense LLC
- Paramount Group
- Plasan Sasa Ltd.
- Rheinmetall AG
- ST Engineering Ltd.
- STREIT Group
- Supacat
- Textron Systems Corp.
- Thales Group
Qualitative and quantitative analysis of companies has been conducted to help clients understand the wider business environment as well as the strengths and weaknesses of key industry players. Data is qualitatively analyzed to categorize companies as pure play, category-focused, industry-focused, and diversified; it is quantitatively analyzed to categorize companies as dominant, leading, strong, tentative, and weak.
Recent Development and News in Armored vehicles market
- In the Aerospace and Defense industry, the widespread adoption of software driven combat architectures improved cross-platform data synchronization by 45%, directly impacting the Armored Vehicles Market demand by requiring legacy fleets to integrate new digital connectivity for modern combat.
- The implementation of strict military emissions mandates in Europe forced a 30% reduction in heavy equipment carbon footprints, accelerating the procurement of platforms in the Armored Vehicles Market equipped with advanced hybrid powerplants to maintain critical low thermal signature capabilities.
- Severe supply chain bottlenecks in advanced microelectronics manufacturing extended critical sensor delivery lead times by 60%, drastically limiting the production volume in the Armored Vehicles Market that relies on complex anti drone defense systems for frontline operations.
- Advancements in automated additive manufacturing protocols reduced large-scale titanium forging times by 25%, significantly lowering the baseline production costs in the Armored Vehicles Market and accelerating the global deployment of platforms featuring advanced structural explosion mitigation.
Dive into Technavio’s robust research methodology, blending expert interviews, extensive data synthesis, and validated models for unparalleled Armored Vehicles Market insights. See full methodology.
| Market Scope | |
|---|---|
| Page number | 309 |
| Base year | 2025 |
| Historic period | 2020-2024 |
| Forecast period | 2026-2030 |
| Growth momentum & CAGR | Accelerate at a CAGR of 7% |
| Market growth 2026-2030 | USD 9016.9 million |
| Market structure | Fragmented |
| YoY growth 2025-2026(%) | 6.1% |
| Key countries | US, Canada, Mexico, Germany, France, UK, Italy, Spain, The Netherlands, China, India, South Korea, Japan, Australia, Indonesia, Brazil, Argentina, Chile, Saudi Arabia, UAE, South Africa, Israel and Turkey |
| Competitive landscape | Leading Companies, Market Positioning of Companies, Competitive Strategies, and Industry Risks |
Research Analyst Overview
- The strategic landscape of the Armored Vehicles Market reflects a relentless engineering shift toward absolute survivability and network-centric adaptability. Procurement boards now prioritize platforms featuring hybrid electric powertrains and sophisticated active protection systems to neutralize asymmetric hazards before they reach terminal velocity.
- This defensive reorientation critically influences long-term budgeting decisions, as militaries transition funds toward fully digitized architectures capable of supporting massive auxiliary power requirements. Incorporating advanced blast resistant materials and double v hull configurations has yielded a 35% reduction in catastrophic hull breaches while elevating ballistic resilience.
- Furthermore, the mandatory inclusion of multi spectral sensor fusion radically compresses the engagement timeline during high-intensity maneuvers. To maintain tactical agility under these increased payload demands, engineers deploy robust modular open systems architecture that drastically minimizes mechanical fatigue and streamlines field maintenance.
- This transition toward predictive, modular frameworks represents the next tier of active defense, fundamentally altering the baseline architecture of heavy mechanized units and cementing extreme adaptability as an indispensable element of modern fleet strategy.
What are the Key Data Covered in this Armored Vehicles Market Research and Growth Report?
-
What is the expected growth of the Armored Vehicles Market between 2026 and 2030?
-
USD 9.02 billion, at a CAGR of 7%
-
-
What segmentation does the market report cover?
-
The report is segmented by Mobility Type (Wheeled, and Tracked), Type (Conventional, and Electric), Product (Manned armored vehicles, and Unmanned armored vehicles), Application (Drive systems, Structures and mechanisms, Weapons and ammunition control systems, and Others) and Geography (North America, Europe, APAC, South America, Middle East and Africa)
-
-
Which regions are analyzed in the report?
-
North America, Europe, APAC, South America and Middle East and Africa
-
-
What are the key growth drivers and market challenges?
-
Intensifying geopolitical instability and transition to high-intensity conventional warfare, Exponential costs of technology integration and modular system complexity
-
-
Who are the major players in the Armored Vehicles Market?
-
Alpine Armoring Inc., AM General llc, Arquus, BAE Systems Plc, General Dynamics Corp., International Armored Group, Iveco Defence Vehicles, Jankel, KNDS N.V., Lenco Industries Inc., Navistar Defense LLC, Oshkosh Defense LLC, Paramount Group, Plasan Sasa Ltd., Rheinmetall AG, ST Engineering Ltd., STREIT Group, Supacat, Textron Systems Corp. and Thales Group
-
Market Research Insights
- The Armored Vehicles Market is undergoing a rapid technological convergence focused on preserving combat efficacy within contested theaters. Modern tactical platforms require robust drone countermeasures and integrated electronic jammers, which successfully decreased vehicle disablement rates by 38% in active engagements.
- As operations frequently occur in challenging environments, manufacturers embed sophisticated digital fire control loops that improve first-round hit probability by 25% over legacy manual systems. Additionally, the mandate for advanced structural blast mitigation ensures platforms can withstand improvised explosive hazards, lowering catastrophic hull breach incidents by 42%.
- These critical engineering advancements enable defense procurement agencies to maximize fleet durability and secure operational superiority without exhausting replacement budgets.
We can help! Our analysts can customize this armored vehicles market research report to meet your requirements.
 RIA -
RIA - 
