Military Wearable Sensors Market Analysis North America, Europe, APAC, Middle East and Africa, South America - US, China, Germany, France, Russia - Size and Forecast 2024-2028

Military Wearable Sensors Market Analysis North America, Europe, APAC, Middle East and Africa, South America - US, China, Germany, France, Russia - Size and Forecast 2024-2028

Published: May 2024 187 Pages SKU: IRTNTR44458

Market Overview at a Glance

$187.4 Mn
Market Opportunity
7.28%
CAGR
6.65
YoY growth 2023-2024(%)

Military Wearable Sensors Market Size 2024-2028 

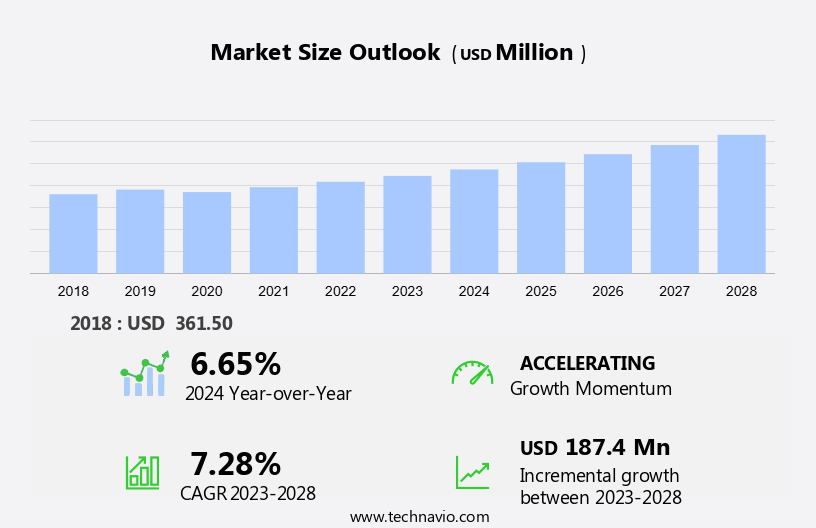
The military wearable sensors market size is forecast to increase by USD 187.4 billion at a CAGR of 7.28% between 2023 and 2028.

  • The market is witnessing significant growth due to increased spending on military modernization programs. The integration of IoT and big data in military operations is driving the market, enabling real-time data collection and analysis for enhanced situational awareness. However, the high cost of R&D and the complex nature of military applications pose challenges to market growth. Military organizations are investing in advanced technologies to develop lightweight, durable, and multifunctional sensors for various applications, including health monitoring, location tracking, and threat detection. The use of wearable sensors in military operations offers numerous benefits, including improved operational efficiency, enhanced safety, and increased mission success rates. The market is expected to continue its growth trajectory, driven by technological advancements and increasing demand for real-time data in military applications.

What will the size of the market be during the forecast period?

Military Wearable Sensors Market Size

 Request Free Sample

  • The market is experiencing significant growth as defense forces worldwide invest in modernization programs to enhance soldier protection and performance. These advanced wearable technologies, including smart goggles, watches, key chains, bracelets, and other devices, are integrated with IoT and cloud services to provide real-time interpretation of physiological parameters. Smart devices, such as tablets and mobile phones, serve as command centers for accessing and analyzing data collected by military wearable sensors. This data includes heart rate, respiration, hydration level, and other vital signs, enabling military personnel to optimize their performance and respond effectively to changing situations. The integration of military wearable technology with cloud services facilitates centralized data analysis and interpretation, providing commanders with valuable insights into the level of injury, fatigue, and overall health status of their troops.
  • This information is crucial for making informed decisions and ensuring the well-being of soldiers in the field. Inventions in military wearable sensors continue to evolve, with new technologies and applications emerging regularly. These advancements offer significant benefits, from improved situational awareness to enhanced safety and mission success. As military organizations continue to prioritize modernization programs, the market for military wearable sensors is poised for continued growth and innovation.

How is this market segmented and which is the largest segment?

The market research report provides comprehensive data (region-wise segment analysis), with forecasts and estimates in "USD million" for the period 2024-2028, as well as historical data from 2018-2022 for the following segments.

  • Type
    • Device-based sensors
    • Clothing-based sensors
  • Application
    • Headwear
    • Bodywear
    • Eyewear
    • Wristwear
    • Hearables
  • Geography
    • North America
      • US
    • Europe
      • Germany
      • France
    • APAC
      • China
    • Middle East and Africa
    • South America

By Type Insights

  • The device-based sensors segment is estimated to witness significant growth during the forecast period.

Military wearable sensors have gained significant attention in modernization efforts and programs due to their capability to enhance military protection and mission-specific requirements. These sensors are integrated into various wearable devices such as goggles, keychains, watches, and activity-tracking wristbands. GPS, a common feature in many of these devices, provides accurate positioning and velocity information for situational awareness. Wearable displays, like those in wristbands and goggles, integrated with GPS offer real-time data to soldiers. Other sensors include pressure sensors and those that monitor physiological parameters. Wearable technology must meet stringent requirements, including resistance to magnetic fields, moisture, and operating temperature extremes.

Qualitative and quantitative research are essential in the development and packaging and assembly of these devices. Integrating wearable sensors into military applications offers numerous benefits, including improved situational awareness and mission effectiveness.

Military Wearable Sensors Market Size

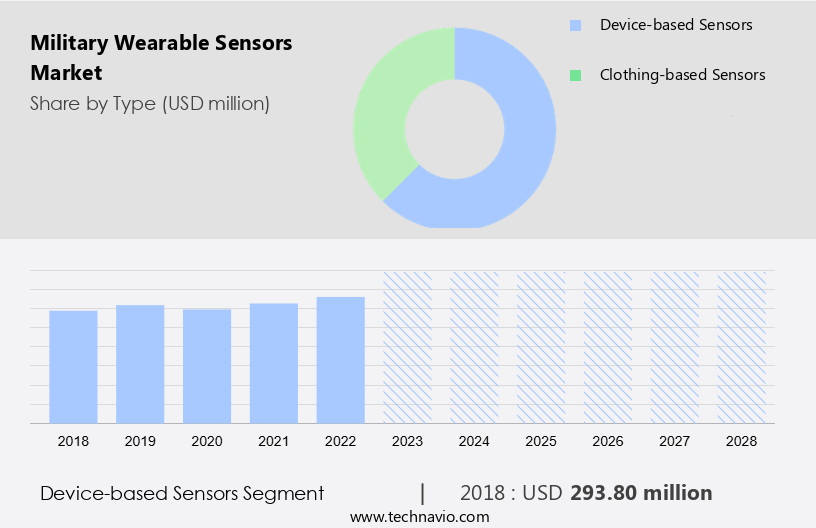
Get a glance at the market report of share of various segments Request Free Sample

The Device-based sensors segment was valued at USD 293.80 million in 2018 and showed a gradual increase during the forecast period.

Regional Analysis

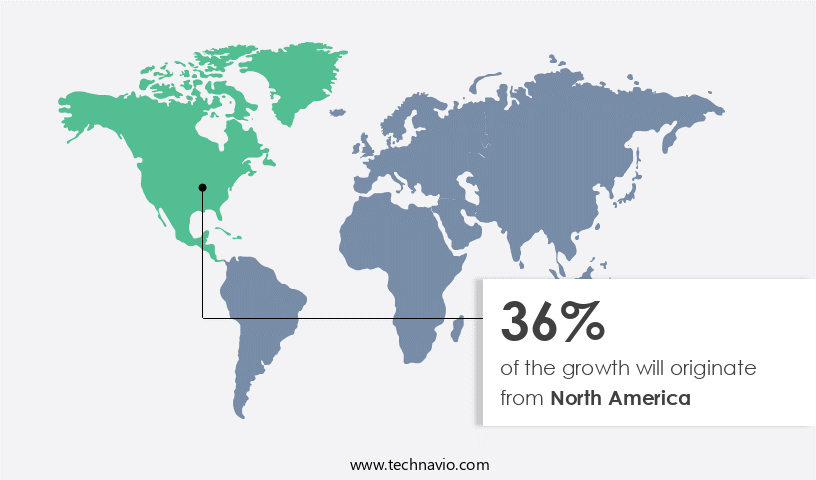
  • North America is estimated to contribute 36% to the growth of the global market during the forecast period.

Technavio's analysts have elaborately explained the regional trends and drivers that shape the market during the forecast period.

Military Wearable Sensors Market Share by Geography

For more insights on the market share of various regions Request Free Sample

The US military is investing significantly in the research and development of wearable technology to modernize its forces. This includes the creation of advanced soldier health monitoring systems and securing data transmitted remotely from military platforms. The US is the primary consumer of military wearable sensors in North America and is currently focusing on upgrading existing military capabilities. The US Army Research Agency is actively developing wearable devices for military use, while the aerospace and defense industry in the US is a leading innovator in technologically advanced aircraft, soldier modernization, space, and defense systems. Wearable technology for military applications includes body clothes integrated with biosensors, arm wear such as armbands and bracelets, and bodywear devices like chest straps and body-worn cameras.

Cloth-based sensors are also being explored for their potential in military applications. These technologies offer benefits such as calorie-burning tracking, real-time health monitoring, and improved situational awareness for soldiers.

Market Dynamics

Our researchers analyzed the data with 2023 as the base year, along with the key drivers, trends, and challenges. A holistic analysis of drivers will help companies refine their marketing strategies to gain a competitive advantage.

What are the key market drivers leading to the rise in the adoption of the Military Wearable Sensors Market?

Increased spending on military modernization programs is the key driver of the market.

  • The market encompasses a range of advanced technologies designed to enhance military capabilities and protect troops in various operational environments. This market includes architectural solutions for arm wear such as armbands, bracelets, and chest straps, as well as body clothes and clothing and underwear integrated with sensors. These devices offer customized features for heart rate monitoring, calorie burning, hydration level, respiration, and pressure sensors, among others. Military modernization efforts focus on mission-specific requirements, incorporating interoperability, cloud services, and IoT technologies for real-time data interpretation. Wearable technology in the military sector includes smart devices like bodywear devices, bodywear devices, body worn cameras, glasses, gloves, and goggles.
  • These devices are designed to operate under rugged conditions and withstand harsh environments, including dust, moisture, and extreme temperatures. Sensor manufacturers integrate electrical reserves, fibertronics, and magnetic fields into these devices for reliable performance and advanced functionality. Military wearable sensors also cater to entertainment applications, such as gaming consoles and techno fashion clothing, to enhance soldier morale and motivation. The market for military wearable sensors is driven by defense spending, the need for soldier monitoring, and the integration of sensors into various military equipment and systems. The future of military wearable technology lies in the development of smart platforms and smart devices, including smart socks, smartphone usage, and wearable ecosystems, to optimize performance and ensure the comfort level of troops.

What are the market trends shaping the Military Wearable Sensors Market?

The usage of IOT and big data in militaries is the upcoming trend in the market.

  • The market encompasses the use of Internet of Things (IoT) technologies in creating architectural solutions for military applications. These solutions involve bodywear devices such as arm wear, armbands, chest straps, bracelets, and clothing, including body clothes, clothing and underwear, and textiles. The sensors integrated into these devices can monitor physiological parameters like heart rate, calorie burning, hydration level, respiration, and fatigue. They can also detect environmental conditions such as dust, temperature, and moisture. Military wearable sensors are designed to meet the specific requirements of the Army and other defense forces. They offer customized features, including interoperability with other devices, cloud services, and real-time data interpretation.
  • These sensors are essential for soldier monitoring, providing command centers with critical information to optimize mission success. The market for military wearable sensors is driven by military modernization efforts and defense spending. The technological innovations in fibertronics, clothing, and wearable technology have led to the development of smart devices like glasses, gloves, goggles, and watches. These devices offer comfort level, reliability, and ruggedness, enabling soldiers to perform optimally under challenging conditions. The market faces challenges in thermal design, packaging and assembly, and reliability requirements. However, the benefits of these devices in enhancing soldier safety, improving mission effectiveness, and reducing operational costs make them a valuable investment for defense forces.

What challenges does the Military Wearable Sensors Market face during the growth?

The high cost of R and D is a key challenge affecting the market growth.

  • The market is experiencing significant growth due to increasing demand for advanced technology in tactical military applications. Military forces worldwide are adopting wearable sensors to enhance soldier safety and improve mission effectiveness. These sensors are integrated into various types of bodywear, including arm wear such as armbands and bracelets, body clothes like clothing and underwear, and specialized gear like gloves and helmets. Military wearable sensors come with various features, such as heart rate monitoring, calorie burning tracking, hydration level monitoring, and pressure sensors. They also offer customized features to cater to mission-specific requirements and interoperability with other military devices.
  • The sensors are designed to withstand rugged conditions and harsh operating temperatures, ensuring reliability and durability. The development of military wearable sensors involves the use of advanced technologies like IoT, fibertronics, and sensor integration into clothing and underwear. The sensors can detect physiological parameters, device orientation, and environmental conditions like dust, moisture, and magnetic fields. They can also provide real-time interpretation of data and connect to cloud services for analysis and reporting. Military modernization programs and defense spending are driving the growth of the market. companies must invest heavily in research and development to meet the demanding requirements of military applications, including comfort level, customized features, and reliability.

Exclusive Customer Landscape

The market forecasting report includes the adoption lifecycle of the market, covering from the innovator's stage to the laggard's stage. It focuses on adoption rates in different regions based on penetration. Furthermore, the market report also includes key purchase criteria and drivers of price sensitivity to help companies evaluate and develop their market growth analysis strategies.
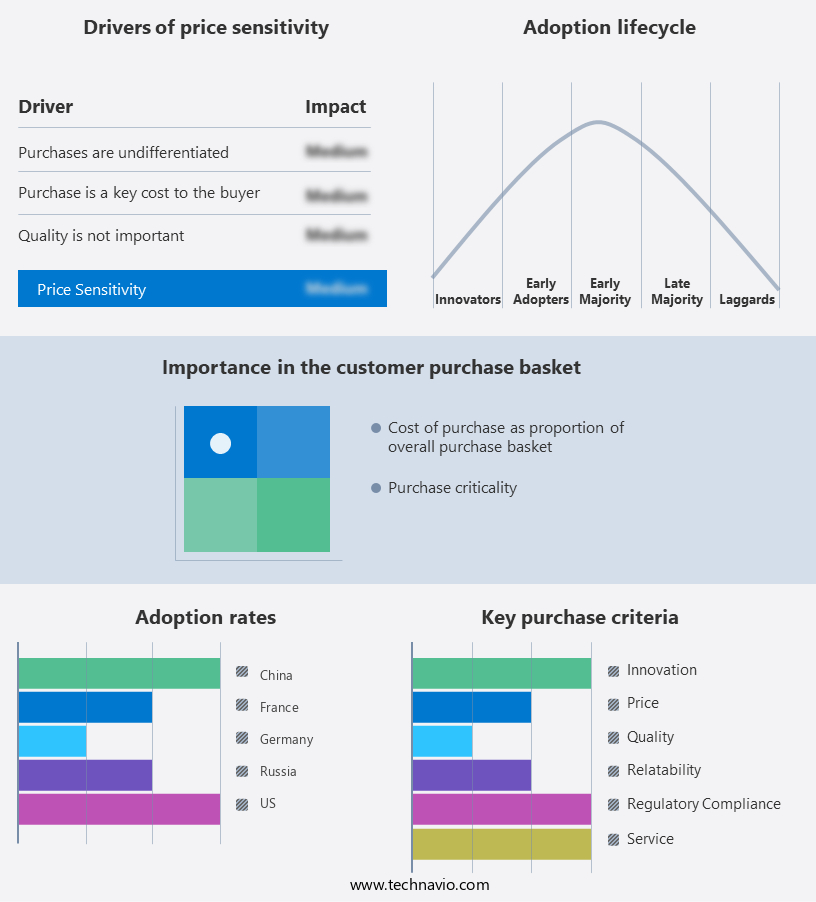
Military Wearable Sensors Market Share by Geography

 Customer Landscape

Key Companies & Market Insights

Companies are implementing various strategies, such as strategic alliances, market forecast, partnerships, mergers and acquisitions, geographical expansion, and product/service launches, to enhance their presence in the market.

The market research and growth report includes detailed analyses of the competitive landscape of the market and information about key companies, including:

  • ASELSAN AS
  • BAE Systems Plc
  • Bionic Power Inc.
  • Elbit Systems Ltd.
  • Epsilor Electric Fuel Ltd.
  • General Electric Co.
  • Honeywell International Inc.
  • Interactive Wear AG
  • L3Harris Technologies Inc.
  • Leonardo Spa
  • Lockheed Martin Corp.
  • Northrop Grumman Corp.
  • Rheinmetall AG
  • Saab AB
  • Safran SA
  • TE Connectivity Ltd.
  • Teledyne Technologies Inc.
  • Thales Group
  • TT Electronics Plc
  • Viasat Inc.

Qualitative and quantitative analysis of companies has been conducted to help clients understand the wider business environment as well as the strengths and weaknesses of key market players. Data is qualitatively analyzed to categorize companies as pure play, category-focused, industry-focused, and diversified; it is quantitatively analyzed to categorize companies as dominant, leading, strong, tentative, and weak.

Research Analyst Overview

Military wearable sensors come in various forms, including arm bands, armbands, chest straps, and clothing. Cloth-based sensors, fibertronics, and device-integrated sensors are increasingly popular due to their comfort level and seamless integration into military clothing. Wearable devices such as glasses, gloves, goggles, and wristwear, are also gaining popularity for their ability to enhance situational awareness and provide real-time data. Military wearable sensors are designed to withstand rugged conditions, including extreme temperatures, dust, and moisture. They are engineered to be reliable, with high interoperability and customized features to meet the unique requirements of military personnel. The sensors are also designed to be lightweight and unobtrusive, ensuring that they do not hinder soldier mobility or comfort. The market is expected to grow significantly in the coming years due to the increasing demand for advanced technology in defense applications. The market is also driven by the growing trend of techno fashion clothing and the integration of entertainment and gaming console features into military wearable technology. The integration of cloud services and smart devices into military wearable sensors is also a significant trend. These technologies enable real-time data analysis and interpretation, providing military command centers with valuable insights into soldier performance and mission status. The data collected by these sensors can be used to optimize military operations, improve soldier safety, and enhance mission success.

Moreover, the military wearable sensors have numerous applications, including health monitoring, soldier monitoring, and mission-critical data collection. They can be used to monitor heart rate, respiration, hydration levels, and other physiological parameters, enabling soldiers to maintain optimal health and performance. They can also be used to detect and respond to environmental conditions, such as temperature, humidity, and pressure, ensuring that soldiers are prepared for any situation. In conclusion, military wearable sensors represent a significant area of innovation in the defense industry, offering enhanced capabilities and improved soldier performance. These sensors are designed to meet the unique requirements of military personnel, providing real-time data and insights to optimize military operations and improve mission success. The market for military wearable sensors is expected to grow significantly in the coming years, driven by military modernization efforts, mission-specific requirements, and the integration of IoT technologies.

Market Scope

Report Coverage

Details

Page number

187

Base year

2023

Historic period

2018-2022

Forecast period

2024-2028

Growth momentum & CAGR

Accelerate at a CAGR of 7.28%

Market growth 2024-2028

USD 187.4 million

Market structure

Fragmented

YoY growth 2023-2024(%)

6.65

Key countries

US, China, Germany, France, and Russia

Competitive landscape

Leading Companies, Market Positioning of Companies, Competitive Strategies, and Industry Risks

Request Free Sample

What are the Key Data Covered in this Market Research and Growth Report?

  • CAGR of the market during the forecast period
  • Detailed information on factors that will drive the market growth and forecasting between 2024 and 2028
  • Precise estimation of the size of the market  and its contribution of the market in focus to the parent market
  • Accurate predictions about upcoming market growth and trends and changes in consumer behaviour
  • Growth of the market across North America, Europe, APAC, Middle East and Africa, and South America
  • Thorough analysis of the market's competitive landscape and detailed information about companies
  • Comprehensive analysis of factors that will challenge the growth of market companies

We can help! Our analysts can customize this market research report to meet your requirements. Get in touch

1 Executive Summary

  • 1.1 Market overview
    • Executive Summary - Chart on Market Overview
    • Executive Summary - Data Table on Market Overview
    • Executive Summary - Chart on Global Market Characteristics
    • Executive Summary - Chart on Market by Geography
    • Executive Summary - Chart on Market Segmentation by Type
    • Executive Summary - Chart on Market Segmentation by Application
    • Executive Summary - Chart on Incremental Growth
    • Executive Summary - Data Table on Incremental Growth
    • Executive Summary - Chart on Company Market Positioning

2 Market Landscape

  • 2.1 Market ecosystem
    • Parent Market
    • Data Table on - Parent Market
  • 2.2 Market characteristics
    • Market characteristics analysis
  • 2.3 Value chain analysis
    • Value Chain Analysis

3 Market Sizing

  • 3.1 Market definition
    • Offerings of companies included in the market definition
  • 3.2 Market segment analysis
    • Market segments
  • 3.3 Market size 2023
    • 3.4 Market outlook: Forecast for 2023-2028
      • Chart on Global - Market size and forecast 2023-2028 ($ million)
      • Data Table on Global - Market size and forecast 2023-2028 ($ million)
      • Chart on Global Market: Year-over-year growth 2023-2028 (%)
      • Data Table on Global Market: Year-over-year growth 2023-2028 (%)

    4 Historic Market Size

    • 4.1 Global Military Wearable Sensors Market 2018 - 2022
      • Historic Market Size - Data Table on Global Military Wearable Sensors Market 2018 - 2022 ($ million)
    • 4.2 Type segment analysis 2018 - 2022
      • Historic Market Size - Type Segment 2018 - 2022 ($ million)
    • 4.3 Application segment analysis 2018 - 2022
      • Historic Market Size - Application Segment 2018 - 2022 ($ million)
    • 4.4 Geography segment analysis 2018 - 2022
      • Historic Market Size - Geography Segment 2018 - 2022 ($ million)
    • 4.5 Country segment analysis 2018 - 2022
      • Historic Market Size - Country Segment 2018 - 2022 ($ million)

    5 Five Forces Analysis

    • 5.1 Five forces summary
      • Five forces analysis - Comparison between 2023 and 2028
    • 5.2 Bargaining power of buyers
      • Bargaining power of buyers - Impact of key factors 2023 and 2028
    • 5.3 Bargaining power of suppliers
      • Bargaining power of suppliers - Impact of key factors in 2023 and 2028
    • 5.4 Threat of new entrants
      • Threat of new entrants - Impact of key factors in 2023 and 2028
    • 5.5 Threat of substitutes
      • Threat of substitutes - Impact of key factors in 2023 and 2028
    • 5.6 Threat of rivalry
      • Threat of rivalry - Impact of key factors in 2023 and 2028
    • 5.7 Market condition
      • Chart on Market condition - Five forces 2023 and 2028

    6 Market Segmentation by Type

    • 6.1 Market segments
      • Chart on Type - Market share 2023-2028 (%)
      • Data Table on Type - Market share 2023-2028 (%)
    • 6.2 Comparison by Type
      • Chart on Comparison by Type
      • Data Table on Comparison by Type
    • 6.3 Device-based sensors - Market size and forecast 2023-2028
      • Chart on Device-based sensors - Market size and forecast 2023-2028 ($ million)
      • Data Table on Device-based sensors - Market size and forecast 2023-2028 ($ million)
      • Chart on Device-based sensors - Year-over-year growth 2023-2028 (%)
      • Data Table on Device-based sensors - Year-over-year growth 2023-2028 (%)
    • 6.4 Clothing-based sensors - Market size and forecast 2023-2028
      • Chart on Clothing-based sensors - Market size and forecast 2023-2028 ($ million)
      • Data Table on Clothing-based sensors - Market size and forecast 2023-2028 ($ million)
      • Chart on Clothing-based sensors - Year-over-year growth 2023-2028 (%)
      • Data Table on Clothing-based sensors - Year-over-year growth 2023-2028 (%)
    • 6.5 Market opportunity by Type
      • Market opportunity by Type ($ million)
      • Data Table on Market opportunity by Type ($ million)

    7 Market Segmentation by Application

    • 7.1 Market segments
      • Chart on Application - Market share 2023-2028 (%)
      • Data Table on Application - Market share 2023-2028 (%)
    • 7.2 Comparison by Application
      • Chart on Comparison by Application
      • Data Table on Comparison by Application
    • 7.3 Headwear - Market size and forecast 2023-2028
      • Chart on Headwear - Market size and forecast 2023-2028 ($ million)
      • Data Table on Headwear - Market size and forecast 2023-2028 ($ million)
      • Chart on Headwear - Year-over-year growth 2023-2028 (%)
      • Data Table on Headwear - Year-over-year growth 2023-2028 (%)
    • 7.4 Bodywear - Market size and forecast 2023-2028
      • Chart on Bodywear - Market size and forecast 2023-2028 ($ million)
      • Data Table on Bodywear - Market size and forecast 2023-2028 ($ million)
      • Chart on Bodywear - Year-over-year growth 2023-2028 (%)
      • Data Table on Bodywear - Year-over-year growth 2023-2028 (%)
    • 7.5 Eyewear - Market size and forecast 2023-2028
      • Chart on Eyewear - Market size and forecast 2023-2028 ($ million)
      • Data Table on Eyewear - Market size and forecast 2023-2028 ($ million)
      • Chart on Eyewear - Year-over-year growth 2023-2028 (%)
      • Data Table on Eyewear - Year-over-year growth 2023-2028 (%)
    • 7.6 Wristwear - Market size and forecast 2023-2028
      • Chart on Wristwear - Market size and forecast 2023-2028 ($ million)
      • Data Table on Wristwear - Market size and forecast 2023-2028 ($ million)
      • Chart on Wristwear - Year-over-year growth 2023-2028 (%)
      • Data Table on Wristwear - Year-over-year growth 2023-2028 (%)
    • 7.7 Hearables - Market size and forecast 2023-2028
      • Chart on Hearables - Market size and forecast 2023-2028 ($ million)
      • Data Table on Hearables - Market size and forecast 2023-2028 ($ million)
      • Chart on Hearables - Year-over-year growth 2023-2028 (%)
      • Data Table on Hearables - Year-over-year growth 2023-2028 (%)
    • 7.8 Market opportunity by Application
      • Market opportunity by Application ($ million)
      • Data Table on Market opportunity by Application ($ million)

    8 Customer Landscape

    • 8.1 Customer landscape overview
      • Analysis of price sensitivity, lifecycle, customer purchase basket, adoption rates, and purchase criteria

    9 Geographic Landscape

    • 9.1 Geographic segmentation
      • Chart on Market share by geography 2023-2028 (%)
      • Data Table on Market share by geography 2023-2028 (%)
    • 9.2 Geographic comparison
      • Chart on Geographic comparison
      • Data Table on Geographic comparison
    • 9.3 North America - Market size and forecast 2023-2028
      • Chart on North America - Market size and forecast 2023-2028 ($ million)
      • Data Table on North America - Market size and forecast 2023-2028 ($ million)
      • Chart on North America - Year-over-year growth 2023-2028 (%)
      • Data Table on North America - Year-over-year growth 2023-2028 (%)
    • 9.4 Europe - Market size and forecast 2023-2028
      • Chart on Europe - Market size and forecast 2023-2028 ($ million)
      • Data Table on Europe - Market size and forecast 2023-2028 ($ million)
      • Chart on Europe - Year-over-year growth 2023-2028 (%)
      • Data Table on Europe - Year-over-year growth 2023-2028 (%)
    • 9.5 APAC - Market size and forecast 2023-2028
      • Chart on APAC - Market size and forecast 2023-2028 ($ million)
      • Data Table on APAC - Market size and forecast 2023-2028 ($ million)
      • Chart on APAC - Year-over-year growth 2023-2028 (%)
      • Data Table on APAC - Year-over-year growth 2023-2028 (%)
    • 9.6 Middle East and Africa - Market size and forecast 2023-2028
      • Chart on Middle East and Africa - Market size and forecast 2023-2028 ($ million)
      • Data Table on Middle East and Africa - Market size and forecast 2023-2028 ($ million)
      • Chart on Middle East and Africa - Year-over-year growth 2023-2028 (%)
      • Data Table on Middle East and Africa - Year-over-year growth 2023-2028 (%)
    • 9.7 South America - Market size and forecast 2023-2028
      • Chart on South America - Market size and forecast 2023-2028 ($ million)
      • Data Table on South America - Market size and forecast 2023-2028 ($ million)
      • Chart on South America - Year-over-year growth 2023-2028 (%)
      • Data Table on South America - Year-over-year growth 2023-2028 (%)
    • 9.8 US - Market size and forecast 2023-2028
      • Chart on US - Market size and forecast 2023-2028 ($ million)
      • Data Table on US - Market size and forecast 2023-2028 ($ million)
      • Chart on US - Year-over-year growth 2023-2028 (%)
      • Data Table on US - Year-over-year growth 2023-2028 (%)
    • 9.9 China - Market size and forecast 2023-2028
      • Chart on China - Market size and forecast 2023-2028 ($ million)
      • Data Table on China - Market size and forecast 2023-2028 ($ million)
      • Chart on China - Year-over-year growth 2023-2028 (%)
      • Data Table on China - Year-over-year growth 2023-2028 (%)
    • 9.10 Germany - Market size and forecast 2023-2028
      • Chart on Germany - Market size and forecast 2023-2028 ($ million)
      • Data Table on Germany - Market size and forecast 2023-2028 ($ million)
      • Chart on Germany - Year-over-year growth 2023-2028 (%)
      • Data Table on Germany - Year-over-year growth 2023-2028 (%)
    • 9.11 France - Market size and forecast 2023-2028
      • Chart on France - Market size and forecast 2023-2028 ($ million)
      • Data Table on France - Market size and forecast 2023-2028 ($ million)
      • Chart on France - Year-over-year growth 2023-2028 (%)
      • Data Table on France - Year-over-year growth 2023-2028 (%)
    • 9.12 Russia - Market size and forecast 2023-2028
      • Chart on Russia - Market size and forecast 2023-2028 ($ million)
      • Data Table on Russia - Market size and forecast 2023-2028 ($ million)
      • Chart on Russia - Year-over-year growth 2023-2028 (%)
      • Data Table on Russia - Year-over-year growth 2023-2028 (%)
    • 9.13 Market opportunity by geography
      • Market opportunity by geography ($ million)
      • Data Tables on Market opportunity by geography ($ million)

    10 Drivers, Challenges, and Opportunity/Restraints

    • 10.1 Market drivers
      • 10.2 Market challenges
        • 10.3 Impact of drivers and challenges
          • Impact of drivers and challenges in 2023 and 2028
        • 10.4 Market opportunities/restraints

          11 Competitive Landscape

          • 11.1 Overview
            • 11.2 Competitive Landscape
              • Overview on criticality of inputs and factors of differentiation
            • 11.3 Landscape disruption
              • Overview on factors of disruption
            • 11.4 Industry risks
              • Impact of key risks on business

            12 Competitive Analysis

            • 12.1 Companies profiled
              • Companies covered
            • 12.2 Market positioning of companies
              • Matrix on companies position and classification
            • 12.3 ASELSAN AS
              • ASELSAN AS - Overview
              • ASELSAN AS - Product / Service
              • ASELSAN AS - Key news
              • ASELSAN AS - Key offerings
            • 12.4 BAE Systems Plc
              • BAE Systems Plc - Overview
              • BAE Systems Plc - Business segments
              • BAE Systems Plc - Key news
              • BAE Systems Plc - Key offerings
              • BAE Systems Plc - Segment focus
            • 12.5 Bionic Power Inc.
              • Bionic Power Inc. - Overview
              • Bionic Power Inc. - Product / Service
              • Bionic Power Inc. - Key offerings
            • 12.6 Elbit Systems Ltd.
              • Elbit Systems Ltd. - Overview
              • Elbit Systems Ltd. - Product / Service
              • Elbit Systems Ltd. - Key news
              • Elbit Systems Ltd. - Key offerings
            • 12.7 General Electric Co.
              • General Electric Co. - Overview
              • General Electric Co. - Business segments
              • General Electric Co. - Key news
              • General Electric Co. - Key offerings
              • General Electric Co. - Segment focus
            • 12.8 Honeywell International Inc.
              • Honeywell International Inc. - Overview
              • Honeywell International Inc. - Business segments
              • Honeywell International Inc. - Key news
              • Honeywell International Inc. - Key offerings
              • Honeywell International Inc. - Segment focus
            • 12.9 L3Harris Technologies Inc.
              • L3Harris Technologies Inc. - Overview
              • L3Harris Technologies Inc. - Business segments
              • L3Harris Technologies Inc. - Key news
              • L3Harris Technologies Inc. - Key offerings
              • L3Harris Technologies Inc. - Segment focus
            • 12.10 Leonardo Spa
              • Leonardo Spa - Overview
              • Leonardo Spa - Business segments
              • Leonardo Spa - Key news
              • Leonardo Spa - Key offerings
              • Leonardo Spa - Segment focus
            • 12.11 Lockheed Martin Corp.
              • Lockheed Martin Corp. - Overview
              • Lockheed Martin Corp. - Business segments
              • Lockheed Martin Corp. - Key news
              • Lockheed Martin Corp. - Key offerings
              • Lockheed Martin Corp. - Segment focus
            • 12.12 Northrop Grumman Corp.
              • Northrop Grumman Corp. - Overview
              • Northrop Grumman Corp. - Business segments
              • Northrop Grumman Corp. - Key news
              • Northrop Grumman Corp. - Key offerings
              • Northrop Grumman Corp. - Segment focus
            • 12.13 Rheinmetall AG
              • Rheinmetall AG - Overview
              • Rheinmetall AG - Business segments
              • Rheinmetall AG - Key news
              • Rheinmetall AG - Key offerings
              • Rheinmetall AG - Segment focus
            • 12.14 Saab AB
              • Saab AB - Overview
              • Saab AB - Business segments
              • Saab AB - Key offerings
              • Saab AB - Segment focus
            • 12.15 Safran SA
              • Safran SA - Overview
              • Safran SA - Business segments
              • Safran SA - Key news
              • Safran SA - Key offerings
              • Safran SA - Segment focus
            • 12.16 Teledyne Technologies Inc.
              • Teledyne Technologies Inc. - Overview
              • Teledyne Technologies Inc. - Business segments
              • Teledyne Technologies Inc. - Key news
              • Teledyne Technologies Inc. - Key offerings
              • Teledyne Technologies Inc. - Segment focus
            • 12.17 Thales Group
              • Thales Group - Overview
              • Thales Group - Business segments
              • Thales Group - Key news
              • Thales Group - Key offerings
              • Thales Group - Segment focus

            13 Appendix

            • 13.1 Scope of the report
              • 13.2 Inclusions and exclusions checklist
                • Inclusions checklist
                • Exclusions checklist
              • 13.3 Currency conversion rates for US$
                • Currency conversion rates for US$
              • 13.4 Research methodology
                • Research methodology
              • 13.5 Data procurement
                • Information sources
              • 13.6 Data validation
                • Data validation
              • 13.7 Validation techniques employed for market sizing
                • Validation techniques employed for market sizing
              • 13.8 Data synthesis
                • Data synthesis
              • 13.9 360 degree market analysis
                • 360 degree market analysis
              • 13.10 List of abbreviations
                • List of abbreviations

              Research Methodology

              Technavio presents a detailed picture of the market by way of study, synthesis, and summation of data from multiple sources. The analysts have presented the various facets of the market with a particular focus on identifying the key industry influencers. The data thus presented is comprehensive, reliable, and the result of extensive research, both primary and secondary.

              INFORMATION SOURCES

              Primary sources

              • Manufacturers and suppliers
              • Channel partners
              • Industry experts
              • Strategic decision makers

              Secondary sources

              • Industry journals and periodicals
              • Government data
              • Financial reports of key industry players
              • Historical data
              • Press releases

              DATA ANALYSIS

              Data Synthesis

              • Collation of data
              • Estimation of key figures
              • Analysis of derived insights

              Data Validation

              • Triangulation with data models
              • Reference against proprietary databases
              • Corroboration with industry experts

              REPORT WRITING

              Qualitative

              • Market drivers
              • Market challenges
              • Market trends
              • Five forces analysis

              Quantitative

              • Market size and forecast
              • Market segmentation
              • Geographical insights
              • Competitive landscape

              Interested in this report?

              Get your sample now to see our research methodology and insights!

              Download Now

              Frequently Asked Questions

              Military Wearable Sensors market growth will increase by $ 187.4 mn during 2024-2028.

              The Military Wearable Sensors market is expected to grow at a CAGR of 7.28% during 2024-2028.

              Military Wearable Sensors market is segmented by Type( Device-based sensors, Clothing-based sensors) Application( Headwear, Bodywear, Eyewear, Wristwear, Hearables)

              ASELSAN AS, BAE Systems Plc, Bionic Power Inc., Elbit Systems Ltd., Epsilor Electric Fuel Ltd., General Electric Co., Honeywell International Inc., Interactive Wear AG, L3Harris Technologies Inc., Leonardo Spa, Lockheed Martin Corp., Northrop Grumman Corp., Rheinmetall AG, Saab AB, Safran SA, TE Connectivity Ltd., Teledyne Technologies Inc., Thales Group, TT Electronics Plc, Viasat Inc. are a few of the key vendors in the Military Wearable Sensors market.

              North America will register the highest growth rate of 36% among the other regions. Therefore, the Military Wearable Sensors market in North America is expected to garner significant business opportunities for the vendors during the forecast period.

              US, China, Germany, France, Russia

              • Increased spending on military modernization programsModernization of the military is a complex process is the driving factor this market.
              • as it includes fundamental changes in the technological capacities to strengthen military capabilities and accomplish all strategic objectives. The military of a country aims at increasing strength through its transformation into a professional force is the driving factor this market.
              • which should be well-trained and equipped with contemporary systems of armament and technique is the driving factor this market.
              • modern and interoperable tools is the driving factor this market.
              • and capable of accomplishing operations of a larger spectrum. The modernization of the military focuses on several important areas is the driving factor this market.
              • such as the following:Control and command systemsSystems of information is the driving factor this market.
              • including the systems of the surveillance of the maritime and air space is the driving factor this market.
              • as well as the security of the systems of other intelligence equipmentWearable devices for the protection of troopsEquipment and systems for the self-support of troopsEquipment to ensure the transport and maneuvering of troopsArmamentsCountries across the globe are investing in modernization programs by adopting military wearable sensors to strengthen their military capabilities. The Army has unveiled the final solicitation for the recompete of a potential $975 million training and technical support services contract. Proposals for the five-year Mission Training Complex Capabilities Support. Such initiatives are also undertaken by the military to counter-terrorism is the driving factor this market.
              • which will increase the demand for military wearable sensors during the forecast period. is the driving factor this market.

              The Military Wearable Sensors market vendors should focus on grabbing business opportunities from the Device-based sensors segment as it accounted for the largest market share in the base year.
              RIA - Research AI Assistant
              Ask RIA