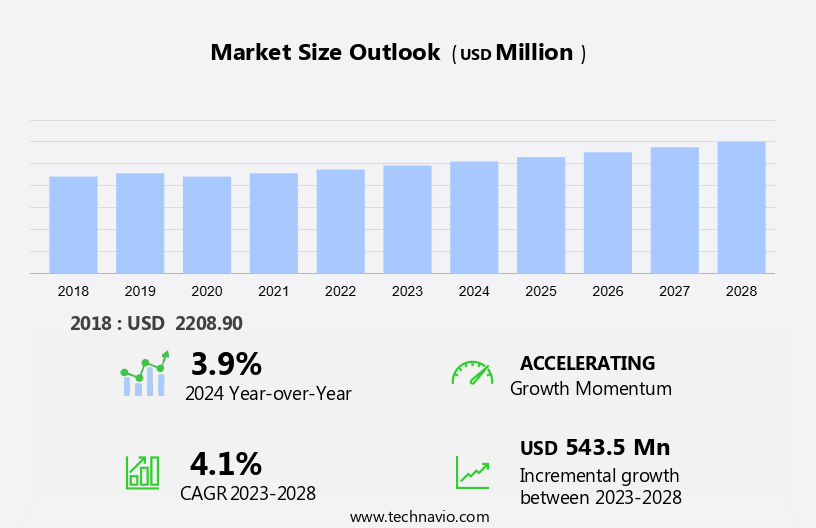
Mining Chemicals Market in North America Size and Trends
The mining chemicals market in North America size is forecast to increase by USD 543.5 million at a CAGR of 4.1% between 2023 and 2028. The mining chemicals market is experiencing significant growth due to several key factors. One major trend is the increasing demand for water treatment solutions in the mining industry, particularly in North America, as mining activities in Canada and Mexico continue to expand. Another driver is the use of advanced analytics to optimize the efficiency of wastewater treatment processes. Additionally, there is a growing emphasis on the use of eco-friendly compounds, such as high purity minerals, surfactants, and dispersants, to minimize the environmental impact of mining operations. Furthermore, the market is witnessing increased adoption of scale inhibitors, dissolvable extractants, consumption inhibitors, frothers, chelants, pH modifiers, and flocculants to improve mineral handling and extract gold more effectively. Overall, the mining chemicals market is poised for continued growth as mining companies seek to maximize efficiency and minimize environmental impact.
The mining chemicals market is experiencing significant growth due to the increasing demand for clean energy technologies and the expansion of the coal industry. Mining chemicals are essential in various mining processes, including mineral production and extractive metallurgy. These chemicals play a crucial role in improving the efficiency and productivity of mining operations. Mining chemicals are used in diverse applications, such as water treatment, high purity minerals production, and eco-friendly compounds. In water treatment, mining chemicals are employed to maintain optimal water quality in mining processes, ensuring the efficient use of water and reducing environmental impact. High purity minerals production relies on mining chemicals to extract minerals with a high degree of purity, which is essential for various industries, including electronics and pharmaceuticals.
Moreover, the shift towards clean energy technologies is driving the demand for mining chemicals in the production of batteries for electric vehicles. Lithium, cobalt, and graphite are essential minerals used in the production of batteries, and mining chemicals are used to extract and process these minerals efficiently. Mining chemicals are also used in the coal industry for coal washing and coal combustion processes. Coal washing involves the use of chemicals to remove impurities from coal, resulting in a higher quality product. In coal combustion, mining chemicals are used to improve the combustion process, reducing emissions and increasing the efficiency of electricity generation. The adoption of digital mines is another trend driving the growth of the mining chemicals market. Digital mines utilize advanced technologies such as sensors, automation, and data analytics to optimize mining operations. Mining chemicals are used to enhance the performance of these technologies, improving the efficiency and productivity of mining processes. The mining chemicals market is segmented into various categories, including surfactants, scale inhibitors, dissolvable extractants, consumption inhibitors, frothers, chelants, hazardous chemicals, and others. Each category caters to specific mining applications, such as ore flotation, mineral processing, and water treatment. The mining chemicals market is expected to grow at a steady pace due to the increasing demand for minerals and metals, the expansion of the coal industry, and the shift towards clean energy technologies.
Furthermore, the development of new mining technologies and the increasing focus on sustainable mining practices are expected to provide opportunities for growth in the mining chemicals market. In conclusion, the mining chemicals market is a vital component of the mining industry, playing a crucial role in improving the efficiency and productivity of mining operations. The market is driven by various factors, including the increasing demand for clean energy technologies, the expansion of the coal industry, and the adoption of digital mines. The mining chemicals market is expected to continue growing steadily, providing opportunities for companies to innovate and expand their offerings.
Market Segmentation
The market research report provides comprehensive data (region-wise segment analysis), with forecasts and estimates in "USD million" for the period 2024-2028, as well as historical data from 2018 - 2022 for the following segments.
- Application
- Explosives and drilling
- Mineral processing
- Water treatment
- Stockpiles
- Others
- Geography
- North America
- Canada
- Mexico
- US
- North America
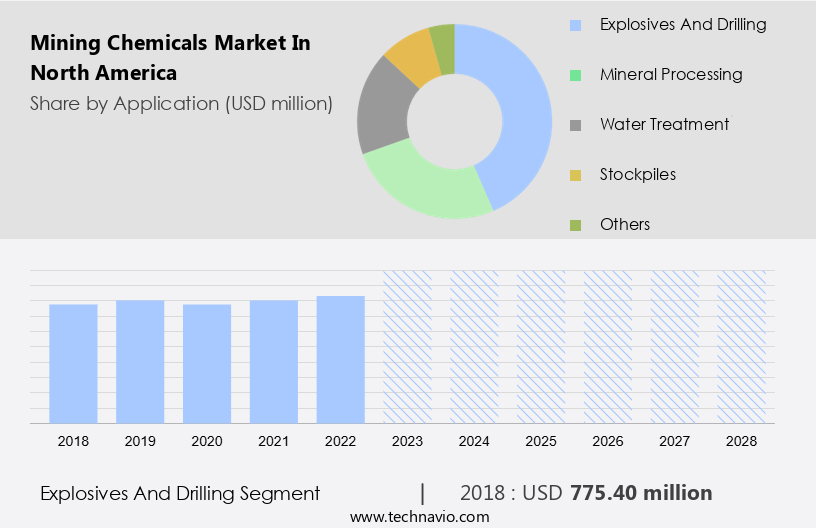
By Application Insights
The explosives and drilling segment is estimated to witness significant growth during the forecast period. The mining industry relies on various types of equipment for the extraction and processing of minerals, including Crushing equipment, Grinding equipment, Sizing equipment, Classification equipment, Concentration equipment, and Dewatering equipment. These machines are essential for increasing mine profitability by facilitating the efficient separation of mineral concentrate from waste rock. Mining operations involve the extraction of metals and industrial minerals through methods such as drill and blast. Explosives, which are self-sustaining compounds, are utilized to break up large pieces of rock in this process. Aluminum mining, for instance, employs a combination of fuel and oxidizer in explosives to fragment the orebody.
Get a glance at the market share of various segments Download the PDF Sample
The explosives and drilling segment was valued at USD 775.40 million in 2018. Subsequently, the ore is transported to a processing facility for further refinement. Flotation reagents are commonly used in this stage to enhance the separation of valuable minerals, such as precious metals and base metals, from the waste rock. The mineral concentrate obtained from this process is then dewatered using Dewatering equipment to remove excess water and prepare it for sale or further processing. The effective utilization of these mining equipment types significantly contributes to the overall efficiency and profitability of mining operations.
Our researchers analyzed the data with 2023 as the base year, along with the key drivers, trends, and challenges. A holistic analysis of drivers will help companies refine their marketing strategies to gain a competitive advantage.
Mining Chemicals Market in North America Driver
Increasing mining activities in Canada and Mexico is notably driving market growth. Mining chemicals play a crucial role in enhancing the productivity and efficiency of mining and mineral processing industries. These chemicals aid in maximizing selectivity and recovery while offering environmental benefits. The demand for mining chemicals is significant due to their applications in various industries, including paints and coatings, graphite, cobalt, lithium, and clean energy technologies. The global consumption of base metals like iron, steel, aluminum, and others, as well as precious metals such as silver, gold, and platinum, has witnessed consistent growth. This trend is particularly noticeable in countries like Canada and Mexico, which are major players in mining activities, producing over 60 metals and minerals collectively. Mining chemicals are indispensable in the processing of metal ores. In the context of the US mining industry, these chemicals contribute to the production of essential minerals and metals. For instance, they are used in the extraction of iron ore, which is a critical component in electricity generation and the steel industry. Similarly, mining chemicals are integral to the processing of nickel, a key component in electric vehicle batteries.
Moreover, the adoption of advanced technologies like digital mines, sensors, and cleaner production methods is transforming the mining sector. Mining chemicals help facilitate this transition by improving the efficiency and sustainability of mining operations. As the mining industry continues to evolve, the demand for mining chemicals is expected to remain strong. In conclusion, mining chemicals are an essential component of the mining and mineral processing industries, offering productivity improvements, environmental benefits, and enabling the adoption of advanced technologies. The US mining industry stands to benefit significantly from the continued use and advancement of mining chemicals. Thus, such factors are driving the growth of the market during the forecast period.
Mining Chemicals Market in North America Trends
The use of analytics to drive efficiency in wastewater treatment is the key trend in the market. In today's data-driven business landscape, the importance of effectively utilizing data in various industries is undeniable. One such sector generating substantial data is the water and wastewater treatment industry, including municipal and industrial plants. This data encompasses various aspects, including the consumption of essential inputs like energy and chemicals, and equipment performance metrics such as sewer flows and meter readings. One key industry application of this data is the mining chemicals market. Mining chemicals are integral to water treatment processes, employing high purity minerals, eco-friendly compounds, and specialized chemicals like surfactants, scale inhibitors, dissolvable extractants, consumption inhibitors, frothers, chelants, dispersants, pH modifiers, and flocculants. Proper data collection and analysis can optimize the usage of these chemicals, leading to cost savings and enhanced operational efficiency. Mining chemicals play a crucial role in mineral handling and gold extraction.
For instance, scale inhibitors prevent mineral buildup in water treatment systems, while dispersants improve the separation of valuable minerals from waste. Frothers enhance the froth flotation process, a primary method for gold extraction. By harnessing the power of data to optimize the usage of these chemicals, mining operations can significantly improve their overall productivity and profitability. In conclusion, the mining chemicals market is an essential component of the water and wastewater treatment industry, with various applications in mineral handling and gold extraction. Effective data collection and analysis can lead to optimized chemical usage, cost savings, and increased operational efficiency. Thus, such trends will shape the growth of the market during the forecast period.
Mining Chemicals Market in North America Challenge
Growing awareness of mining chemicals on the environment is the major challenge that affects the growth of the market. Mining activities involve the use of various chemicals for mineral extraction and processing, which can pose environmental and health risks. In the mining industry, chemicals such as cyanide, sulfuric acid, and solvents are utilized for froth flotation during phosphate, zinc, aluminum, and gold production. Nitric acid and ammonium nitrate are employed as explosives for drilling applications.
Additionally, chemicals like gasoline, diesel fuel, and exhaust emissions from mining equipment and material handling machinery contribute to pollution. These chemicals can negatively impact water quality and availability, rendering water bodies and adjacent land uninhabitable. The mining sector's environmental footprint is significant, with potential consequences for the health of miners and nearby communities. Mining projects can have a substantial impact on water resources, making it essential to prioritize wastewater treatment and efficient water usage. Furthermore, the production of specialty minerals, such as rare earth metals, also involves the use of chemicals that require careful handling and disposal to minimize environmental harm. In conclusion, the mining industry's reliance on chemicals for mineral extraction and processing necessitates a focus on sustainable practices and responsible use of chemicals to mitigate potential environmental and health risks. Ensuring proper wastewater treatment and efficient water usage are crucial aspects of maintaining the sustainability and viability of mining operations. Hence, the above factors will impede the growth of the market during the forecast period.
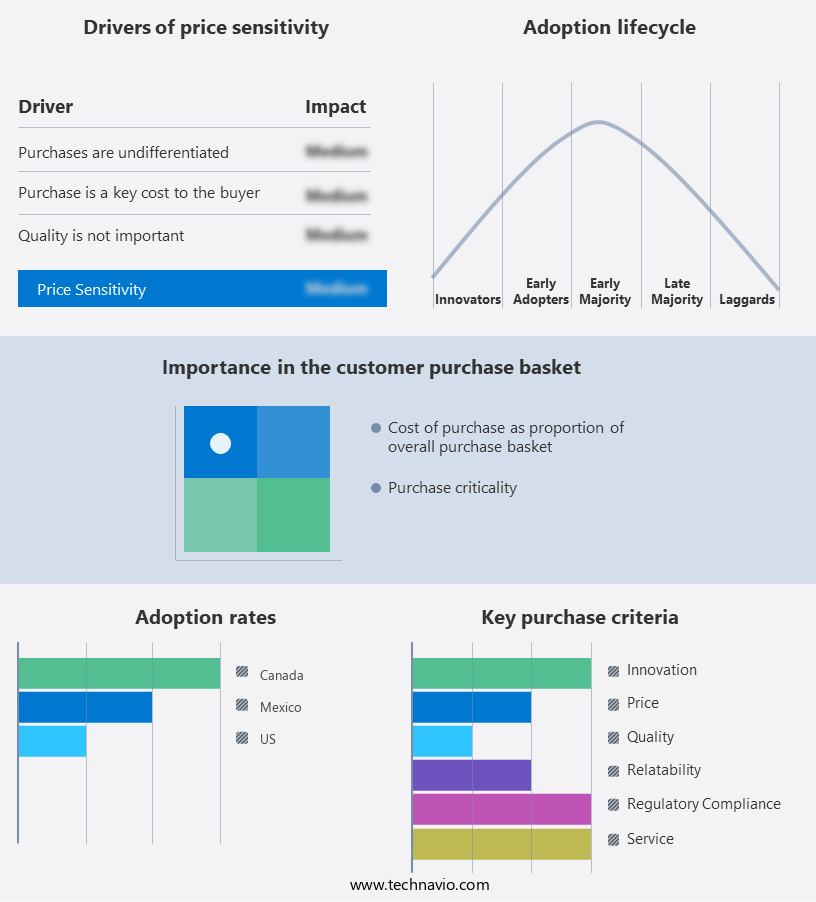
Exclusive Customer Landscape
The market forecasting report includes the adoption lifecycle of the market, covering from the innovator's stage to the laggard's stage. It focuses on adoption rates in different regions based on penetration. Furthermore, the report also includes key purchase criteria and drivers of price sensitivity to help companies evaluate and develop their market growth analysis strategies.
Customer Landscape
Key Companies & Market Insights
Companies are implementing various strategies, such as strategic alliances, partnerships, mergers and acquisitions, geographical expansion, and product/service launches, to enhance their presence in the market.
3M Co. - The company offers fused silica advanced Shell System GM2, which is a mining chemical.
The market research and growth report also includes detailed analyses of the competitive landscape of the market and information about key companies, including:
- 3M Co.
- AECI Ltd.
- Akzo Nobel NV
- ArrMaz Products Inc.
- BASF SE
- Clariant International Ltd
- CP Kelco US Inc.
- Ecolab Inc.
- Exxon Mobil Corp.
- FMC Corp.
- General Electric Co.
- Huntsman Corp.
- Orica Ltd.
- Sasol Ltd.
- SNF Group
- Solvay SA
- Tennant Chemicals Co. ltd.
- The Chemours Co.
- Zinkan Enterprises Inc.
Qualitative and quantitative analysis of companies has been conducted to help clients understand the wider business environment as well as the strengths and weaknesses of key market players. Data is qualitatively analyzed to categorize companies as pure play, category-focused, industry-focused, and diversified; it is quantitatively analyzed to categorize companies as dominant, leading, strong, tentative, and weak.
The mining chemicals market is a significant sector in the global mining industry, supplying a range of specialized chemicals used in various mining processes. These chemicals play a crucial role in mineral production, including mineral processing, froth flotation, water treatment, and tailings management. They are essential in extracting metals from ores, improving ore grade quality, and enhancing mine profitability. The market caters to diverse mining activities, such as coal production, gold production, and base metals mining, including copper, nickel, zinc, and aluminum. Mining chemicals are also used in the production of industrial minerals, precious metals, and specialty minerals. Key mining chemicals include graphite, lithium, cobalt, and rare earth metals, which are integral to clean energy technologies like electric vehicle batteries and renewable energy sources.
In summary, other chemicals like phosphate, sodium hydroxide, ammonium nitrate, calcium hydroxide, and soda ash are used in cement industries and steel production. Mining chemicals are also used in various applications, such as drilling, explosives, and coal industry. Digital mines and sensors are increasingly being integrated into mining operations to optimize mineral handling, reduce waste, and promote responsible mining practices. The mining chemicals market is continually evolving to meet the demands of the mining industry, with a focus on eco-friendly compounds, circular economy, and water conservation. This includes the development of dissolvable extractants, chelating agents, and ion-exchange resins to minimize the use of hazardous chemicals and promote sustainable mining practices.
|
Market Scope |
|
|
Report Coverage |
Details |
|
Page number |
143 |
|
Base year |
2023 |
|
Historic period |
2018 - 2022 |
|
Forecast period |
2024-2028 |
|
Growth momentum & CAGR |
Accelerate at a CAGR of 4.1% |
|
Market growth 2024-2028 |
USD 543.5 million |
|
Market structure |
Fragmented |
|
YoY growth 2023-2024(%) |
3.9 |
|
Competitive landscape |
Leading Companies, Market Positioning of Companies, Competitive Strategies, and Industry Risks |
|
Key companies profiled |
3M Co., AECI Ltd., Akzo Nobel NV, ArrMaz Products Inc., BASF SE, Clariant International Ltd, CP Kelco US Inc., Ecolab Inc., Exxon Mobil Corp., FMC Corp., General Electric Co., Huntsman Corp., Orica Ltd., Sasol Ltd., SNF Group, Solvay SA, Tennant Chemicals Co. ltd., The Chemours Co., and Zinkan Enterprises Inc. |
|
Market dynamics |
Parent market analysis, Market growth inducers and obstacles, market trends, Fast-growing and slow-growing segment analysis, COVID-19 impact and recovery analysis and future consumer dynamics, Market condition analysis for market forecast period |
|
Customization purview |
If our market report has not included the data that you are looking for, you can reach out to our analysts and get segments customized. |
What are the Key Data Covered in this Market Research Report?
- CAGR of the market during the forecast period
- Detailed information on factors that will drive the market growth and forecasting between 2024 and 2028
- Precise estimation of the size of the market and its contribution of the market in focus to the parent market
- Accurate predictions about upcoming market growth and trends and changes in consumer behaviour
- Growth of the market across North America
- Thorough analysis of the market's competitive landscape and detailed information about companies
- Comprehensive analysis of factors that will challenge the growth of market companies
We can help! Our analysts can customize this market research report to meet your requirements. Get in touch
 RIA -
RIA - 
