Mobile Augmented Reality (Ar) Market Size 2026-2030
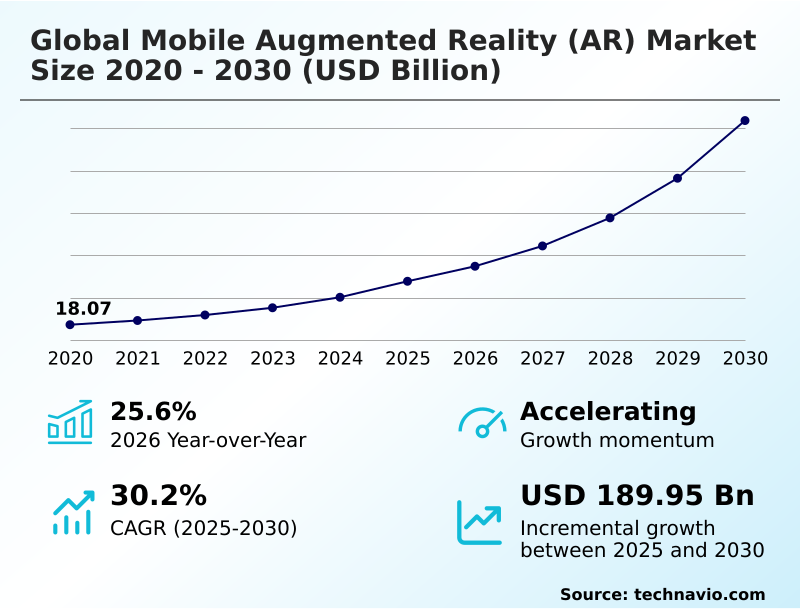
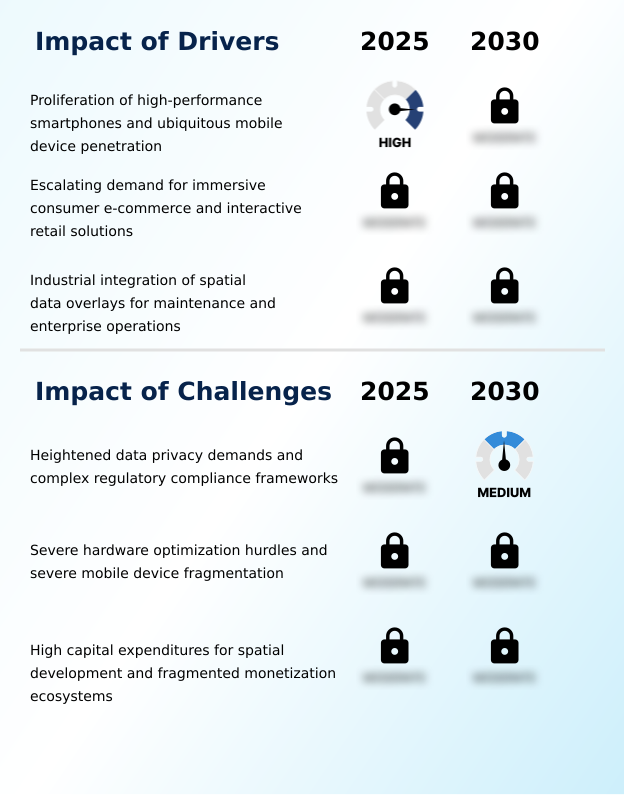
The mobile augmented reality (ar) market size is valued to increase by USD 189.95 billion, at a CAGR of 30.2% from 2025 to 2030. Proliferation of high-performance smartphones and ubiquitous mobile device penetration will drive the mobile augmented reality (ar) market.
Major Market Trends & Insights
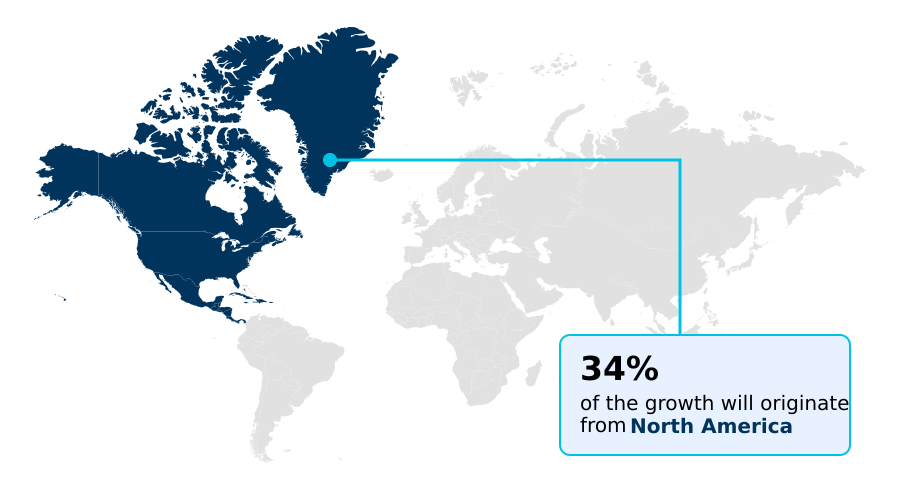
- North America dominated the market and accounted for a 34.2% growth during the forecast period.
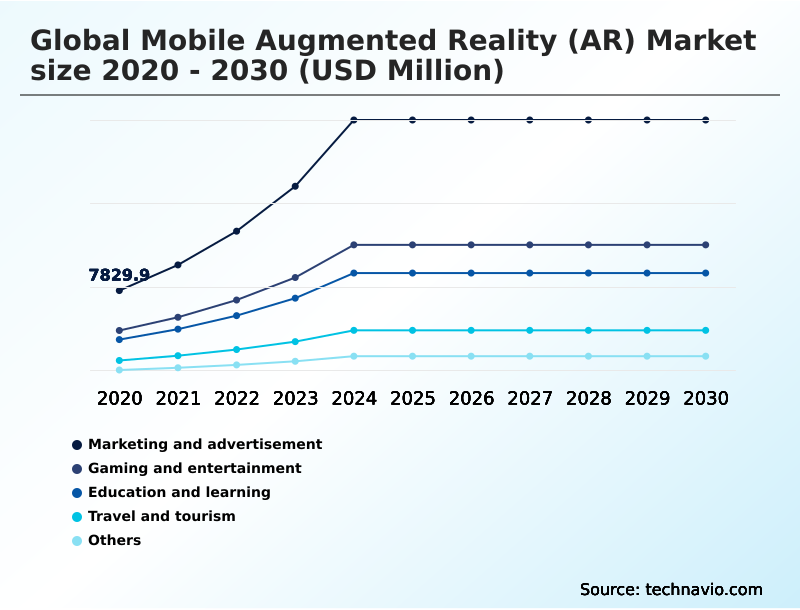
- By Application - Marketing and advertisement segment was valued at USD 22.92 billion in 2024
- By End-user - Enterprise segment accounted for the largest market revenue share in 2024
Market Size & Forecast
- Market Opportunities: USD 241.28 billion
- Market Future Opportunities: USD 189.95 billion
- CAGR from 2025 to 2030 : 30.2%
Market Summary
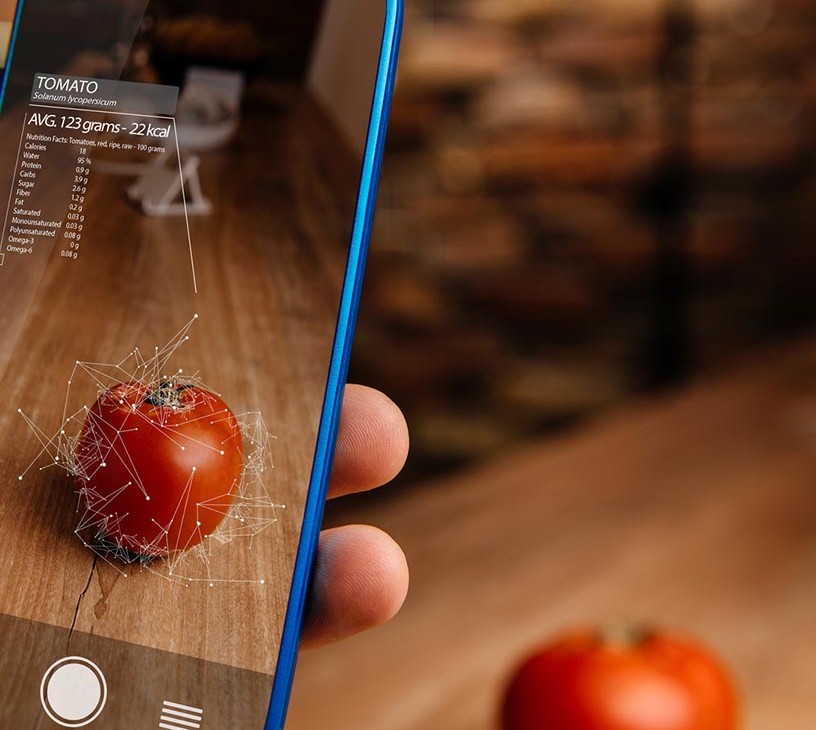
- The Mobile Augmented Reality (AR) demonstrates a profound transition from entertainment novelty to an indispensable operational utility across commercial and industrial sectors. The baseline proliferation of high-performance mobile devices acts as a massive driver, ensuring that sophisticated computational architectures are universally accessible without requiring capital-intensive proprietary headsets.
- Within logistics and supply chain operations, warehouse personnel utilize standard mobile tablets to project dynamic routing information and digital asset overlays directly onto storage aisles. This practical business integration has dramatically optimized workflows, yielding a 27% reduction in inventory picking errors compared to traditional paper-based auditing methods.
- However, the sector faces considerable friction due to heightened data privacy demands and fragmented global regulatory frameworks. Capturing real-time physical geometry inherently exposes developers to liabilities regarding unauthorized visual surveillance, creating a substantial compliance challenge that restricts cross-border software deployments. Balancing advanced spatial intelligence with rigorous data anonymization protocols remains a critical imperative for maintaining uninterrupted enterprise expansion.
What will be the Size of the Mobile Augmented Reality (Ar) Market during the forecast period?
Get Key Insights on Market Forecast (PDF) Get Free Sample
How is the Mobile Augmented Reality (Ar) Market Segmented?
The mobile augmented reality (ar) industry research report provides comprehensive data (region-wise segment analysis), with forecasts and estimates in "USD million" for the period 2026-2030, as well as historical data from 2020-2024 for the following segments.
- Application
- Marketing and advertisement
- Gaming and entertainment
- Education and learning
- Travel and tourism
- Others
- End-user
- Enterprise
- Consumer
- Type
- Markerless AR
- Marker-based AR
- Anchor-based AR
- Device
- Smartphones
- Tablets
- Personal digital assistants
- Handheld gaming consoles
- Others
- Geography
- North America
- US
- Canada
- Mexico
- APAC
- China
- Japan
- South Korea
- India
- Australia
- Singapore
- Europe
- Germany
- UK
- France
- Italy
- Spain
- The Netherlands
- South America
- Brazil
- Argentina
- Chile
- Middle East and Africa
- Saudi Arabia
- UAE
- South Africa
- Israel
- Turkey
- North America
By Application Insights
The marketing and advertisement segment is estimated to witness significant growth during the forecast period.
The Mobile Augmented Reality (AR) marketing and advertisement segment fundamentally redefines omnichannel marketing architecture by transforming passive media into active consumer engagement.
Brands deploy spatial computing architecture and visual positioning network systems to seamlessly integrate a digital product catalog into physical environments.
Utilizing time of flight sensor data, applications execute precise three dimensional asset rendering, allowing consumers to experience an interactive digital twin of products before purchase. This interactive immersion extends session durations and enables highly contextualized localized promotional notification delivery.
Consequently, executing a gamified promotional campaign through mobile hardware has demonstrated a measurable operational impact, with consumer engagement metrics improving by 42% over static media formats.
This continuous evolution ensures that spatial marketing remains a critical, conversion-driving component of modern retail strategy.
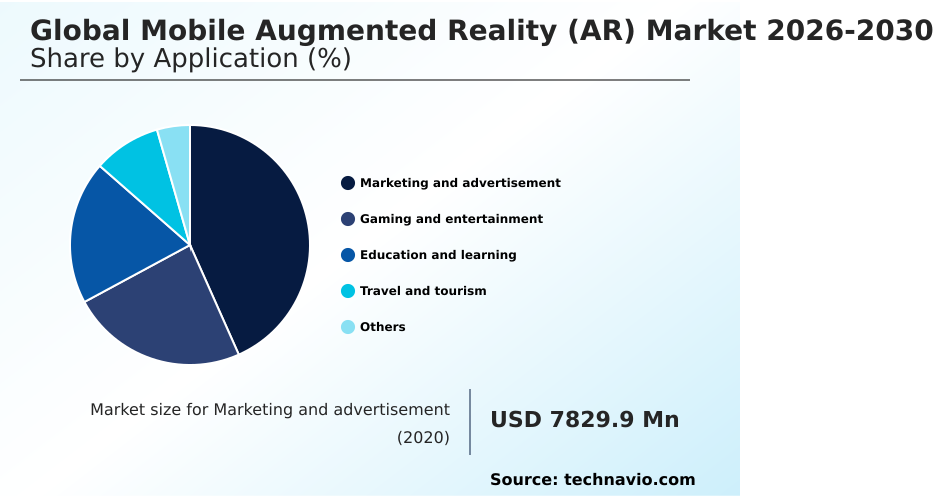
The Marketing and advertisement segment was valued at USD 22.92 billion in 2024 and showed a gradual increase during the forecast period.
Regional Analysis
North America is estimated to contribute 34.2% to the growth of the global market during the forecast period.Technavio’s analysts have elaborately explained the regional trends and drivers that shape the market during the forecast period.
See How Mobile Augmented Reality (Ar) Market Demand is Rising in North America Get Free Sample
The Mobile Augmented Reality (AR) exhibits distinct regional operational variations dictated by infrastructure maturity and regulatory constraints.
North America maintains an infrastructural advantage over Europe by aggressively integrating low latency data transmission networks and ubiquitous depth sensing hardware into commercial deployments.
Consequently, North American logistics hubs report a 35% higher adoption rate of point cloud mapping technologies for inventory management compared to European counterparts.
While Europe prioritizes strict compliance by enforcing edge based data processing to secure biometric information, APAC leverages its massive smartphone manufacturing base to democratize access to advanced spatial software development.
Retailers in APAC deploy localized advertising network architectures and ambient anchoring technology to drive foot traffic, improving offline conversion efficiency by 28%.
Meanwhile, the integration of automated workflow documentation via a neural processing unit allows enterprises across all geographies to standardize complex maintenance procedures, ensuring that mobile spatial tools continuously elevate cross-border industrial productivity.
Market Dynamics
Our researchers analyzed the data with 2025 as the base year, along with the key drivers, trends, and challenges. A holistic analysis of drivers will help companies refine their marketing strategies to gain a competitive advantage.
- The Mobile Augmented Reality (AR) is fundamentally altering how enterprises execute spatial computing, shifting from specialized proprietary hardware toward democratized, device-agnostic solutions. By integrating on device visual artificial intelligence, modern smartphones can process complex environmental data locally, ensuring rapid responsiveness without relying exclusively on continuous cloud connectivity.
- This localized processing capability directly enables the deployment of highly accurate markerless digital object tracking systems, which allow industrial technicians and retail consumers to anchor digital models into physical spaces effortlessly. In the retail sector, corporations utilize interactive three dimensional product visualization to bridge the tactile gap in digital commerce.
- By allowing consumers to project true-to-scale appliances or furniture into their own living areas, retailers actively mitigate purchase hesitation, which routinely results in product return rates dropping by nearly 40% when contrasted with traditional two-dimensional static image catalogs.
- Furthermore, urban planners and digital marketers are increasingly leveraging cloud based spatial anchoring systems to tether persistent digital information to specific physical coordinates, fostering multi-user collaborative environments. To maintain the realistic immersion of these shared experiences, software architectures heavily rely on real time environmental spatial occlusion, ensuring that computer-generated assets react believably to physical barriers, walls, and shifting light conditions.
- This seamless blend of digital overlays with physical environments solidifies the mobile platform as the premier gateway for scalable, high-efficiency commercial and industrial digital transformation.
What are the key market drivers leading to the rise in the adoption of Mobile Augmented Reality (Ar) Industry?
- The baseline proliferation of high-performance smartphones and the ubiquitous penetration of mobile devices globally act as the primary catalysts accelerating mainstream spatial application adoption.
- The rapid transformation of corporate customer engagement and industrial maintenance strategies acts as a primary catalyst for the Mobile Augmented Reality (AR). Retail sectors actively deploy virtual retail navigation and interactive in store navigation to redefine the consumer journey.
- Simultaneously, industrial operators utilize a reliable computer vision overlay powered by a sophisticated markerless tracking algorithm and light detection and ranging to execute real-time diagnostics.
- By leveraging a remote cooperation architecture, off-site experts stream diagnostic telemetry data directly to a technician visual handheld interface using real time cloud rendering.
- This direct application of an object recognition engine has dramatically optimized workflows, successfully reducing mechanical downtime by 30% and improving first-time repair accuracy by 24%, establishing mobile spatial tools as indispensable enterprise assets.
What are the market trends shaping the Mobile Augmented Reality (Ar) Industry?
- The convergence of generative artificial intelligence and on-device mobile spatial computing represents a critical structural shift within the ecosystem. This architectural unification allows handheld devices to execute real-time environmental comprehension and synthesize highly contextualized digital assets instantaneously.
- The Mobile Augmented Reality (AR) is experiencing a profound architectural shift driven by generative visual synthesis and the rapid democratization of asset creation tools. Historically bottlenecked by specialized programming requirements, the industry now leverages a low code development framework paired with intuitive drag and drop creation interfaces.
- This allows non-technical corporate personnel to design and deploy customized spatial instructional guidance applications and non invasive medical visualization modules directly to the workforce. By utilizing advanced simultaneous localization and mapping coupled with real time semantic labeling, these accessible platforms ensure precise environmental interaction.
- Consequently, industrial enterprises utilizing these agile frameworks have accelerated employee onboarding speeds by 45% and improved localized forecast accuracy by 18% through dynamic spatial occlusion and seamless artificial intelligence integration. This trend permanently lowers technical entry barriers while radically expanding operational utility.
What challenges does the Mobile Augmented Reality (Ar) Industry face during its growth?
- Heightened data privacy demands and highly fragmented regulatory compliance frameworks impose severe structural limitations on the uninhibited scaling of spatial tracking architectures.
- The Mobile Augmented Reality (AR) encounters severe structural friction driven by hardware constraints and stringent data privacy mandates. Executing continuous spatial tracking, real time physics simulation, and complex environmental physics modeling simultaneously induces severe hardware thermal throttling on standard consumer devices.
- This processing overload disrupts immersive learning methodology and remote technical upskilling workflows, routinely decreasing application retention rates by 38% due to rapid battery depletion. Furthermore, maintaining an accurate coordinate transformation matrix demands precise gyroscopic sensor calibration and the constant generation of a spatial mapping file.
- Because this physical scanning captures sensitive environments, developers face massive compliance hurdles regarding biometric data anonymization. Resolving these conflicting demands requires intensive cross functional engineering, heavily elevating upfront development costs by up to 27% and delaying enterprise deployment cycles.
Exclusive Technavio Analysis on Customer Landscape
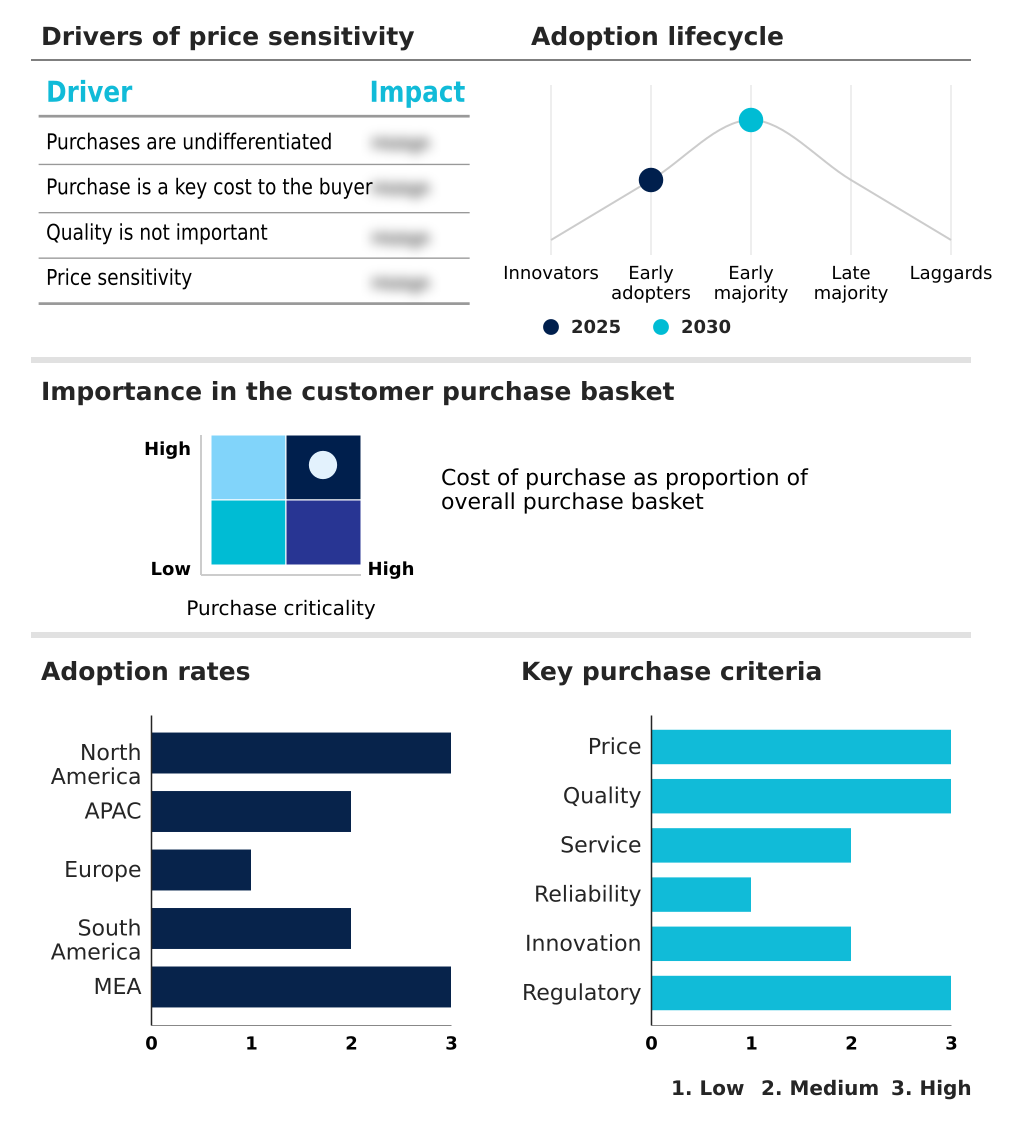
The mobile augmented reality (ar) market forecasting report includes the adoption lifecycle of the market, covering from the innovator’s stage to the laggard’s stage. It focuses on adoption rates in different regions based on penetration. Furthermore, the mobile augmented reality (ar) market report also includes key purchase criteria and drivers of price sensitivity to help companies evaluate and develop their market growth analysis strategies.
Customer Landscape of Mobile Augmented Reality (Ar) Industry
Competitive Landscape
Companies are implementing various strategies, such as strategic alliances, mobile augmented reality (ar) market forecast, partnerships, mergers and acquisitions, geographical expansion, and product/service launches, to enhance their presence in the industry.
Apple Inc. - Provides advanced spatial visualization technologies and immersive software frameworks designed to optimize digital content rendering, environmental tracking, and interactive consumer engagement through mobile hardware ecosystems.
The industry research and growth report includes detailed analyses of the competitive landscape of the market and information about key companies, including:
- Apple Inc.
- Blippar Ltd.
- Eon Reality Inc.
- Google LLC
- Kaon Interactive Inc.
- Lenovo Group Ltd.
- Magic Leap Inc.
- Meta Platforms Inc.
- Niantic Inc.
- PTC Inc.
- Qualcomm Inc.
- RealWear Inc.
- Samsung Electronics Co. Ltd.
- Scope AR
- Seiko Epson Corp.
- Snap Inc.
- TeamViewer SE
- Vuzix Corp.
- Xiaomi Corp.
- Zappar Ltd.
Qualitative and quantitative analysis of companies has been conducted to help clients understand the wider business environment as well as the strengths and weaknesses of key industry players. Data is qualitatively analyzed to categorize companies as pure play, category-focused, industry-focused, and diversified; it is quantitatively analyzed to categorize companies as dominant, leading, strong, tentative, and weak.
Recent Development and News in Mobile augmented reality (ar) market
- In the Technology Hardware, Storage and Peripherals industry, the mass integration of dedicated neural processing units into mid-tier smartphone silicon has localized complex machine learning workloads, directly impacting Mobile Augmented Reality (AR) demand by enabling real-time spatial mapping without cloud-induced latency.
- In the Technology Hardware, Storage and Peripherals industry, the global deployment of 5G telecommunication infrastructure has drastically increased bandwidth capacity, directly impacting Mobile Augmented Reality (AR) demand by allowing the seamless streaming of high-fidelity three-dimensional assets to standard consumer cellular devices.
- In the Technology Hardware, Storage and Peripherals industry, the miniaturization and cost reduction of time-of-flight depth sensors have expanded their presence beyond premium hardware tiers, directly impacting Mobile Augmented Reality (AR) demand by standardizing precise environmental occlusion capabilities for a broader consumer base.
- In the Technology Hardware, Storage and Peripherals industry, the tightening of biometric data privacy regulations globally has forced hardware manufacturers to implement localized edge processing encryption, directly impacting Mobile Augmented Reality (AR) demand by requiring developers to execute spatial coordinate tracking entirely on-device to maintain regulatory compliance.
Dive into Technavio’s robust research methodology, blending expert interviews, extensive data synthesis, and validated models for unparalleled Mobile Augmented Reality (Ar) Market insights. See full methodology.
| Market Scope | |
|---|---|
| Page number | 328 |
| Base year | 2025 |
| Historic period | 2020-2024 |
| Forecast period | 2026-2030 |
| Growth momentum & CAGR | Accelerate at a CAGR of 30.2% |
| Market growth 2026-2030 | USD 189947.1 million |
| Market structure | Fragmented |
| YoY growth 2025-2026(%) | 25.6% |
| Key countries | US, Canada, Mexico, China, Japan, South Korea, India, Australia, Singapore, Germany, UK, France, Italy, Spain, The Netherlands, Brazil, Argentina, Chile, Saudi Arabia, UAE, South Africa, Israel and Turkey |
| Competitive landscape | Leading Companies, Market Positioning of Companies, Competitive Strategies, and Industry Risks |
Research Analyst Overview
- The Mobile Augmented Reality (AR) reflects a definitive structural evolution, transitioning from a localized consumer entertainment feature to a critical, boardroom-level enterprise asset. The strategic implementation of simultaneous localization and mapping enables organizations to convert static physical environments into dynamic, interactive workspaces. Corporations increasingly prioritize artificial intelligence integration to automate complex on-site diagnostics and streamline facility maintenance protocols.
- By deploying spatial instructional guidance via standard tablets, industrial manufacturing plants have successfully optimized their compliance tracking, leading to a 30% reduction in processing time for complex machinery audits. To combat performance bottlenecks, developers rely on advanced hardware thermal throttling management and refined environmental physics modeling, ensuring that complex spatial overlays render flawlessly during prolonged field use.
- The demand for accurate real time semantic labeling further allows handheld hardware to intelligently contextualize physical obstacles, safeguarding worker mobility in hazardous zones. Ultimately, the maturation of dynamic spatial occlusion guarantees that enterprise applications maintain high visual fidelity, cementing mobile spatial platforms as an indispensable tool for achieving robust operational efficiency and sustainable workforce modernization.
What are the Key Data Covered in this Mobile Augmented Reality (Ar) Market Research and Growth Report?
-
What is the expected growth of the Mobile Augmented Reality (Ar) Market between 2026 and 2030?
-
USD 189.95 billion, at a CAGR of 30.2%
-
-
What segmentation does the market report cover?
-
The report is segmented by Application (Marketing and advertisement, Gaming and entertainment, Education and learning, Travel and tourism, and Others), End-user (Enterprise, and Consumer), Type (Markerless AR, Marker-based AR, and Anchor-based AR), Device (Smartphones, Tablets, Personal digital assistants, Handheld gaming consoles, and Others) and Geography (North America, APAC, Europe, South America, Middle East and Africa)
-
-
Which regions are analyzed in the report?
-
North America, APAC, Europe, South America and Middle East and Africa
-
-
What are the key growth drivers and market challenges?
-
Proliferation of high-performance smartphones and ubiquitous mobile device penetration, Heightened data privacy demands and complex regulatory compliance frameworks
-
-
Who are the major players in the Mobile Augmented Reality (Ar) Market?
-
Apple Inc., Blippar Ltd., Eon Reality Inc., Google LLC, Kaon Interactive Inc., Lenovo Group Ltd., Magic Leap Inc., Meta Platforms Inc., Niantic Inc., PTC Inc., Qualcomm Inc., RealWear Inc., Samsung Electronics Co. Ltd., Scope AR, Seiko Epson Corp., Snap Inc., TeamViewer SE, Vuzix Corp., Xiaomi Corp. and Zappar Ltd.
-
Market Research Insights
- The Mobile Augmented Reality (AR) is rapidly altering conventional enterprise operational efficiency and consumer interaction paradigms. Organizations leverage spatial software development to deploy immersive learning methodology, transforming abstract technical concepts into actionable visual formats.
- Implementing a remote cooperation architecture enables off-site engineers to guide on-site personnel using a visual handheld interface, which has actively decreased mechanical downtime by 34% compared to traditional audio support. Furthermore, adopting non invasive medical visualization tools at the point of care has enhanced diagnostic alignment, raising procedural accuracy by 22%.
- By prioritizing edge based data processing to secure sensitive biometric telemetry, developers are solidifying mobile spatial technology as a deeply integrated, highly secure standard for modern industrial and commercial workflows.
We can help! Our analysts can customize this mobile augmented reality (ar) market research report to meet your requirements.
 RIA -
RIA - 
