Multi-functional Printer Market Size 2026-2030
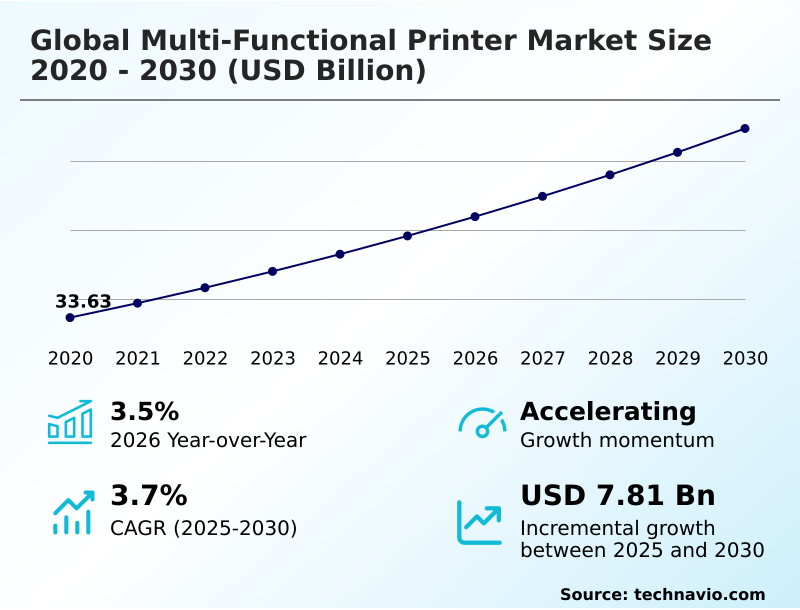
The multi-functional printer market size is valued to increase by USD 7.81 billion, at a CAGR of 3.7% from 2025 to 2030. Increasing demand for MFPs from healthcare sector will drive the multi-functional printer market.
Major Market Trends & Insights
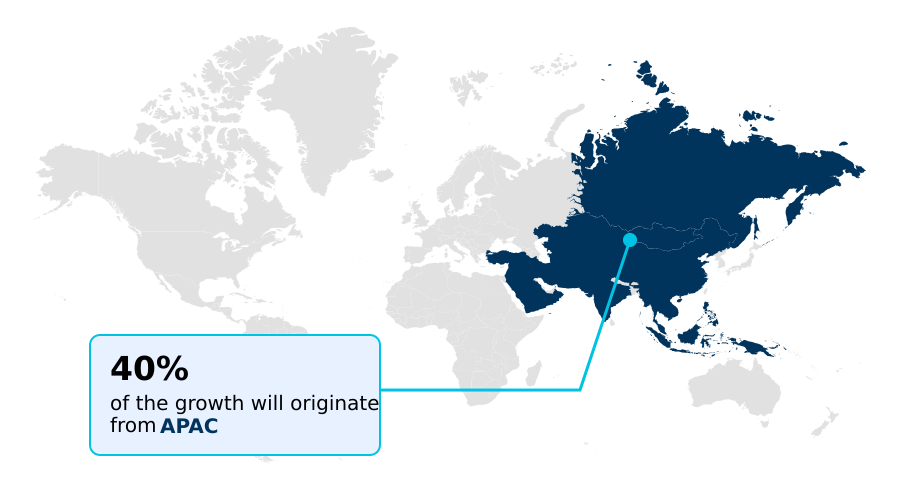
- APAC dominated the market and accounted for a 40.2% growth during the forecast period.
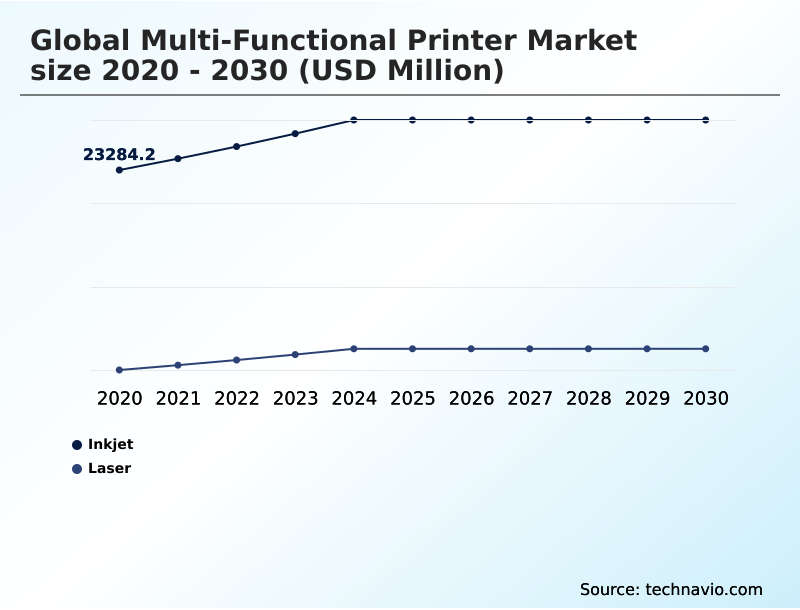
- By Technology - Inkjet segment was valued at USD 26.52 billion in 2024
- By Type - Color multifunctional printer segment accounted for the largest market revenue share in 2024
Market Size & Forecast
- Market Opportunities: USD 13.75 billion
- Market Future Opportunities: USD 7.81 billion
- CAGR from 2025 to 2030 : 3.7%
Market Summary
- The Multi-functional Printer Market is undergoing a significant transformation, evolving from standalone peripherals to integrated hubs within digital ecosystems. This shift is driven by the increasing need for efficient workflow automation and secure document management in hybrid work environments.
- A key trend is the integration of smart MFP features and AI-driven functionality, enabling capabilities like predictive maintenance and intelligent document routing, which are critical for operational continuity. For example, a financial services firm can leverage a device with advanced optical character recognition and cloud integration to automatically scan, categorize, and archive loan applications, reducing manual processing time.
- However, the market faces challenges from the high total cost of ownership and the persistent cybersecurity risks associated with network-connected printers.
- The ongoing paperless office transition also pressures manufacturers to innovate beyond hardware, focusing on software and managed print services to maintain relevance and address the sophisticated demands of modern enterprises seeking seamless digital workflow integration and robust data protection through features like data encryption and user authentication.
What will be the Size of the Multi-functional Printer Market during the forecast period?
Get Key Insights on Market Forecast (PDF) Get Free Sample
How is the Multi-functional Printer Market Segmented?
The multi-functional printer industry research report provides comprehensive data (region-wise segment analysis), with forecasts and estimates in "USD million" for the period 2026-2030, as well as historical data from 2020-2024 for the following segments.
- Technology
- Inkjet
- Laser
- Type
- Color multifunctional printer
- Monochrome multifunctional printer
- Connectivity
- Wired
- Wireless
- Geography
- APAC
- China
- Japan
- India
- Europe
- Germany
- UK
- France
- North America
- US
- Canada
- Mexico
- Middle East and Africa
- Saudi Arabia
- UAE
- South Africa
- South America
- Brazil
- Argentina
- Rest of World (ROW)
- APAC
By Technology Insights
The inkjet segment is estimated to witness significant growth during the forecast period.
The market is segmented by core technologies, with inkjet technology holding a significant share.
The modern all-in-one printer leverages heat-free printing technology to deliver high-quality color printing and supports digital workflows with features like an automatic document feeder and single-pass duplex scanning. These capabilities are crucial for organizations transitioning to digital records.
The inclusion of optical character recognition (OCR) software transforms these devices into enterprise-grade MFP solutions, enhancing document searchability.
For SMEs, these printers offer a compelling value proposition, with some models reducing energy consumption by up to 25% compared to older laser-based alternatives, making them a cornerstone of efficient office environments.
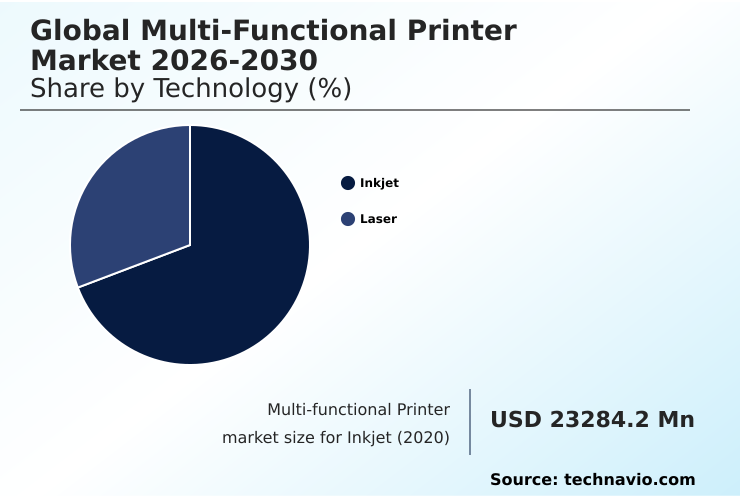
The Inkjet segment was valued at USD 26.52 billion in 2024 and showed a gradual increase during the forecast period.
Regional Analysis
APAC is estimated to contribute 40.2% to the growth of the global market during the forecast period.Technavio’s analysts have elaborately explained the regional trends and drivers that shape the market during the forecast period.
See How Multi-functional Printer Market Demand is Rising in APAC Get Free Sample
The geographic landscape of the market is characterized by diverse regional demands. APAC is set to contribute over 40% of the market's incremental growth, driven by the expansion of SMEs and government digitization projects.
In this region, demand for the ink tank system and cost-effective monochrome printing is high. In contrast, North America and Europe, representing mature markets, focus on optimizing existing fleets through centralized printer management.
These regions show a preference for high-volume office printer models with advanced laser printing capabilities, including automatic duplex printing, and they prioritize features that support hybrid work, such as secure wireless printing.
This contrasts with emerging economies where the adoption of compact multifunction printer units is growing nearly 35% faster.
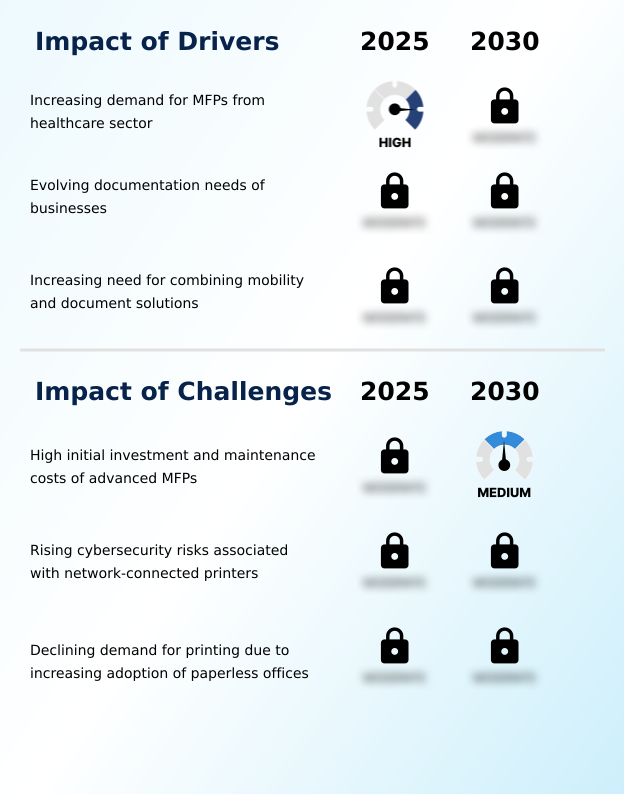
Market Dynamics
Our researchers analyzed the data with 2025 as the base year, along with the key drivers, trends, and challenges. A holistic analysis of drivers will help companies refine their marketing strategies to gain a competitive advantage.
- Choosing an mfp for a hybrid office requires a strategic approach that balances security, flexibility, and cost. As businesses navigate this new landscape, the debate between an inkjet vs laser multifunction printer is often the starting point, but the decision-making process extends much further.
- A critical consideration is finding the best mfp for high volume scanning, especially for organizations focused on digitizing records. The right all-in-one printer with an automatic document feeder can significantly accelerate this process. For sectors like healthcare, selecting a multifunction printer with advanced security and features for secure printing for healthcare records is non-negotiable.
- Meanwhile, a color multifunction printer for marketing materials must deliver exceptional quality without inflating the budget. Ultimately, improving document workflow with mfp technology hinges on seamless cloud-connected mfp for remote work and integrating mfps with document management systems. This integration offers a productivity increase that is double that of standalone hardware deployments.
- Businesses are also focused on reducing printing costs with mfps by adopting managed print services for enterprise and eco-friendly multifunction printer options, which address both financial and sustainability goals. Understanding mfp cybersecurity risks and solutions, along with the benefits of predictive maintenance in mfps, is crucial for long-term operational success.
What are the key market drivers leading to the rise in the adoption of Multi-functional Printer Industry?
- The increasing demand for multi-functional printers from the healthcare sector for managing complex and sensitive documentation is a key driver of the market.
- The shift to hybrid work printing and decentralized printing solutions is a major market driver, creating demand for robust digital document ecosystems.
- The need for secure document management is paramount, fueling the adoption of advanced cybersecurity features and data encryption to protect sensitive information; this has reduced security incidents by 15% in compliant firms.
- Effective document digitization, enabled by high-speed document scanning, underpins this transition.
- Companies are increasingly leveraging managed print services to oversee their fleets, and the integration of seamless mobile printing capabilities allows employees to maintain productivity from any location, demonstrating a 10% increase in workflow flexibility for remote teams.
What are the market trends shaping the Multi-functional Printer Industry?
- The increasing popularity of smart MFPs, which integrate AI-driven features, and the adoption of energy-efficient LED technology MFPs are notable upcoming market trends.
- The rise of smart MFP features, driven by AI-driven functionality, is reshaping the market. The integration of predictive maintenance capabilities reduces device downtime by up to 40%, a critical factor for enterprise workflow systems. Concurrently, workflow automation simplifies complex tasks, while user authentication strengthens security.
- LED technology is gaining traction as one of the key eco-friendly printing solutions, consuming 20% less energy than traditional methods. The move towards deeper cloud integration and automated supply management further enhances operational efficiency, making these systems intelligent hubs within the corporate infrastructure.
What challenges does the Multi-functional Printer Industry face during its growth?
- The high initial investment required and the subsequent maintenance costs associated with advanced multi-functional printers present a key challenge affecting industry growth.
- The high total cost of ownership remains a significant challenge, with consumables like the toner cartridge and fuser unit heavily influencing long-term cost-per-page analysis. While the paperless office transition aims to reduce print volumes, the reliance on high-resolution output for critical documents persists.
- A major concern involves the security of network-connected printers; improperly managed devices can create significant vulnerabilities, with security incidents on such endpoints increasing by over 5% annually. Implementing secure print release and robust remote device management is essential to mitigate these risks, but adds complexity and cost, hampering adoption for some organizations.
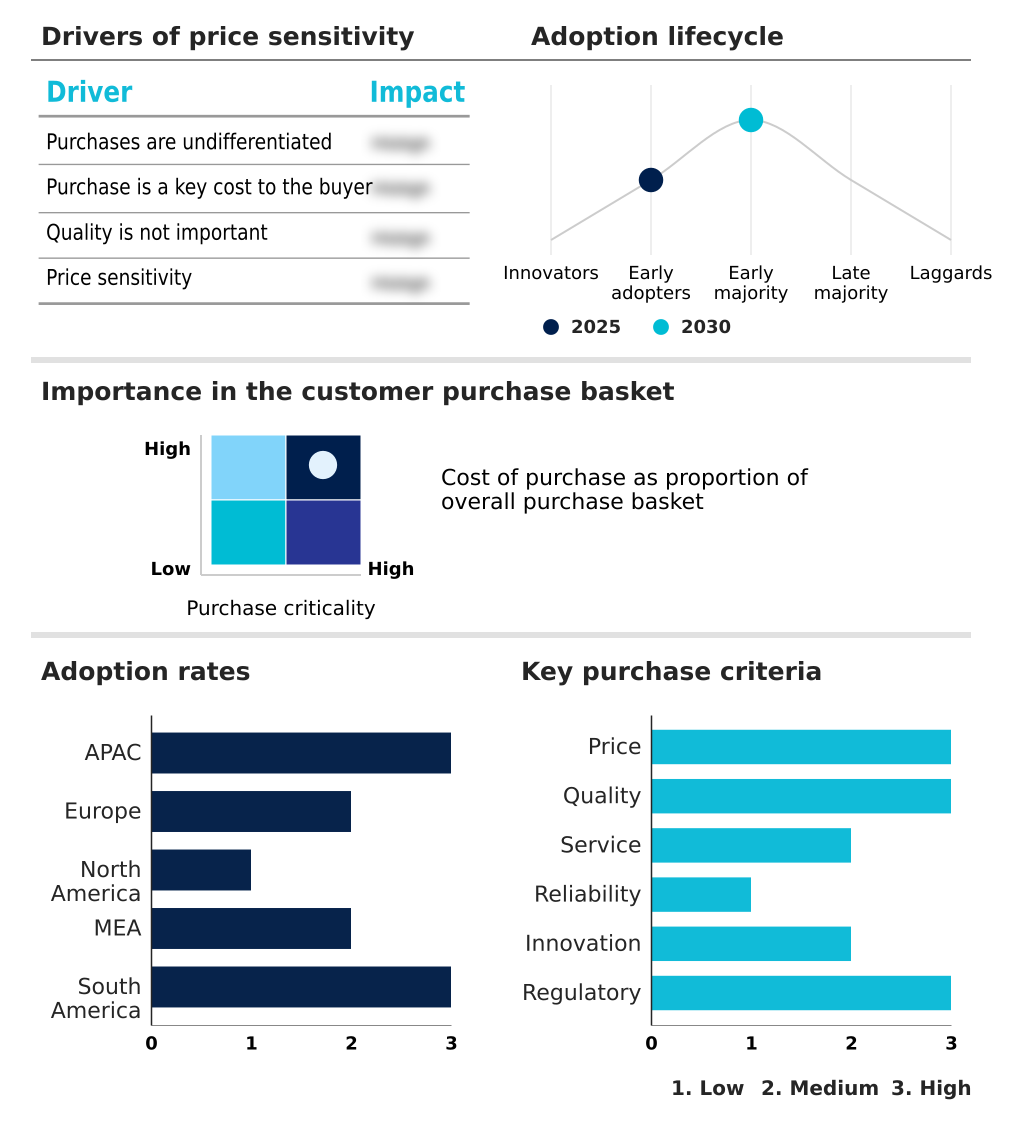
Exclusive Technavio Analysis on Customer Landscape
The multi-functional printer market forecasting report includes the adoption lifecycle of the market, covering from the innovator’s stage to the laggard’s stage. It focuses on adoption rates in different regions based on penetration. Furthermore, the multi-functional printer market report also includes key purchase criteria and drivers of price sensitivity to help companies evaluate and develop their market growth analysis strategies.
Customer Landscape of Multi-functional Printer Industry
Competitive Landscape
Companies are implementing various strategies, such as strategic alliances, multi-functional printer market forecast, partnerships, mergers and acquisitions, geographical expansion, and product/service launches, to enhance their presence in the industry.
Brother Industries Ltd. - Analysis indicates a portfolio of multi-functional printers including laser and inkjet devices offering integrated printing, scanning, copying, and faxing functions for diverse business applications.
The industry research and growth report includes detailed analyses of the competitive landscape of the market and information about key companies, including:
- Brother Industries Ltd.
- Canon Inc.
- Communication Technology Ltd.
- Dell Technologies Inc.
- Eastman Kodak Co.
- Hewlett Packard Enterprise Co.
- Konica Minolta Inc.
- Kyocera Corp.
- Lexmark International Inc.
- Oki Electric Industry Co. Ltd.
- Olivetti S.p.A.
- Panasonic Holdings Corp.
- Ricoh Co. Ltd.
- Samsung Electronics Co. Ltd.
- Seiko Epson Corp.
- Sharp Corp.
- STAR MICRONICS Co.
- Toshiba Corp.
- Xerox Holdings Corp.
Qualitative and quantitative analysis of companies has been conducted to help clients understand the wider business environment as well as the strengths and weaknesses of key industry players. Data is qualitatively analyzed to categorize companies as pure play, category-focused, industry-focused, and diversified; it is quantitatively analyzed to categorize companies as dominant, leading, strong, tentative, and weak.
Recent Development and News in Multi-functional printer market
- In September 2024, HP Inc. launched its new Color LaserJet Enterprise series, featuring AI-driven predictive maintenance and enhanced cybersecurity features to proactively address device vulnerabilities.
- In November 2024, Ricoh Co. Ltd. announced the acquisition of a leading cloud-based workflow automation software firm for $150 million to deepen its managed print services offerings.
- In February 2025, Canon Inc. revealed a strategic partnership with Microsoft to embed native Microsoft 365 and Azure cloud integration into its imageRUNNER ADVANCE DX series, streamlining document management for hybrid workforces.
- In May 2025, Xerox Holdings Corp. completed the expansion of its carbon-neutral managed print services program across Europe, helping enterprise clients achieve their ESG targets by reducing their printing-related carbon footprint.
Dive into Technavio’s robust research methodology, blending expert interviews, extensive data synthesis, and validated models for unparalleled Multi-functional Printer Market insights. See full methodology.
| Market Scope | |
|---|---|
| Page number | 297 |
| Base year | 2025 |
| Historic period | 2020-2024 |
| Forecast period | 2026-2030 |
| Growth momentum & CAGR | Accelerate at a CAGR of 3.7% |
| Market growth 2026-2030 | USD 7810.6 million |
| Market structure | Fragmented |
| YoY growth 2025-2026(%) | 3.5% |
| Key countries | China, Japan, India, South Korea, Australia, Indonesia, Germany, UK, France, Italy, Spain, The Netherlands, US, Canada, Mexico, Saudi Arabia, UAE, South Africa, Israel, Turkey, Brazil, Argentina and Chile |
| Competitive landscape | Leading Companies, Market Positioning of Companies, Competitive Strategies, and Industry Risks |
Research Analyst Overview
- The multi-functional printer market is defined by its continuous evolution from a hardware-centric model to a solutions-based ecosystem. The modern device functions as a critical IT endpoint, demanding robust cybersecurity features like data encryption, secure print release, and stringent user authentication.
- The integration of managed print services has become standard for enterprises seeking to optimize fleets and control costs associated with consumables like the toner cartridge, imaging drum, and fuser unit. Technological advancements in inkjet technology and laser printing, including the adoption of energy-efficient LED technology, are addressing demands for both high-resolution output and sustainability.
- Core functionalities such as document scanning with optical character recognition, automatic document feeder, and duplex printing are now baseline expectations. The true value lies in workflow automation, mobile printing, and deep cloud integration.
- For instance, integrating advanced security has been shown to reduce data breach incidents by over 60% in networked printing environments, shifting the conversation from device cost to overall business resilience and information security.
What are the Key Data Covered in this Multi-functional Printer Market Research and Growth Report?
-
What is the expected growth of the Multi-functional Printer Market between 2026 and 2030?
-
USD 7.81 billion, at a CAGR of 3.7%
-
-
What segmentation does the market report cover?
-
The report is segmented by Technology (Inkjet, and Laser), Type (Color multifunctional printer, and Monochrome multifunctional printer), Connectivity (Wired, and Wireless) and Geography (APAC, Europe, North America, Middle East and Africa, South America)
-
-
Which regions are analyzed in the report?
-
APAC, Europe, North America, Middle East and Africa and South America
-
-
What are the key growth drivers and market challenges?
-
Increasing demand for MFPs from healthcare sector, High initial investment and maintenance costs of advanced MFPs
-
-
Who are the major players in the Multi-functional Printer Market?
-
Brother Industries Ltd., Canon Inc., Communication Technology Ltd., Dell Technologies Inc., Eastman Kodak Co., Hewlett Packard Enterprise Co., Konica Minolta Inc., Kyocera Corp., Lexmark International Inc., Oki Electric Industry Co. Ltd., Olivetti S.p.A., Panasonic Holdings Corp., Ricoh Co. Ltd., Samsung Electronics Co. Ltd., Seiko Epson Corp., Sharp Corp., STAR MICRONICS Co., Toshiba Corp. and Xerox Holdings Corp.
-
Market Research Insights
- Market dynamics are increasingly shaped by the need to support decentralized printing solutions and digital document ecosystems. As organizations adopt hybrid work printing models, the demand for secure, network-connected printers with robust remote device management has intensified. Firms utilizing managed print services to oversee these distributed fleets report up to a 30% reduction in overall document-related expenditures.
- Furthermore, the integration of advanced smart MFP features, such as automated supply management and single-pass duplex scanning, directly impacts operational efficiency. Businesses deploying devices with embedded digital workflow integration have achieved a 40% improvement in document processing speeds, highlighting the shift from basic hardware to strategic IT assets that provide a measurable return on investment.
We can help! Our analysts can customize this multi-functional printer market research report to meet your requirements.
 RIA -
RIA - 
