Multimodal AI Development Platforms Market Analysis, Size, and Forecast 2026-2030: North America (US, Canada, and Mexico), APAC (China, India, and Japan), Europe (Germany, UK, and France), South America (Brazil, Argentina, and Colombia), Middle East and Africa (Saudi Arabia, UAE, and South Africa), and Rest of World (ROW)

Multimodal AI Development Platforms Market Analysis, Size, and Forecast 2026-2030:
North America (US, Canada, and Mexico), APAC (China, India, and Japan), Europe (Germany, UK, and France), South America (Brazil, Argentina, and Colombia), Middle East and Africa (Saudi Arabia, UAE, and South Africa), and Rest of World (ROW)

Published: May 2026 299 Pages SKU: IRTNTR81295

Market Overview at a Glance

$6.66 B
Market Opportunity
33.3%
CAGR 2025 - 2030
39.5%
North America Growth
$1.18 B
Solutions segment 2024

Multimodal Ai Development Platforms Market Size and Growth Forecast 2026-2030

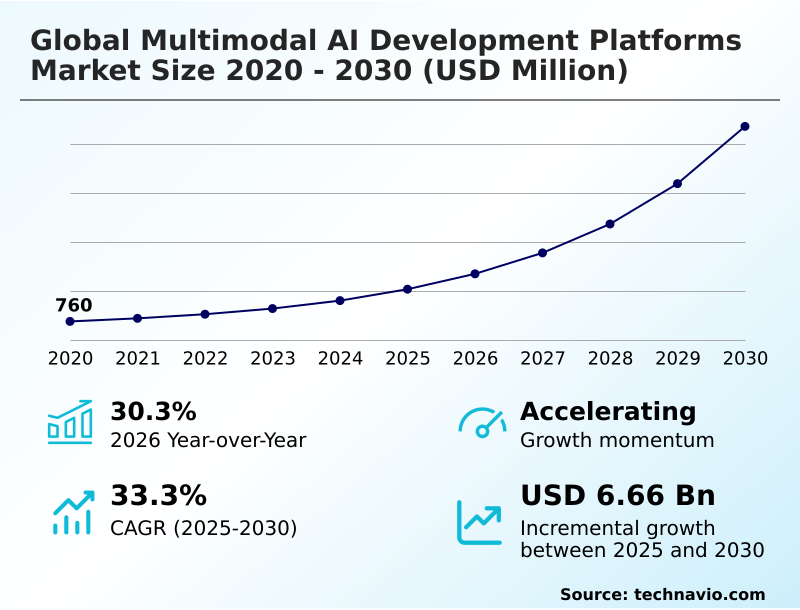
The Multimodal Ai Development Platforms Market size was valued at USD 2.08 billion in 2025 growing at a CAGR of 33.3% during the forecast period 2026-2030.

North America accounts for 39.5% of incremental growth during the forecast period. The Solutions segment by Component was valued at USD 1.18 billion in 2024, while the IT and telecommunication segment holds the largest revenue share by End-user.

The market is projected to grow by USD 7.98 billion from 2020 to 2030, with USD 6.66 billion of the growth expected during the forecast period of 2025 to 2030.

Get Key Insights on Market Forecast (PDF) Request Free Sample

Multimodal Ai Development Platforms Market Overview

The multimodal AI development platforms market is defined by the enterprise necessity for sophisticated data synthesis, where North America is projected to account for 39.5% of incremental growth. Organizations are moving beyond single-data-stream analysis to integrated systems that leverage cross-modal attention mechanisms for a deeper contextual understanding. A tangible application is seen in advanced manufacturing facilities, where quality control processes fuse high-resolution camera feeds with acoustic sensor data from production lines. In such a scenario, a vision-language model can detect micro-fractures in a component while simultaneously correlating the defect to a specific auditory anomaly from a malfunctioning machine, reducing false positives and enabling predictive maintenance. This level of multimodal machine learning, which combines visual and auditory inputs, is critical. The market's trajectory is influenced by the availability of large multimodal models and the ongoing development of specialized hardware like neural processing units, which are essential for handling the computational demands of these complex architectures.

Drivers, Trends, and Challenges in the Multimodal Ai Development Platforms Market

The global multimodal AI development platforms market is driven by the strategic need to process and understand interconnected, multi-format data. The total cost of ownership for multimodal AI platforms remains a significant consideration for procurement decision-makers, as it encompasses not just licensing but also the extensive computational resources needed for model training and inference.

For instance, an automotive OEM implementing a platform to enhance in-cabin driver-assistance systems must account for the high cost of specialized hardware for real-time sensor fusion. Decisions on multimodal AI platform adoption for industrial automation often hinge on whether the technology can deliver a quantifiable reduction in operational downtime, which can be 30% more effective than unimodal predictive maintenance systems.

Compliance with frameworks like the EU AI Act further complicates deployment, requiring features for MLOps for multimodal AI models to ensure transparency and mitigate algorithmic bias.

The choice between open-source multimodal AI models and proprietary enterprise AI platforms is another critical factor, with the former offering flexibility and the latter providing integrated support and security, impacting the overall AI development lifecycle management.

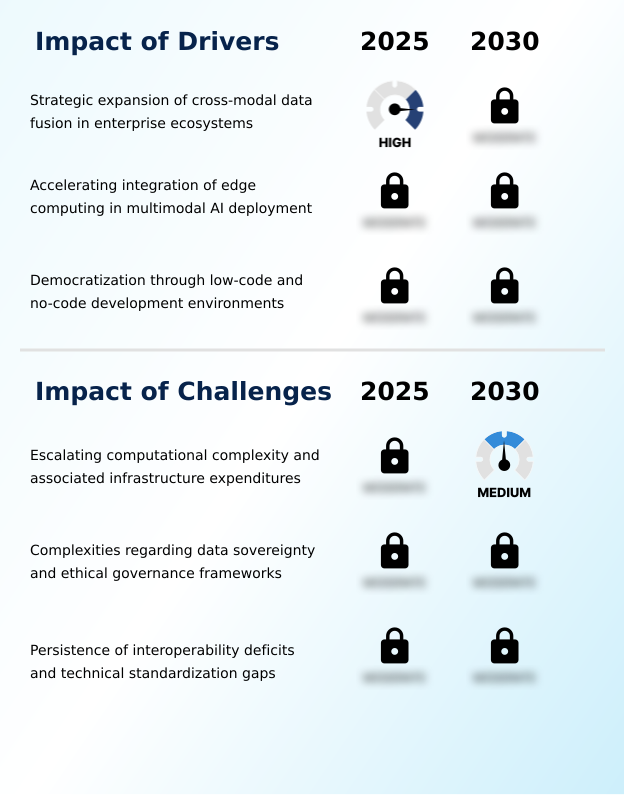
Primary Growth Driver: The strategic expansion of cross-modal data fusion within enterprise ecosystems is the key driver for the market, enabling a more holistic understanding of complex, unstructured data.

The market's expansion is fundamentally driven by the enterprise need for cross-modal data fusion, which allows organizations to derive deeper insights from unstructured data assets.

The second major driver is the integration of edge computing into deployment strategies, as the proliferation of IoT devices necessitates real-time processing to avoid latency issues found in centralized cloud architectures.

This is particularly relevant in industrial automation, where processing diverse signals at the source enables predictive maintenance. The third driver is the democratization of AI development through low-code and no-code functionalities.

These platforms empower non-specialists to build, train, and deploy multimodal models, accelerating innovation and addressing the global shortage of specialized data scientists, which is critical for scaling AI solutions.

Emerging Market Trend: The institutional adoption of federated multimodal learning frameworks is a significant market trend. This is driven by the need to train on sensitive, decentralized data while complying with stringent privacy regulations.

A primary trend is the shift toward domain-specific foundation models, as general-purpose systems struggle with the nuanced terminology of sectors like legal services and heavy manufacturing. These specialized platforms offer pre-trained weights and architectural templates tailored to niche data structures, such as fusing text-based electronic health records with 3D diagnostic imagery.

This specialization improves the accuracy of insights and is a key focus for MLOps for multimodal AI models. Another development is the expansion of specialized evaluation and observability benchmarks.

The industry is moving toward nuanced observability tools that can assess how well a model grounds its textual outputs in visual or auditory evidence, which is vital for building trust in high-stakes applications and mitigating model hallucinations.

Key Industry Challenge: Escalating computational complexity and the associated infrastructure expenditures present a key challenge, limiting market accessibility and impacting the total cost of ownership for multimodal AI systems.

A primary challenge is the immense computational complexity and associated infrastructure costs required to train and maintain multimodal systems, which often excludes smaller organizations. These high expenditures contribute to a significant total cost of ownership for multimodal AI platforms. The second challenge involves navigating the intricate landscape of data sovereignty and ethical governance.

Multimodal systems require access to sensitive information, raising privacy concerns and creating compliance hurdles with regulations such as GDPR. The potential for amplified algorithmic bias in multimodal systems adds another layer of complexity.

Finally, the market is hindered by a lack of technical standardization and persistent interoperability gaps between proprietary tools, which creates friction in the development process and vendor lock-in, complicating AI development lifecycle management.

Explore Full Market Dynamics Analysis Request Free Sample

Multimodal Ai Development Platforms Market Segmentation

The multimodal ai development platforms industry research report provides comprehensive data including region-wise segment analysis, with forecasts and analysis for the period 2026-2030, as well as historical data from 2020-2024 for the following segments.

Market Segment by Component
  • Solutions
  • Services
Market Segment by End-user
  • IT and telecommunication
  • Healthcare and life sciences
  • Automotive and mobility
  • Retail and ecommerce
  • Media and entertainment
Market Segment by Deployment
  • Cloud-based
  • On-premises
  • Hybrid
Market Segment by Geography
North America
US, Canada, Mexico
APAC
China, India, Japan, Australia, South Korea, Indonesia
Europe
Germany, UK, France, Italy, The Netherlands, Spain
South America
Brazil, Argentina, Colombia
Middle East and Africa
Saudi Arabia, UAE, South Africa, Israel, Turkey

Component Segment Analysis

The solutions segment is estimated to witness significant growth during the forecast period.

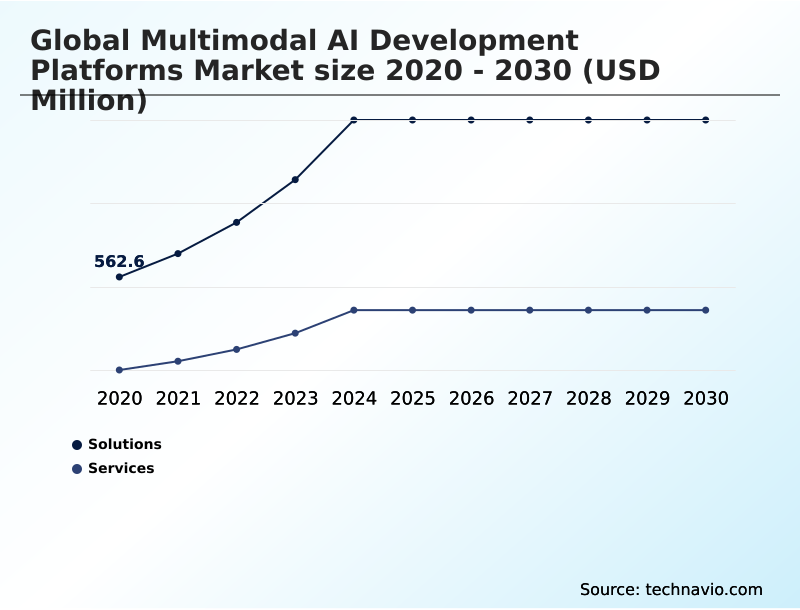
The multimodal AI development platforms market is segmented by component and end-user. The solutions segment, which includes software frameworks and APIs, constitutes the majority of the market, reflecting enterprise investment in foundational technologies for cross-modal data fusion.

These solutions enable the development of systems that perform multimodal video search and leverage vision-language models to process unstructured data. The services segment, encompassing consulting and system integration, supports adoption by bridging internal talent gaps.

End-user segmentation reveals significant adoption in the IT and telecommunication sector, which accounts for over a quarter of demand, followed by healthcare and life sciences, where applications such as multimodal machine learning for diagnostics are critical.

The automotive sector utilizes these platforms for in-cabin systems and autonomous navigation through sensor fusion techniques.

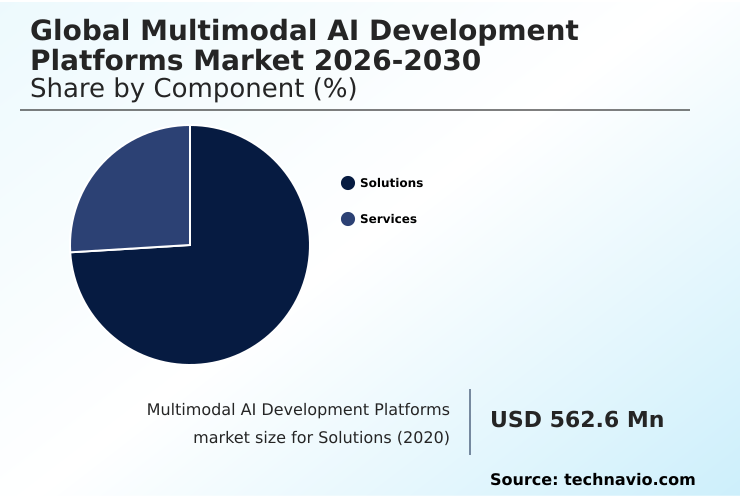
The Solutions segment was valued at USD 1.18 billion in 2024 and showed a gradual increase during the forecast period.

Multimodal Ai Development Platforms Market by Region: North America Leads with 39.5% Growth Share

North America is estimated to contribute 39.5% to the growth of the global market during the forecast period.

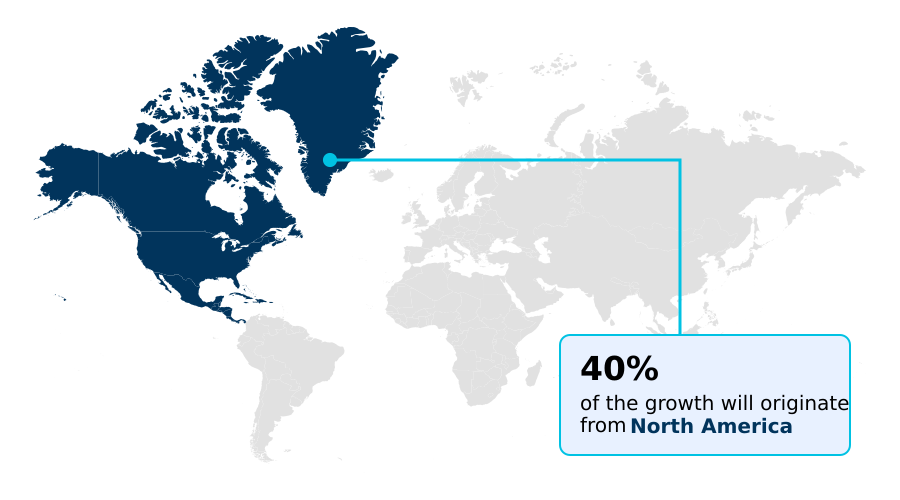
The geographic landscape of the multimodal AI development platforms market is led by North America, which accounts for the largest share of incremental growth, driven by a high concentration of technology firms and robust venture capital investment.

The region's focus is on deploying large multimodal models for commercial applications.

In contrast, the APAC region, projected to have the fastest growth rate at 34.5%, is capitalizing on its hardware manufacturing strengths, particularly in producing the neural processing units essential for edge deployments.

Europe's market is distinguished by a strong emphasis on regulatory compliance, with development adhering to the AI Act, which prioritizes ethical governance and model transparency. This leads to a focus on developing explainable and secure federated multimodal learning systems.

South America and the Middle East and Africa represent smaller but growing markets, with adoption focused on solving specific industrial challenges in agriculture and urban infrastructure.

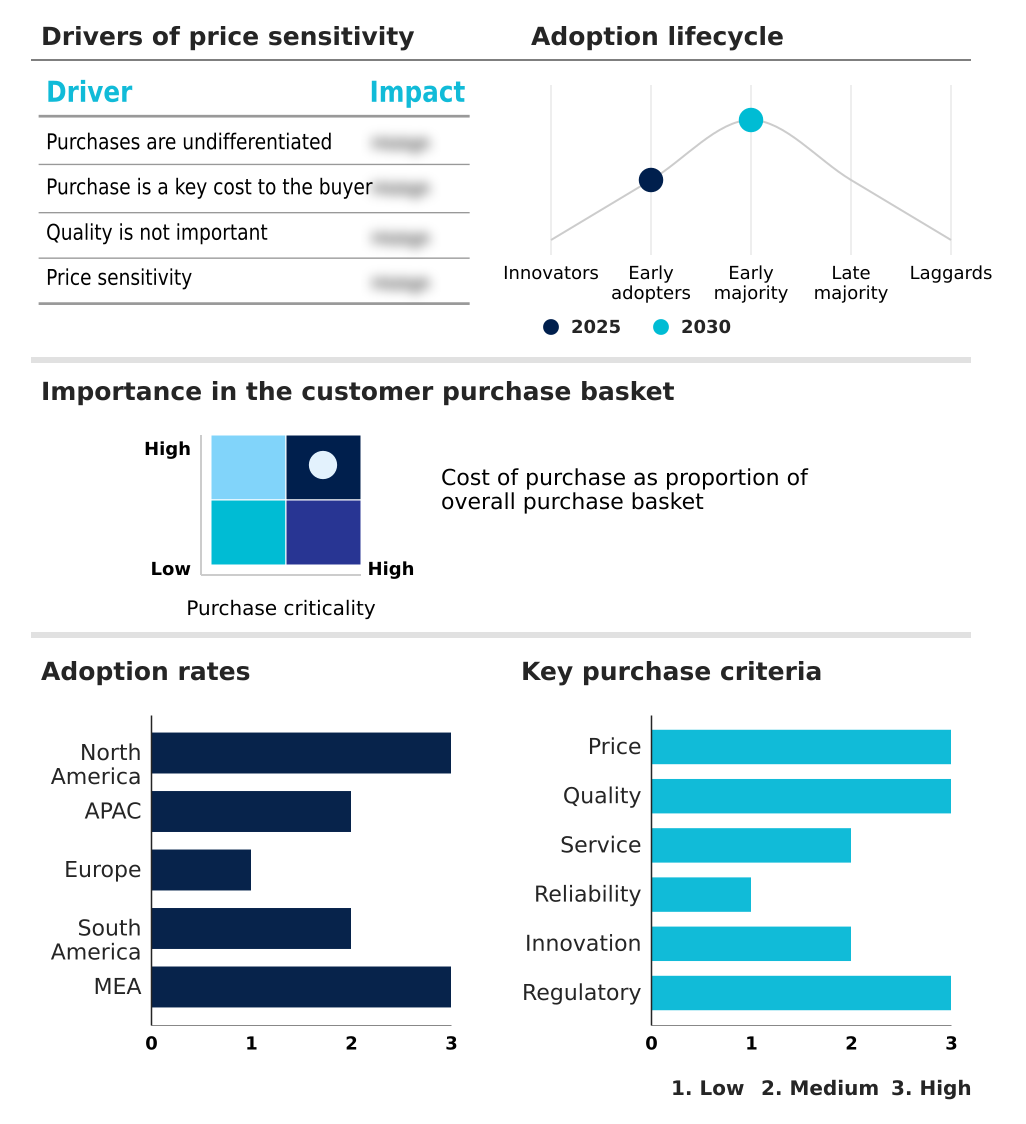
Customer Landscape Analysis for the Multimodal Ai Development Platforms Market

The multimodal ai development platforms market forecasting report includes the adoption lifecycle of the market, covering from the innovator’s stage to the laggard’s stage. It focuses on adoption rates in different regions based on penetration. Furthermore, the multimodal ai development platforms market report also includes key purchase criteria and drivers of price sensitivity to help companies evaluate and develop their market growth analysis strategies.

Competitive Landscape of the Multimodal Ai Development Platforms Market

Companies are implementing various strategies, such as strategic alliances, partnerships, mergers and acquisitions, geographical expansion, and product/service launches, to enhance their presence in the multimodal ai development platforms market industry.

Amazon.com Inc. - Offerings provide ecosystems for developing, training, and deploying models that synthesize diverse data inputs, including text, image, and audio, into a unified architectural framework.

The industry research and growth report includes detailed analyses of the competitive landscape of the market and information about key companies, including:

  • Amazon.com Inc.
  • Anthropic
  • Apple Inc.
  • Baidu Inc.
  • Cohere
  • Databricks Inc.
  • Google LLC
  • Hugging Face Inc.
  • Jina AI GmbH
  • Labelbox
  • Meta Platforms Inc.
  • Microsoft Corp.
  • Mistral AI
  • NVIDIA Corp.
  • OpenAI
  • Qualcomm Inc.
  • Runway AI Inc.
  • Snowflake Inc.
  • TwelveLabs Inc.
  • Weights and Biases Inc.

Qualitative and quantitative analysis of companies has been conducted to help clients understand the wider business environment as well as the strengths and weaknesses of key industry players. Data is qualitatively analyzed to categorize companies as pure play, category-focused, industry-focused, and diversified; it is quantitatively analyzed to categorize companies as dominant, leading, strong, tentative, and weak.

Recent Developments in the Multimodal Ai Development Platforms Market

  • In September 2024, NVIDIA Corp. announced an expanded partnership with Databricks Inc. to integrate its NIM microservices directly into the Mosaic AI platform, optimizing training workflows for large-scale vision-language models on next-generation NVIDIA GPUs.
  • In November 2024, Microsoft Corp. launched an updated version of Azure AI Studio, introducing native support for its Phi-3-vision model and advanced low-code tools tailored for building real-time multimodal applications on edge devices, enhancing its enterprise offerings.
  • In January 2025, TwelveLabs Inc. successfully closed a significant funding round aimed at scaling its specialized APIs and proprietary foundation models for deep video understanding, focusing on improving multimodal video search capabilities for enterprise and media clients.
  • In April 2025, Mistral AI released an advanced version of its open-weight multimodal model, demonstrating superior performance on cross-modal alignment benchmarks and making it available via the Hugging Face Inc. platform to foster community-driven fine-tuning and application development.

Research Analyst Overview: Multimodal Ai Development Platforms Market

Boardroom decisions regarding capital expenditure are increasingly influenced by the operational advantages of multimodal AI systems, which go beyond simple automation to enable sophisticated, cross-domain analysis. The solutions segment currently dominates the multimodal AI development platforms market, reflecting a foundational enterprise strategy to invest in robust software frameworks capable of cross-modal data fusion.

This emphasis is driven by the need to build systems that can perform complex tasks, such as interpreting a combination of diagnostic images and clinical notes in healthcare—a use case governed by strict data handling protocols.

The imperative to comply with regulations like the EU AI Act is shaping platform architecture, demanding greater model transparency and accountability in training vision-language models. Consequently, vendor qualification criteria now heavily weigh a platform’s built-in tools for ethical governance and its ability to manage the entire AI development lifecycle, from data labeling to monitoring for model drift in production environments.

Dive into Technavio’s robust research methodology, blending expert interviews, extensive data synthesis, and validated models for unparalleled Multimodal Ai Development Platforms Market insights. See full methodology.

Request Free Sample

Market Scope
Page number 299
Base year 2025
Historic period 2020-2024
Forecast period 2026-2030
Growth momentum & CAGR Accelerate at a CAGR of 33.3%
Market growth 2026-2030 USD 6660.5 million
Market structure Fragmented
YoY growth 2025-2026(%) 30.3%
Key countries US, Canada, Mexico, China, India, Japan, Australia, South Korea, Indonesia, Germany, UK, France, Italy, The Netherlands, Spain, Brazil, Argentina, Colombia, Saudi Arabia, UAE, South Africa, Israel and Turkey
Competitive landscape Leading Companies, Market Positioning of Companies, Competitive Strategies, and Industry Risks

Multimodal Ai Development Platforms Market: Key Questions Answered in This Report

  • What is the expected growth of the Multimodal Ai Development Platforms Market between 2026 and 2030?

    • The Multimodal Ai Development Platforms Market is expected to grow by USD 6.66 billion during 2026-2030, registering a CAGR of 33.3%. Year-over-year growth in 2026 is estimated at 30.3%%. This acceleration is shaped by strategic expansion of cross-modal data fusion in enterprise ecosystems, which is intensifying demand across multiple end-use verticals covered in the report.

  • What segmentation does the market report cover?

    • The report is segmented by Component (Solutions, and Services), End-user (IT and telecommunication, Healthcare and life sciences, Automotive and mobility, Retail and ecommerce, and Media and entertainment), Deployment (Cloud-based, On-premises, and Hybrid) and Geography (North America, APAC, Europe, South America, Middle East and Africa). Among these, the Solutions segment is estimated to witness significant growth during the forecast period, driven by rising adoption across key application areas. Each segment includes detailed qualitative and quantitative analysis, along with historical data from 2020-2024 and forecasts through 2030 with year-over-year growth rates.

  • Which regions are analyzed in the report?

    • The report covers North America, APAC, Europe, South America and Middle East and Africa. North America is estimated to contribute 39.5% to market growth during the forecast period. Country-level analysis includes US, Canada, Mexico, China, India, Japan, Australia, South Korea, Indonesia, Germany, UK, France, Italy, The Netherlands, Spain, Brazil, Argentina, Colombia, Saudi Arabia, UAE, South Africa, Israel and Turkey, with dedicated market size tables and year-over-year growth for each.

  • What are the key growth drivers and market challenges?

    • The primary driver is strategic expansion of cross-modal data fusion in enterprise ecosystems, which is accelerating investment and industry demand. The main challenge is escalating computational complexity and associated infrastructure expenditures, creating operational barriers for key market participants. The report quantifies the impact of each driver and challenge across 2026 and 2030 with comparative analysis.

  • Who are the major players in the Multimodal Ai Development Platforms Market?

    • Key vendors include Amazon.com Inc., Anthropic, Apple Inc., Baidu Inc., Cohere, Databricks Inc., Google LLC, Hugging Face Inc., Jina AI GmbH, Labelbox, Meta Platforms Inc., Microsoft Corp., Mistral AI, NVIDIA Corp., OpenAI, Qualcomm Inc., Runway AI Inc., Snowflake Inc., TwelveLabs Inc. and Weights and Biases Inc.. The report provides qualitative and quantitative analysis categorizing companies as dominant, leading, strong, tentative, and weak based on their market positioning. Company profiles include business segment analysis, SWOT assessment, key offerings, and recent strategic developments.

Multimodal Ai Development Platforms Market Research Insights

Market dynamics are shaped by the dual pressures of technological advancement and regulatory compliance. The demand for cross-modal data fusion to create more intuitive human-computer interfaces is a primary driver.

However, this is tempered by data sovereignty requirements, particularly under frameworks like the EU's General Data Protection Regulation (GDPR), which governs the handling of personal data used in training vision-language models. In practice, a financial services firm deploying a multimodal AI system for customer verification must balance the processing of voice patterns and facial recognition data with strict privacy mandates.

The solutions segment significantly outweighs the services segment in market contribution, highlighting the focus on acquiring foundational software. This dynamic forces platform providers to innovate on both model capability and built-in governance tools to ensure market viability.

We can help! Our analysts can customize this multimodal ai development platforms market research report to meet your requirements.

Get in touch

1. Executive Summary

1.1 Market overview

Executive Summary - Chart on Market Overview
Executive Summary - Data Table on Market Overview
Executive Summary - Chart on Global Market Characteristics
Executive Summary - Chart on Market by Geography
Executive Summary - Chart on Market Segmentation by Component
Executive Summary - Chart on Market Segmentation by End-user
Executive Summary - Chart on Market Segmentation by Deployment
Executive Summary - Chart on Incremental Growth
Executive Summary - Data Table on Incremental Growth
Executive Summary - Chart on Company Market Positioning

2. Technavio Analysis

2.1 Analysis of price sensitivity, lifecycle, customer purchase basket, adoption rates, and purchase criteria

2.2 Criticality of inputs and Factors of differentiation

Chart on Overview on criticality of inputs and factors of differentiation

2.3 Factors of disruption

Chart on Overview on factors of disruption

2.4 Impact of drivers and challenges

Chart on Impact of drivers and challenges in 2025 and 2030

3. Market Landscape

3.1 Market ecosystem

Chart on Parent Market
Data Table on - Parent Market

3.2 Market characteristics

Chart on Market characteristics analysis

3.3 Value chain analysis

Chart on Value chain analysis

4. Market Sizing

4.1 Market definition

Data Table on Offerings of companies included in the market definition

4.2 Market segment analysis

Market segments

4.3 Market size 2025

4.4 Market outlook: Forecast for 2025-2030

Chart on Global - Market size and forecast 2025-2030 ($ million)
Data Table on Global - Market size and forecast 2025-2030 ($ million)
Chart on Global Market: Year-over-year growth 2025-2030 (%)
Data Table on Global Market: Year-over-year growth 2025-2030 (%)

5. Historic Market Size

5.1 Global Multimodal AI Development Platforms Market 2020 - 2024

Historic Market Size - Data Table on Global Multimodal AI Development Platforms Market 2020 - 2024 ($ million)

5.2 Component segment analysis 2020 - 2024

Historic Market Size - Component Segment 2020 - 2024 ($ million)

5.3 End-user segment analysis 2020 - 2024

Historic Market Size - End-user Segment 2020 - 2024 ($ million)

5.4 Deployment segment analysis 2020 - 2024

Historic Market Size - Deployment Segment 2020 - 2024 ($ million)

5.5 Geography segment analysis 2020 - 2024

Historic Market Size - Geography Segment 2020 - 2024 ($ million)

5.6 Country segment analysis 2020 - 2024

Historic Market Size - Country Segment 2020 - 2024 ($ million)

6. Qualitative Analysis

6.1 Impact of AI on the global multimodal AI development platforms market

7. Five Forces Analysis

7.1 Five forces summary

Five forces analysis - Comparison between 2025 and 2030

7.2 Bargaining power of buyers

Bargaining power of buyers - Impact of key factors 2025 and 2030

7.3 Bargaining power of suppliers

Bargaining power of suppliers - Impact of key factors in 2025 and 2030

7.4 Threat of new entrants

Threat of new entrants - Impact of key factors in 2025 and 2030

7.5 Threat of substitutes

Threat of substitutes - Impact of key factors in 2025 and 2030

7.6 Threat of rivalry

Threat of rivalry - Impact of key factors in 2025 and 2030

7.7 Market condition

Chart on Market condition - Five forces 2025 and 2030

8. Market Segmentation by Component

8.1 Market segments

Chart on Component - Market share 2025-2030 (%)
Data Table on Component - Market share 2025-2030 (%)

8.2 Comparison by Component

Chart on Comparison by Component
Data Table on Comparison by Component

8.3 Solutions - Market size and forecast 2025-2030

Chart on Solutions - Market size and forecast 2025-2030 ($ million)
Data Table on Solutions - Market size and forecast 2025-2030 ($ million)
Chart on Solutions - Year-over-year growth 2025-2030 (%)
Data Table on Solutions - Year-over-year growth 2025-2030 (%)

8.4 Services - Market size and forecast 2025-2030

Chart on Services - Market size and forecast 2025-2030 ($ million)
Data Table on Services - Market size and forecast 2025-2030 ($ million)
Chart on Services - Year-over-year growth 2025-2030 (%)
Data Table on Services - Year-over-year growth 2025-2030 (%)

8.5 Market opportunity by Component

Market opportunity by Component ($ million)
Data Table on Market opportunity by Component ($ million)

9. Market Segmentation by End-user

9.1 Market segments

Chart on End-user - Market share 2025-2030 (%)
Data Table on End-user - Market share 2025-2030 (%)

9.2 Comparison by End-user

Chart on Comparison by End-user
Data Table on Comparison by End-user

9.3 IT and telecommunication - Market size and forecast 2025-2030

Chart on IT and telecommunication - Market size and forecast 2025-2030 ($ million)
Data Table on IT and telecommunication - Market size and forecast 2025-2030 ($ million)
Chart on IT and telecommunication - Year-over-year growth 2025-2030 (%)
Data Table on IT and telecommunication - Year-over-year growth 2025-2030 (%)

9.4 Healthcare and life sciences - Market size and forecast 2025-2030

Chart on Healthcare and life sciences - Market size and forecast 2025-2030 ($ million)
Data Table on Healthcare and life sciences - Market size and forecast 2025-2030 ($ million)
Chart on Healthcare and life sciences - Year-over-year growth 2025-2030 (%)
Data Table on Healthcare and life sciences - Year-over-year growth 2025-2030 (%)

9.5 Automotive and mobility - Market size and forecast 2025-2030

Chart on Automotive and mobility - Market size and forecast 2025-2030 ($ million)
Data Table on Automotive and mobility - Market size and forecast 2025-2030 ($ million)
Chart on Automotive and mobility - Year-over-year growth 2025-2030 (%)
Data Table on Automotive and mobility - Year-over-year growth 2025-2030 (%)

9.6 Retail and ecommerce - Market size and forecast 2025-2030

Chart on Retail and ecommerce - Market size and forecast 2025-2030 ($ million)
Data Table on Retail and ecommerce - Market size and forecast 2025-2030 ($ million)
Chart on Retail and ecommerce - Year-over-year growth 2025-2030 (%)
Data Table on Retail and ecommerce - Year-over-year growth 2025-2030 (%)

9.7 Media and entertainment - Market size and forecast 2025-2030

Chart on Media and entertainment - Market size and forecast 2025-2030 ($ million)
Data Table on Media and entertainment - Market size and forecast 2025-2030 ($ million)
Chart on Media and entertainment - Year-over-year growth 2025-2030 (%)
Data Table on Media and entertainment - Year-over-year growth 2025-2030 (%)

9.8 Market opportunity by End-user

Market opportunity by End-user ($ million)
Data Table on Market opportunity by End-user ($ million)

10. Market Segmentation by Deployment

10.1 Market segments

Chart on Deployment - Market share 2025-2030 (%)
Data Table on Deployment - Market share 2025-2030 (%)

10.2 Comparison by Deployment

Chart on Comparison by Deployment
Data Table on Comparison by Deployment

10.3 Cloud-based - Market size and forecast 2025-2030

Chart on Cloud-based - Market size and forecast 2025-2030 ($ million)
Data Table on Cloud-based - Market size and forecast 2025-2030 ($ million)
Chart on Cloud-based - Year-over-year growth 2025-2030 (%)
Data Table on Cloud-based - Year-over-year growth 2025-2030 (%)

10.4 On-premises - Market size and forecast 2025-2030

Chart on On-premises - Market size and forecast 2025-2030 ($ million)
Data Table on On-premises - Market size and forecast 2025-2030 ($ million)
Chart on On-premises - Year-over-year growth 2025-2030 (%)
Data Table on On-premises - Year-over-year growth 2025-2030 (%)

10.5 Hybrid - Market size and forecast 2025-2030

Chart on Hybrid - Market size and forecast 2025-2030 ($ million)
Data Table on Hybrid - Market size and forecast 2025-2030 ($ million)
Chart on Hybrid - Year-over-year growth 2025-2030 (%)
Data Table on Hybrid - Year-over-year growth 2025-2030 (%)

10.6 Market opportunity by Deployment

Market opportunity by Deployment ($ million)
Data Table on Market opportunity by Deployment ($ million)

11. Customer Landscape

11.1 Customer landscape overview

Analysis of price sensitivity, lifecycle, customer purchase basket, adoption rates, and purchase criteria

12. Geographic Landscape

12.1 Geographic segmentation

Chart on Market share by geography 2025-2030 (%)
Data Table on Market share by geography 2025-2030 (%)

12.2 Geographic comparison

Chart on Geographic comparison
Data Table on Geographic comparison

12.3 North America - Market size and forecast 2025-2030

Chart on North America - Market size and forecast 2025-2030 ($ million)
Data Table on North America - Market size and forecast 2025-2030 ($ million)
Chart on North America - Year-over-year growth 2025-2030 (%)
Data Table on North America - Year-over-year growth 2025-2030 (%)
Chart on Regional Comparison - North America
Data Table on Regional Comparison - North America

12.3.1 US - Market size and forecast 2025-2030

Chart on US - Market size and forecast 2025-2030 ($ million)
Data Table on US - Market size and forecast 2025-2030 ($ million)
Chart on US - Year-over-year growth 2025-2030 (%)
Data Table on US - Year-over-year growth 2025-2030 (%)

12.3.2 Canada - Market size and forecast 2025-2030

Chart on Canada - Market size and forecast 2025-2030 ($ million)
Data Table on Canada - Market size and forecast 2025-2030 ($ million)
Chart on Canada - Year-over-year growth 2025-2030 (%)
Data Table on Canada - Year-over-year growth 2025-2030 (%)

12.3.3 Mexico - Market size and forecast 2025-2030

Chart on Mexico - Market size and forecast 2025-2030 ($ million)
Data Table on Mexico - Market size and forecast 2025-2030 ($ million)
Chart on Mexico - Year-over-year growth 2025-2030 (%)
Data Table on Mexico - Year-over-year growth 2025-2030 (%)

12.4 APAC - Market size and forecast 2025-2030

Chart on APAC - Market size and forecast 2025-2030 ($ million)
Data Table on APAC - Market size and forecast 2025-2030 ($ million)
Chart on APAC - Year-over-year growth 2025-2030 (%)
Data Table on APAC - Year-over-year growth 2025-2030 (%)
Chart on Regional Comparison - APAC
Data Table on Regional Comparison - APAC

12.4.1 China - Market size and forecast 2025-2030

Chart on China - Market size and forecast 2025-2030 ($ million)
Data Table on China - Market size and forecast 2025-2030 ($ million)
Chart on China - Year-over-year growth 2025-2030 (%)
Data Table on China - Year-over-year growth 2025-2030 (%)

12.4.2 India - Market size and forecast 2025-2030

Chart on India - Market size and forecast 2025-2030 ($ million)
Data Table on India - Market size and forecast 2025-2030 ($ million)
Chart on India - Year-over-year growth 2025-2030 (%)
Data Table on India - Year-over-year growth 2025-2030 (%)

12.4.3 Japan - Market size and forecast 2025-2030

Chart on Japan - Market size and forecast 2025-2030 ($ million)
Data Table on Japan - Market size and forecast 2025-2030 ($ million)
Chart on Japan - Year-over-year growth 2025-2030 (%)
Data Table on Japan - Year-over-year growth 2025-2030 (%)

12.4.4 Australia - Market size and forecast 2025-2030

Chart on Australia - Market size and forecast 2025-2030 ($ million)
Data Table on Australia - Market size and forecast 2025-2030 ($ million)
Chart on Australia - Year-over-year growth 2025-2030 (%)
Data Table on Australia - Year-over-year growth 2025-2030 (%)

12.4.5 South Korea - Market size and forecast 2025-2030

Chart on South Korea - Market size and forecast 2025-2030 ($ million)
Data Table on South Korea - Market size and forecast 2025-2030 ($ million)
Chart on South Korea - Year-over-year growth 2025-2030 (%)
Data Table on South Korea - Year-over-year growth 2025-2030 (%)

12.4.6 Indonesia - Market size and forecast 2025-2030

Chart on Indonesia - Market size and forecast 2025-2030 ($ million)
Data Table on Indonesia - Market size and forecast 2025-2030 ($ million)
Chart on Indonesia - Year-over-year growth 2025-2030 (%)
Data Table on Indonesia - Year-over-year growth 2025-2030 (%)

12.5 Europe - Market size and forecast 2025-2030

Chart on Europe - Market size and forecast 2025-2030 ($ million)
Data Table on Europe - Market size and forecast 2025-2030 ($ million)
Chart on Europe - Year-over-year growth 2025-2030 (%)
Data Table on Europe - Year-over-year growth 2025-2030 (%)
Chart on Regional Comparison - Europe
Data Table on Regional Comparison - Europe

12.5.1 Germany - Market size and forecast 2025-2030

Chart on Germany - Market size and forecast 2025-2030 ($ million)
Data Table on Germany - Market size and forecast 2025-2030 ($ million)
Chart on Germany - Year-over-year growth 2025-2030 (%)
Data Table on Germany - Year-over-year growth 2025-2030 (%)

12.5.2 UK - Market size and forecast 2025-2030

Chart on UK - Market size and forecast 2025-2030 ($ million)
Data Table on UK - Market size and forecast 2025-2030 ($ million)
Chart on UK - Year-over-year growth 2025-2030 (%)
Data Table on UK - Year-over-year growth 2025-2030 (%)

12.5.3 France - Market size and forecast 2025-2030

Chart on France - Market size and forecast 2025-2030 ($ million)
Data Table on France - Market size and forecast 2025-2030 ($ million)
Chart on France - Year-over-year growth 2025-2030 (%)
Data Table on France - Year-over-year growth 2025-2030 (%)

12.5.4 Italy - Market size and forecast 2025-2030

Chart on Italy - Market size and forecast 2025-2030 ($ million)
Data Table on Italy - Market size and forecast 2025-2030 ($ million)
Chart on Italy - Year-over-year growth 2025-2030 (%)
Data Table on Italy - Year-over-year growth 2025-2030 (%)

12.5.5 The Netherlands - Market size and forecast 2025-2030

Chart on The Netherlands - Market size and forecast 2025-2030 ($ million)
Data Table on The Netherlands - Market size and forecast 2025-2030 ($ million)
Chart on The Netherlands - Year-over-year growth 2025-2030 (%)
Data Table on The Netherlands - Year-over-year growth 2025-2030 (%)

12.5.6 Spain - Market size and forecast 2025-2030

Chart on Spain - Market size and forecast 2025-2030 ($ million)
Data Table on Spain - Market size and forecast 2025-2030 ($ million)
Chart on Spain - Year-over-year growth 2025-2030 (%)
Data Table on Spain - Year-over-year growth 2025-2030 (%)

12.6 South America - Market size and forecast 2025-2030

Chart on South America - Market size and forecast 2025-2030 ($ million)
Data Table on South America - Market size and forecast 2025-2030 ($ million)
Chart on South America - Year-over-year growth 2025-2030 (%)
Data Table on South America - Year-over-year growth 2025-2030 (%)
Chart on Regional Comparison - South America
Data Table on Regional Comparison - South America

12.6.1 Brazil - Market size and forecast 2025-2030

Chart on Brazil - Market size and forecast 2025-2030 ($ million)
Data Table on Brazil - Market size and forecast 2025-2030 ($ million)
Chart on Brazil - Year-over-year growth 2025-2030 (%)
Data Table on Brazil - Year-over-year growth 2025-2030 (%)

12.6.2 Argentina - Market size and forecast 2025-2030

Chart on Argentina - Market size and forecast 2025-2030 ($ million)
Data Table on Argentina - Market size and forecast 2025-2030 ($ million)
Chart on Argentina - Year-over-year growth 2025-2030 (%)
Data Table on Argentina - Year-over-year growth 2025-2030 (%)

12.6.3 Colombia - Market size and forecast 2025-2030

Chart on Colombia - Market size and forecast 2025-2030 ($ million)
Data Table on Colombia - Market size and forecast 2025-2030 ($ million)
Chart on Colombia - Year-over-year growth 2025-2030 (%)
Data Table on Colombia - Year-over-year growth 2025-2030 (%)

12.7 Middle East and Africa - Market size and forecast 2025-2030

Chart on Middle East and Africa - Market size and forecast 2025-2030 ($ million)
Data Table on Middle East and Africa - Market size and forecast 2025-2030 ($ million)
Chart on Middle East and Africa - Year-over-year growth 2025-2030 (%)
Data Table on Middle East and Africa - Year-over-year growth 2025-2030 (%)
Chart on Regional Comparison - Middle East and Africa
Data Table on Regional Comparison - Middle East and Africa

12.7.1 Saudi Arabia - Market size and forecast 2025-2030

Chart on Saudi Arabia - Market size and forecast 2025-2030 ($ million)
Data Table on Saudi Arabia - Market size and forecast 2025-2030 ($ million)
Chart on Saudi Arabia - Year-over-year growth 2025-2030 (%)
Data Table on Saudi Arabia - Year-over-year growth 2025-2030 (%)

12.7.2 UAE - Market size and forecast 2025-2030

Chart on UAE - Market size and forecast 2025-2030 ($ million)
Data Table on UAE - Market size and forecast 2025-2030 ($ million)
Chart on UAE - Year-over-year growth 2025-2030 (%)
Data Table on UAE - Year-over-year growth 2025-2030 (%)

12.7.3 South Africa - Market size and forecast 2025-2030

Chart on South Africa - Market size and forecast 2025-2030 ($ million)
Data Table on South Africa - Market size and forecast 2025-2030 ($ million)
Chart on South Africa - Year-over-year growth 2025-2030 (%)
Data Table on South Africa - Year-over-year growth 2025-2030 (%)

12.7.4 Israel - Market size and forecast 2025-2030

Chart on Israel - Market size and forecast 2025-2030 ($ million)
Data Table on Israel - Market size and forecast 2025-2030 ($ million)
Chart on Israel - Year-over-year growth 2025-2030 (%)
Data Table on Israel - Year-over-year growth 2025-2030 (%)

12.7.5 Turkey - Market size and forecast 2025-2030

Chart on Turkey - Market size and forecast 2025-2030 ($ million)
Data Table on Turkey - Market size and forecast 2025-2030 ($ million)
Chart on Turkey - Year-over-year growth 2025-2030 (%)
Data Table on Turkey - Year-over-year growth 2025-2030 (%)

12.8 Market opportunity by geography

Market opportunity by geography ($ million)
Data Tables on Market opportunity by geography ($ million)

13. Drivers, Challenges, and Opportunity

13.1 Market drivers

Strategic expansion of cross-modal data fusion in enterprise ecosystems
Accelerating integration of edge computing in multimodal AI deployment
Democratization through low-code and no-code development environments

13.2 Market challenges

Escalating computational complexity and associated infrastructure expenditures
Complexities regarding data sovereignty and ethical governance frameworks
Persistence of interoperability deficits and technical standardization gaps

13.3 Impact of drivers and challenges

Impact of drivers and challenges in 2025 and 2030

13.4 Market opportunities

Institutional adoption of federated multimodal learning frameworks
Expansion of specialized multimodal evaluation and observability benchmarks
Emergence of domain-specific multimodal foundation models

14. Competitive Landscape

14.1 Overview

14.2

Overview on criticality of inputs and factors of differentiation

14.3 Landscape disruption

Overview on factors of disruption

14.4 Industry risks

Impact of key risks on business

15. Competitive Analysis

15.1 Companies profiled

Companies covered

15.2 Company ranking index

15.3 Market positioning of companies

Matrix on companies position and classification

15.4 Amazon.com Inc.

Amazon.com Inc. - Overview
Amazon.com Inc. - Business segments
Amazon.com Inc. - Key news
Amazon.com Inc. - Key offerings
Amazon.com Inc. - Segment focus
SWOT

15.5 Anthropic

Anthropic - Overview
Anthropic - Product / Service
Anthropic - Key offerings
SWOT

15.6 Baidu Inc.

Baidu Inc. - Overview
Baidu Inc. - Business segments
Baidu Inc. - Key news
Baidu Inc. - Key offerings
Baidu Inc. - Segment focus
SWOT

15.7 Databricks Inc.

Databricks Inc. - Overview
Databricks Inc. - Product / Service
Databricks Inc. - Key offerings
SWOT

15.8 Google LLC

Google LLC - Overview
Google LLC - Product / Service
Google LLC - Key offerings
SWOT

15.9 Hugging Face Inc.

Hugging Face Inc. - Overview
Hugging Face Inc. - Product / Service
Hugging Face Inc. - Key offerings
SWOT

15.10 Jina AI GmbH

Jina AI GmbH - Overview
Jina AI GmbH - Product / Service
Jina AI GmbH - Key offerings
SWOT

15.11 Meta Platforms Inc.

Meta Platforms Inc. - Overview
Meta Platforms Inc. - Business segments
Meta Platforms Inc. - Key offerings
Meta Platforms Inc. - Segment focus
SWOT

15.12 Microsoft Corp.

Microsoft Corp. - Overview
Microsoft Corp. - Business segments
Microsoft Corp. - Key news
Microsoft Corp. - Key offerings
Microsoft Corp. - Segment focus
SWOT

15.13 Mistral AI

Mistral AI - Overview
Mistral AI - Product / Service
Mistral AI - Key offerings
SWOT

15.14 NVIDIA Corp.

NVIDIA Corp. - Overview
NVIDIA Corp. - Business segments
NVIDIA Corp. - Key news
NVIDIA Corp. - Key offerings
NVIDIA Corp. - Segment focus
SWOT

15.15 OpenAI

OpenAI - Overview
OpenAI - Product / Service
OpenAI - Key offerings
SWOT

15.16 Snowflake Inc.

Snowflake Inc. - Overview
Snowflake Inc. - Business segments
Snowflake Inc. - Key news
Snowflake Inc. - Key offerings
Snowflake Inc. - Segment focus
SWOT

15.17 TwelveLabs Inc.

TwelveLabs Inc. - Overview
TwelveLabs Inc. - Product / Service
TwelveLabs Inc. - Key offerings
SWOT

15.18 Weights and Biases Inc.

Weights and Biases Inc. - Overview
Weights and Biases Inc. - Product / Service
Weights and Biases Inc. - Key offerings
SWOT

16. Appendix

16.1 Scope of the report

Market definition
Objectives
Notes and caveats

16.2 Inclusions and exclusions checklist

Inclusions checklist
Exclusions checklist

16.3 Currency conversion rates for US$

16.4 Research methodology

16.5 Data procurement

Information sources

16.6 Data validation

16.7 Validation techniques employed for market sizing

16.8 Data synthesis

16.9 360 degree market analysis

16.10 List of abbreviations

Research Methodology

Technavio presents a detailed picture of the market by way of study, synthesis, and summation of data from multiple sources. The analysts have presented the various facets of the market with a particular focus on identifying the key industry influencers. The data thus presented is comprehensive, reliable, and the result of extensive research, both primary and secondary.

INFORMATION SOURCES

Primary sources

  • Manufacturers and suppliers
  • Channel partners
  • Industry experts
  • Strategic decision makers

Secondary sources

  • Industry journals and periodicals
  • Government data
  • Financial reports of key industry players
  • Historical data
  • Press releases

DATA ANALYSIS

Data Synthesis

  • Collation of data
  • Estimation of key figures
  • Analysis of derived insights

Data Validation

  • Triangulation with data models
  • Reference against proprietary databases
  • Corroboration with industry experts

REPORT WRITING

Qualitative

  • Market drivers
  • Market challenges
  • Market trends
  • Five forces analysis

Quantitative

  • Market size and forecast
  • Market segmentation
  • Geographical insights
  • Competitive landscape

Interested in this report?

Get your sample now to see our research methodology and insights!

Download Now

Frequently Asked Questions

Multimodal Ai Development Platforms market growth will increase by USD 6660.5 million during 2026-2030.

The Multimodal Ai Development Platforms market is expected to grow at a CAGR of 33.3% during 2026-2030.

Multimodal Ai Development Platforms market is segmented by Component (Solutions, Services) End-user (IT and telecommunication, Healthcare and life sciences, Automotive and mobility, Retail and ecommerce, Media and entertainment) Deployment (Cloud-based, On-premises, Hybrid)

Amazon.com Inc., Anthropic, Apple Inc., Baidu Inc., Cohere, Databricks Inc., Google LLC, Hugging Face Inc., Jina AI GmbH, Labelbox, Meta Platforms Inc., Microsoft Corp., Mistral AI, NVIDIA Corp., OpenAI, Qualcomm Inc., Runway AI Inc., Snowflake Inc., TwelveLabs Inc., Weights and Biases Inc. are a few of the key vendors in the Multimodal Ai Development Platforms market.

North America will register the highest growth rate of 39.5% among the other regions. Therefore, the Multimodal Ai Development Platforms market in North America is expected to garner significant business opportunities for the vendors during the forecast period.

US, Canada, Mexico, China, India, Japan, Australia, South Korea, Indonesia, Germany, UK, France, Italy, The Netherlands, Spain, Brazil, Argentina, Colombia, Saudi Arabia, UAE, South Africa, Israel, Turkey

  • Strategic expansion of cross-modal data fusion in enterprise ecosystems is the driving factor this market.

The Multimodal Ai Development Platforms market vendors should focus on grabbing business opportunities from the Component segment as it accounted for the largest market share in the base year.
RIA - Research AI Assistant
Ask RIA