
Natural And Organic Personal Care Product Market Size 2026-2030
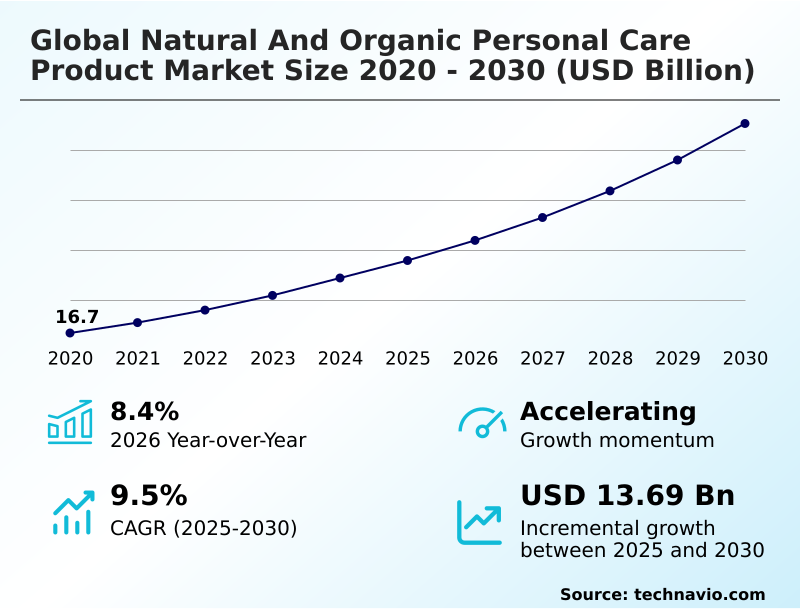
The natural and organic personal care product market size is valued to increase by USD 13.69 billion, at a CAGR of 9.5% from 2025 to 2030. Rising consumer health and environmental awareness will drive the natural and organic personal care product market.
Major Market Trends & Insights
- North America dominated the market and accounted for a 36% growth during the forecast period.
- By Product - Skincare segment was valued at USD 7.85 billion in 2024
- By Distribution Channel - Offline stores segment accounted for the largest market revenue share in 2024
Market Size & Forecast
- Market Opportunities: USD 20.95 billion
- Market Future Opportunities: USD 13.69 billion
- CAGR from 2025 to 2030 : 9.5%
Market Summary
- The natural and organic personal care product market is shaped by a profound shift in consumer values toward holistic wellness and environmental stewardship. Key drivers include a demand for ingredient transparency and formulations free from synthetic chemicals, pushing companies to adopt clean label ingredients and cruelty-free certification.
- This trend is balanced by significant challenges, particularly in maintaining supply chain resilience for certified organic ingredients, where volatility can disrupt production. For instance, a manufacturer relying on a single source for a wild-harvested botanical faces operational risks if climate events affect crop yields.
- To mitigate this, leading firms are diversifying their sustainable sourcing practices and investing in regenerative agriculture sourcing, ensuring a stable supply of key inputs like cold-pressed oils and plant-based emulsifiers. The market also sees innovation through the integration of fermented ingredients and biotechnology-enhanced extracts, which offer enhanced performance while adhering to green chemistry principles.
- This dynamic interplay between consumer demand, supply chain integrity, and technological advancement defines the competitive landscape.
What will be the Size of the Natural And Organic Personal Care Product Market during the forecast period?
Get Key Insights on Market Forecast (PDF) Get Free Sample
How is the Natural And Organic Personal Care Product Market Segmented?
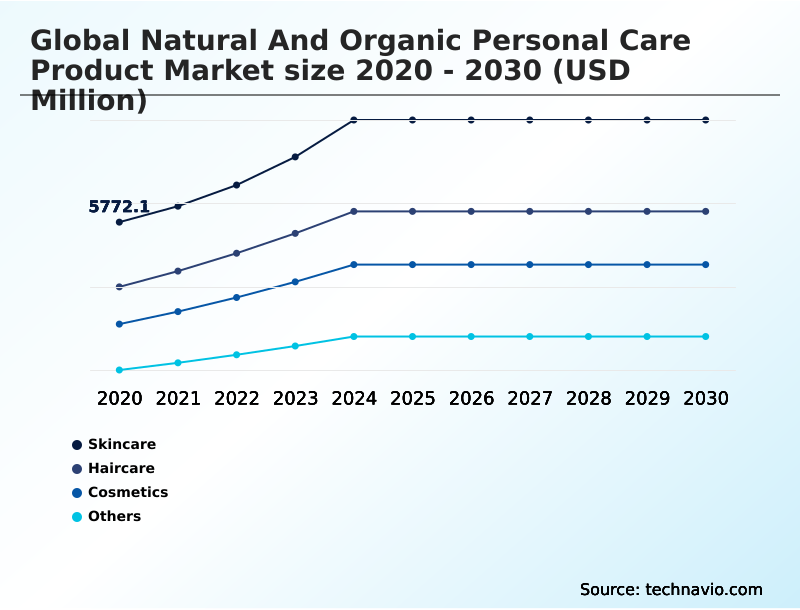
The natural and organic personal care product industry research report provides comprehensive data (region-wise segment analysis), with forecasts and estimates in "USD million" for the period 2026-2030, as well as historical data from 2020-2024 for the following segments.
- Product
- Skincare
- Haircare
- Cosmetics
- Others
- Distribution channel
- Offline stores
- Online stores
- Consumer
- Women
- Men
- Others
- Geography
- North America
- US
- Canada
- Mexico
- Europe
- Germany
- UK
- France
- APAC
- China
- Japan
- South Korea
- South America
- Brazil
- Argentina
- Middle East and Africa
- Saudi Arabia
- UAE
- South Africa
- Rest of World (ROW)
- North America
By Product Insights
The skincare segment is estimated to witness significant growth during the forecast period.
The skincare segment is at the forefront of the natural and organic personal care product market, propelled by a consumer-led clean beauty movement.
This trend is defined by a demand for ingredient transparency and a preference for plant-based alternatives over synthetic chemicals. Formulations are increasingly incorporating plant-derived actives and botanical extracts, moving toward waterless skincare formulations to enhance stability and sustainability.
The focus on preventive skin health is driving adoption of products with certified organic ingredients and eco-friendly packaging.
Regulatory shifts underscore this trend, with new frameworks mandating that at least 95% of components in products labeled as 'natural' must originate from natural sources.
This push for brand authenticity and trust encourages the use of plant-based emulsifiers and natural foaming agents to meet eco-conscious consumerism.
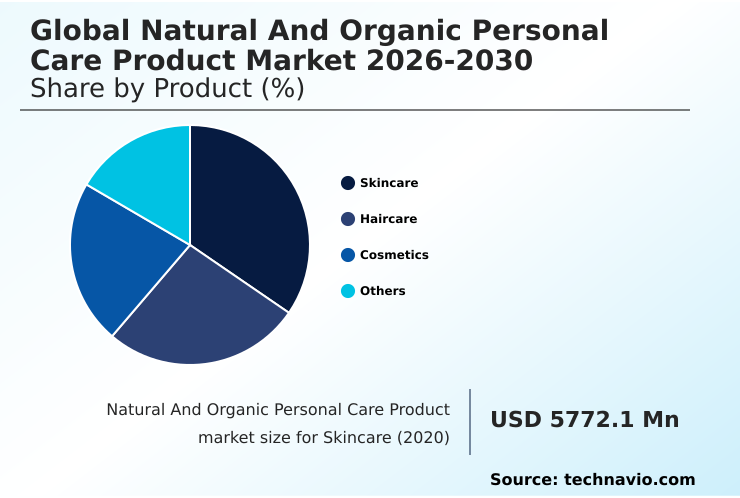
The Skincare segment was valued at USD 7.85 billion in 2024 and showed a gradual increase during the forecast period.
Regional Analysis
North America is estimated to contribute 36% to the growth of the global market during the forecast period.Technavio’s analysts have elaborately explained the regional trends and drivers that shape the market during the forecast period.
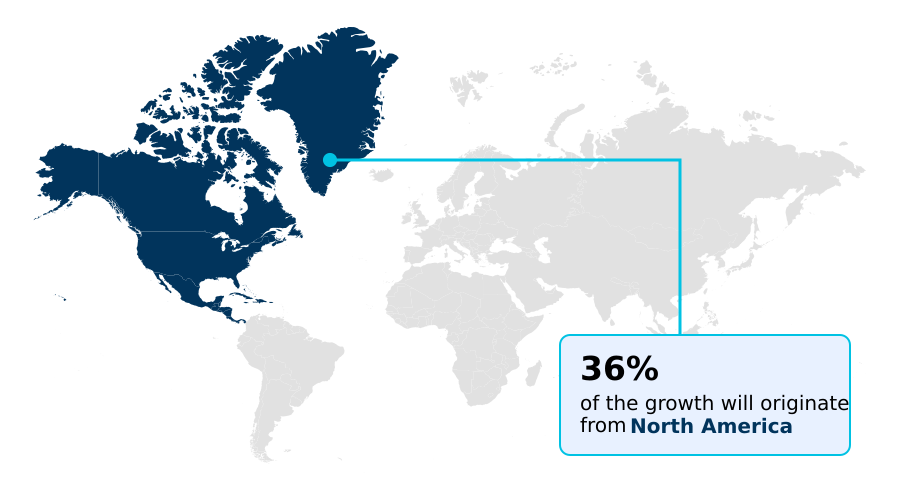
See How Natural And Organic Personal Care Product Market Demand is Rising in North America Get Free Sample
The geographic landscape of the market is characterized by mature, awareness-driven demand in North America and Europe, contrasted with rapid, income-fueled growth in APAC.
North America is expected to contribute approximately 36% of the market's incremental growth, driven by a strong digital beauty community and a preference for eco-certified products.
The APAC region is projected to expand at the fastest rate, with a growth forecast of 11.1%, as consumers increasingly favor ayurvedic herbal formulations and products with non-GMO verification.
This regional dynamic is influencing global supply chains for essential oil fragrances and upcycled ingredients.
Across all regions, the slow beauty philosophy is gaining traction, promoting the use of wild-harvested botanicals and supporting a holistic self-care ritual, which in turn fuels demand for dermo-cosmetic products that offer evidence-based natural care.
Market Dynamics
Our researchers analyzed the data with 2025 as the base year, along with the key drivers, trends, and challenges. A holistic analysis of drivers will help companies refine their marketing strategies to gain a competitive advantage.
- Consumer inquiries are increasingly specific, shaping product development and marketing in the natural and organic personal care product market. Questions like 'how to choose a natural deodorant' and 'what are the benefits of sulfate-free shampoo for hair' indicate a move from general interest to a need for targeted solutions.
- This has led to a focus on the effectiveness of plant stem cell serums and the benefits of fermented ingredients in skincare. In response, companies are highlighting how their organic anti-aging face serums or paraben-free lotions for sensitive skin address these precise needs.
- The conversation also extends to industry practices, with consumers questioning the regulatory standards for clean beauty claims and learning how to identify greenwashing in beauty. Supply chain challenges for organic ingredients and the traceability of ethically sourced mica are now part of the public discourse.
- Brands leveraging transparent supply chains have reported a 15% greater consistency in sourcing key botanicals compared to conventional models. The impact of green chemistry on cosmetics is evident in the rise of the waterless skincare routine for travel and the growing demand for zero-waste packaging for personal care.
- This focus on sustainability also drives interest in the importance of reef-safe sunscreen ingredients and sustainable sourcing of palm oil alternatives, reflecting a sophisticated understanding of the entire product lifecycle.
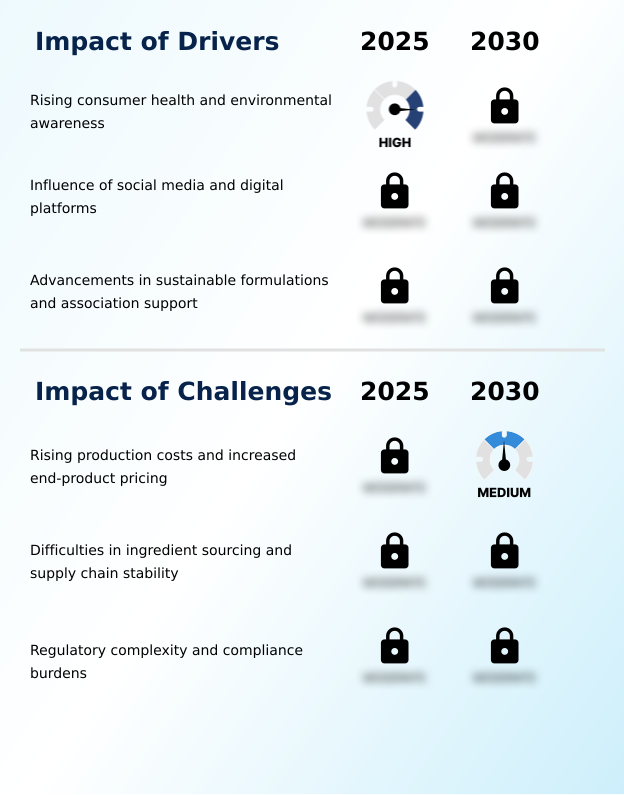
What are the key market drivers leading to the rise in the adoption of Natural And Organic Personal Care Product Industry?
- The market is primarily driven by rising consumer awareness regarding personal health and environmental sustainability.
- Rising consumer health consciousness and a desire for ingredient transparency are primary market drivers.
- The adoption of sustainable sourcing practices and traceable supply chains has become a key differentiator, with brands providing full transparency seeing a 25% lift in consumer trust.
- This eco-conscious consumerism supports a holistic wellness approach, where products with paraben-free preservatives and clean label ingredients are standard. The focus on a sustainable product lifecycle, from regenerative agriculture sourcing to biodegradable packaging, is critical.
- Formulations featuring cold-pressed oils and plant-based alternatives are in high demand, while the move toward zero-waste manufacturing has helped companies reduce production waste by over 30%, enhancing both brand reputation and operational efficiency.
What are the market trends shaping the Natural And Organic Personal Care Product Industry?
- A significant market trend is the definitive shift toward clean beauty. This movement is driven by increasing consumer demand for complete ingredient transparency.
- Key trends are reshaping the market, driven by consumer demand for multifunctional products and minimalist beauty routines. The integration of probiotic skincare technology and personalized skincare solutions is gaining momentum, with brands using data to improve product recommendations, increasing customer satisfaction scores by up to 20%.
- The emphasis on skin barrier health and anti-pollution skincare is leading to the development of advanced formulations. Companies adopting circular economy principles in their packaging have successfully reduced material use by 15%.
- This shift toward sustainability is also reflected in the growing adoption of water conservation in beauty practices and the use of natural preservatives, aligning with the slow beauty philosophy and promoting ethical consumer choices.
What challenges does the Natural And Organic Personal Care Product Industry face during its growth?
- A key challenge affecting industry growth is the impact of rising production costs, which contributes to increased end-product pricing.
- Significant challenges constrain market growth, led by supply chain resilience issues and regulatory complexity. Sourcing consistent, high-quality botanical extracts and other raw materials remains difficult, leading to production delays that can impact revenue by as much as 10% for specialized brands. The high cost of cold-processed saponification and certified organic ingredients contributes to premium pricing, which can limit market penetration.
- Furthermore, navigating divergent international standards for vegan product certification and cruelty-free certification creates compliance burdens, increasing administrative costs by an estimated 15-20% for companies operating globally. Developing effective natural preservatives and mineral-based pigments that meet both performance and safety standards without using certain chemicals also presents ongoing technical hurdles.
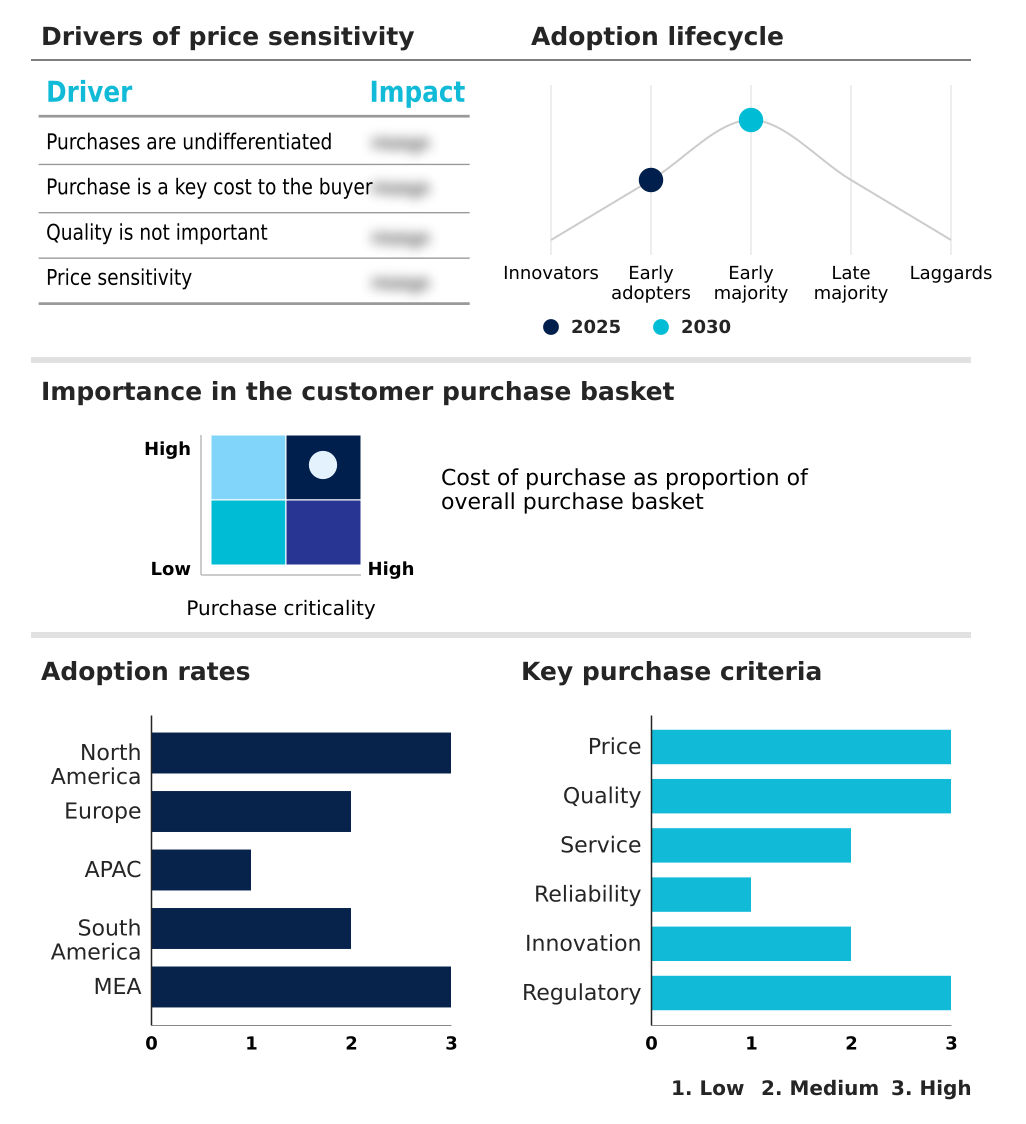
Exclusive Technavio Analysis on Customer Landscape
The natural and organic personal care product market forecasting report includes the adoption lifecycle of the market, covering from the innovator’s stage to the laggard’s stage. It focuses on adoption rates in different regions based on penetration. Furthermore, the natural and organic personal care product market report also includes key purchase criteria and drivers of price sensitivity to help companies evaluate and develop their market growth analysis strategies.
Customer Landscape of Natural And Organic Personal Care Product Industry
Competitive Landscape
Companies are implementing various strategies, such as strategic alliances, natural and organic personal care product market forecast, partnerships, mergers and acquisitions, geographical expansion, and product/service launches, to enhance their presence in the industry.
100 Percent PURE - Offerings include performance-driven cosmetics and skincare utilizing fruit-pigmented and plant-based formulations for the conscious consumer.
The industry research and growth report includes detailed analyses of the competitive landscape of the market and information about key companies, including:
- 100 Percent PURE
- Carter and Jane LLC
- CLARINS FRANCE
- Eminence Organic Skin Care
- Forest Essentials
- Juice Beauty
- Korres
- Laboratoires Expanscience
- Loccitane International SA
- Loreal SA
- OSEA International LLC
- Procter and Gamble Co.
- The Clorox Co.
- The Estee Lauder Co. Inc.
- The Hain Celestial Group
- True Botanicals Inc.
- Weleda
- Yves Rocher
Qualitative and quantitative analysis of companies has been conducted to help clients understand the wider business environment as well as the strengths and weaknesses of key industry players. Data is qualitatively analyzed to categorize companies as pure play, category-focused, industry-focused, and diversified; it is quantitatively analyzed to categorize companies as dominant, leading, strong, tentative, and weak.
Recent Development and News in Natural and organic personal care product market
- In January, 2025, LOreal Groupe unveiled a portable skin analysis technology at CES, designed to provide personalized guidance toward natural and organic skincare solutions tailored to individual needs.
- In January, 2025, The Ordinary expanded its clean beauty offerings by launching a new line of peptide-based serums, marketed with a focus on sourcing transparency and minimal processing to appeal to ingredient-conscious consumers.
- In March, 2025, Weleda, in collaboration with Princess Madeleine, launched minLen, a new multi-generational natural skincare brand focused on safe and responsible formulations for children, teens, and adults.
- In May, 2025, Tata Harper launched a new multi-tasking face oil formulated with organic botanicals to hydrate, firm, and protect against environmental stressors, catering to consumers seeking minimalist beauty routines.
Dive into Technavio’s robust research methodology, blending expert interviews, extensive data synthesis, and validated models for unparalleled Natural And Organic Personal Care Product Market insights. See full methodology.
| Market Scope | |
|---|---|
| Page number | 296 |
| Base year | 2025 |
| Historic period | 2020-2024 |
| Forecast period | 2026-2030 |
| Growth momentum & CAGR | Accelerate at a CAGR of 9.5% |
| Market growth 2026-2030 | USD 13692.3 million |
| Market structure | Fragmented |
| YoY growth 2025-2026(%) | 8.4% |
| Key countries | US, Canada, Mexico, Germany, UK, France, Italy, Spain, The Netherlands, China, Japan, South Korea, India, Australia, Indonesia, Brazil, Argentina, Chile, Saudi Arabia, UAE, South Africa, Israel and Turkey |
| Competitive landscape | Leading Companies, Market Positioning of Companies, Competitive Strategies, and Industry Risks |
Research Analyst Overview
- The natural and organic personal care product market's architecture is defined by a rigorous commitment to clean formulations and sustainable operations. Core to this are plant-derived actives and certified organic ingredients, which form the basis of sulfate-free formulations and paraben-free preservatives. Boardroom decisions increasingly weigh the costs of wild-harvested botanicals against innovative upcycled ingredients to manage margins without compromising quality.
- The industry is advancing through green chemistry principles, enabling waterless skincare formulations and the use of natural foaming agents. Traceable supply chains are now critical for verifying ethically sourced mica and ensuring cruelty-free certification, with some firms achieving a 20% reduction in verification time. Innovations in plant-based emulsifiers, fermented ingredients, and biotechnology-enhanced extracts are elevating product performance.
- The adoption of biodegradable packaging and refillable packaging systems is driven by zero-waste manufacturing goals. Formulations now feature plant stem cells, natural antioxidants, and bioactive compounds, while avoiding GMOs. This commitment to purity is validated through vegan product certification and a focus on clean label ingredients.
What are the Key Data Covered in this Natural And Organic Personal Care Product Market Research and Growth Report?
-
What is the expected growth of the Natural And Organic Personal Care Product Market between 2026 and 2030?
-
USD 13.69 billion, at a CAGR of 9.5%
-
-
What segmentation does the market report cover?
-
The report is segmented by Product (Skincare, Haircare, Cosmetics, and Others), Distribution Channel (Offline stores, and Online stores), Consumer (Women, Men, and Others) and Geography (North America, Europe, APAC, South America, Middle East and Africa)
-
-
Which regions are analyzed in the report?
-
North America, Europe, APAC, South America and Middle East and Africa
-
-
What are the key growth drivers and market challenges?
-
Rising consumer health and environmental awareness, Rising production costs and increased end-product pricing
-
-
Who are the major players in the Natural And Organic Personal Care Product Market?
-
100 Percent PURE, Carter and Jane LLC, CLARINS FRANCE, Eminence Organic Skin Care, Forest Essentials, Juice Beauty, Korres, Laboratoires Expanscience, Loccitane International SA, Loreal SA, OSEA International LLC, Procter and Gamble Co., The Clorox Co., The Estee Lauder Co. Inc., The Hain Celestial Group, True Botanicals Inc., Weleda and Yves Rocher
-
Market Research Insights
- The market's momentum is sustained by a holistic wellness approach, where consumer demand for ingredient-led marketing and personalized skincare solutions is paramount. The clean beauty movement is not just a trend but a standard, compelling brands to adopt sustainable product lifecycle strategies, which has been shown to boost consumer trust metrics by over 30%.
- The emphasis on brand authenticity and trust is leading to the adoption of farm-to-face sourcing models. This transparency aligns with conscious consumer values and drives ethical consumer choices, with brands demonstrating clear greenwashing-free claims seeing up to a 15% higher rate of repeat purchases.
- Furthermore, the push for a circular economy has resulted in a significant increase in the use of recycled materials, reducing packaging waste by an average of 25% for participating companies.
We can help! Our analysts can customize this natural and organic personal care product market research report to meet your requirements.
 RIA -
RIA - 
