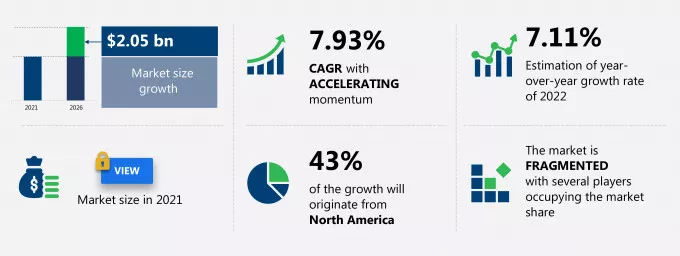
The naturally fermented food market share is expected to increase to USD 2.05 billion from 2021 to 2026, and the market's growth momentum will accelerate at a CAGR of 7.93%.
The report extensively covers naturally fermented food market segmentations by the folloeing:
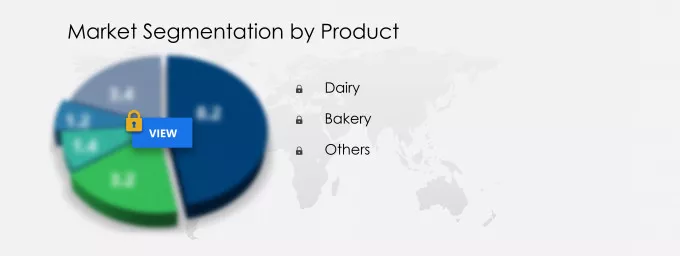
- Product - Dairy, bakery, and others
- Geography - North America, Europe, APAC, South America, and Middle East and Africa
The naturally fermented food market report offers information on several market vendors, including 3FBIO Ltd., BioGaia AB, Cargill Inc., Chr Hansen Holding AS, Chromologics, Conagra Brands Inc., Danone SA, Ferm Biotics, General Mills Inc., Health Ade LLC, International Flavors and Fragrances Inc., Kingdom Supercultures, Koninklijke DSM NV, Lifeway Foods Inc., Nestle SA, Perfect Day Inc., Probitat, Tetra Pak Group, The Kraft Heinz Co., and Barry Callebaut AG among others.
This naturally fermented food market research report provides valuable insights on the post COVID-19 impact on the market, which will help companies evaluate their business approaches.
What will the Naturally Fermented Food Market Size be During the Forecast Period?
Download the Free Report Sample to Unlock the Naturally Fermented Food Market Size for the Forecast Period and Other Important Statistics
"The growing aging population and health concerns are notably driving the North America fermented ingredient market growth."
Naturally Fermented Food Market: Key Drivers, Trends, and Challenges
The health benefits of naturally fermented food is notably driving the naturally fermented food market growth, although factors such as increasing popularity of artificial fermentation methods may impede market growth. Our research analysts have studied the historical data and deduced the key market drivers and the COVID-19 pandemic impact on the naturally fermented food industry. The holistic analysis of the drivers will help in deducing end goals and refining marketing strategies to gain a competitive edge.
Key Naturally Fermented Food Market Driver
- The health benefits of naturally fermented food is one of the key drivers supporting the naturally fermented food market growth.
- The consumption of naturally fermented food helps to improve gut health, which, in turn, strengthens the immune system.
- Healthy bacteria in the gut support immune system function by inhibiting the onset of autoimmune reactions and controlling specific cells of the immune system. The gut bacterium also affects hormones that regulate human metabolism. These hormones increase appetite, leading to overeating and subsequent weight gain.
- Fermented food helps in balancing the gut bacteria and limiting one appetite, which helps in improving metabolism. Hence, the inherent health benefits of naturally fermented food drive the growth of the market.
Key Naturally Fermented Food Market Trend
- Product launches and innovations is one of the key naturally fermented food market trends that is contributing to the market growth.
- Naturally fermented food has seen increased demand because of its inherent health benefits. Consumers are becoming increasingly aware of their specific health and metabolic advantage.
- Fermented food is produced both in developing and developed countries globally. However, the market has seen the introduction of new product categories.
- For instance, seaweeds are rich in the bioavailability of minerals that can be extracted through fermentation. Kelp is one such seaweed that has several medicinal implications, including those for targeting liver, stomach, and kidney problems.
- Fermenting seaweed releases minerals from cell walls and makes them easily absorbable. It is a source of prebiotics that promotes the growth of healthy bacteria for gastrointestinal health. Such product launches and innovations will propel the naturally fermented food market growth during the forecast period.
Key Naturally Fermented Food Market Challenge
- The increasing popularity of artificial fermentation methods is one of the factors hindering the naturally fermented food market growth.
- There are several alternatives to naturally fermented food.
- Artificial fermentation is one such method is adding artificial food additives. They are the substances that are added to food to retain its flavor, color, texture, appearance, and consistency.
- Natural and common additives are vinegar and salt, but, with the advent of technology, new additives such as artificial food coloring and texture and flavor enhancers for enhancing texture, color, smell, flavor, and shelf life have been developed. Thus, these alternatives can restrict the growth of the global naturally fermented food market during the forecast period.
This naturally fermented food market analysis report also provides detailed information on other upcoming trends and challenges that will have a far-reaching effect on the market growth. The actionable insights on the trends and challenges will help companies evaluate and develop growth strategies for 2022-2026.
Who are the Major Naturally Fermented Food Market Vendors?
The report analyzes the market's competitive landscape and offers information on several market vendors, including:
- 3FBIO Ltd.
- BioGaia AB
- Cargill Inc.
- Chr Hansen Holding AS
- Chromologics
- Conagra Brands Inc.
- Danone SA
- Ferm Biotics
- General Mills Inc.
- Health Ade LLC
- International Flavors and Fragrances Inc.
- Kingdom Supercultures
- Koninklijke DSM NV
- Lifeway Foods Inc.
- Nestle SA
- Perfect Day Inc.
- Probitat
- Tetra Pak Group
- The Kraft Heinz Co.
- Barry Callebaut AG
This statistical study of the naturally fermented food market encompasses successful business strategies deployed by the key vendors. The naturally fermented food market is fragmented and the vendors are deploying growth strategies such as price, quality, innovation, packaging, reputation, marketing channels, and even distribution to compete in the market.
Product Insights and News
- Barry Callebaut AG - The EMEA segment deals with the operations and sale of products in Europe, the Middle East, and Africa regions.
- Barry Callebaut AG - The company offers a natural fermentation process inspired by Belgian brewers for cocoa fermentation to improve the chocolate taste.
To make the most of the opportunities and recover from post COVID-19 impact, market vendors should focus more on the growth prospects in the fast-growing segments, while maintaining their positions in the slow-growing segments.
The naturally fermented food market forecast report offers in-depth insights into key vendor profiles. The profiles include information on the production, sustainability, and prospects of the leading companies.
Which are the Key Regions for Naturally Fermented Food Market?
For more insights on the market share of various regions Request for a FREE sample now!
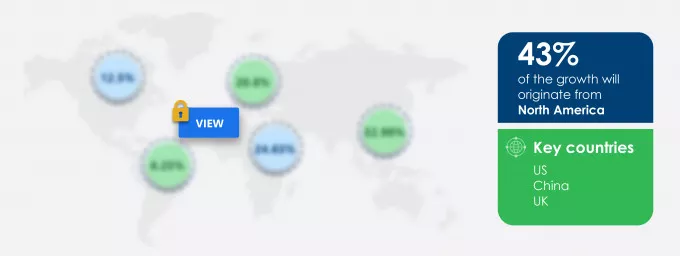
43% of the market's growth will originate from North America during the forecast period. The US is the key market for the naturally fermented food market in North America. Market growth in this region will be faster than the growth of the market in other regions.
Players launching sourdough bread will facilitate the naturally fermented food market growth in North America over the forecast period. This market research report entails detailed information on the competitive intelligence, marketing gaps, and regional opportunities in store for vendors, which will assist in creating efficient business plans.
COVID Impact and Recovery Analysis
In 2020, the outbreak of COVID-19 negatively impacted the naturally fermented food market in North America. However, with the initiation of vaccination drives in Q2 2021, the number of COVID-19 cases decreased in the region, which resulted in the resumption of industrial operations. Therefore, the market is expected to register significant growth during the forecast period.
What are the Revenue-generating Product Segments in the Naturally Fermented Food Market?
To gain further insights on the market contribution of various segments Request for a FREE sample
The naturally fermented food market share growth by the dairy segment will be significant during the forecast period. The consumer shift from homemade food preparation to purchases of partially or fully prepared food has increased cheese sales. Restaurant chains such as Pizza Hut, Taco Bell, and Dominos are further increasing the demand for cheese. Thus, the market for dairy products will witness an accelerating growth momentum due to innovations in yogurt and cheese products and the introduction of a variety of new dishes requiring cheese by restaurants. Such increasing demand for dairy products will boost the naturally fermented food market growth during the forecast period.
This report provides an accurate prediction of the contribution of all the segments to the growth of the naturally fermented food market size and actionable market insights on post COVID-19 impact on each segment.
Parent Market Analysis
Technavio categorizes the global naturally fermented food market as a part of the global packaged foods and meats market. Our research report has extensively covered external factors influencing the parent market growth potential in the coming years, which will determine the levels of growth of the naturally fermented food market during the forecast period.
Naturally Fermented Food Market Value Chain Analysis
Our report provides extensive information on the value chain analysis for the naturally fermented food market, which vendors can leverage to gain a competitive advantage during the forecast period. The end-to-end understanding of the value chain is essential in profit margin optimization and evaluation of business strategies. The data available in our value chain analysis segment can help vendors drive costs and enhance customer services during the forecast period.
|
Naturally Fermented Food Market Scope
|
|
Report Coverage
|
Details
|
|
Page number
|
120
|
|
Base year
|
2021
|
|
Forecast period
|
2022-2026
|
|
Growth momentum & CAGR
|
Accelerate at a CAGR of 7.93%
|
|
Market growth 2022-2026
|
$ 2.05 billion
|
|
Market structure
|
Fragmented
|
|
YoY growth (%)
|
7.11
|
|
Regional analysis
|
North America, Europe, APAC, South America, and Middle East and Africa
|
|
Performing market contribution
|
North America at 43%
|
|
Key consumer countries
|
US, China, UK, Germany, and Brazil
|
|
Competitive landscape
|
Leading companies, Competitive strategies, Consumer engagement scope
|
|
Key companies profiled
|
3FBIO Ltd., BioGaia AB, Cargill Inc., Chr Hansen Holding AS, Chromologics, Conagra Brands Inc., Danone SA, Ferm Biotics, General Mills Inc., Health Ade LLC, International Flavors and Fragrances Inc., Kingdom Supercultures, Koninklijke DSM NV, Lifeway Foods Inc., Nestle SA, Perfect Day Inc., Probitat, Tetra Pak Group, The Kraft Heinz Co., and Barry Callebaut AG
|
|
Market dynamics
|
Parent market analysis, Market growth inducers and obstacles, Fast-growing and slow-growing segment analysis, COVID 19 impact and recovery analysis and future consumer dynamics, Market condition analysis for forecast period
|
|
Customization purview
|
If our report has not included the data that you are looking for, you can reach out to our analysts and get segments customized.
|
Request for a FREE sample
What are the Key Data Covered in this Naturally Fermented Food Market Report?
- CAGR of the market during the forecast period 2022-2026
- Detailed information on factors that will drive naturally fermented food market growth during the next five years
- Precise estimation of the naturally fermented food market size and its contribution to the parent market
- Accurate predictions on upcoming trends and changes in consumer behavior
- The growth of the naturally fermented food industry across North America, Europe, APAC, South America, and Middle East and Africa
- A thorough analysis of the market's competitive landscape and detailed information on vendors
- Comprehensive details of factors that will challenge the growth of naturally fermented food market vendors
We can help! Our analysts can customize this report to meet your requirements. Get in touch
1 Executive Summary
- 1.1 Market overview
- Exhibit 01: Executive Summary – Chart on Market Overview
- Exhibit 02: Executive Summary – Data Table on Market Overview
- Exhibit 03: Executive Summary – Chart on Global Market Characteristics
- Exhibit 04: Executive Summary – Chart on Market by Geography
- Exhibit 05: Executive Summary – Chart on Market Segmentation by Product
- Exhibit 06: Executive Summary – Chart on Incremental Growth
- Exhibit 07: Executive Summary – Data Table on Incremental Growth
- Exhibit 08: Executive Summary – Chart on Vendor Market Positioning
2 Market Landscape
- 2.1 Market ecosystem
- Exhibit 09: Parent market
- Exhibit 10: Market Characteristics
3 Market Sizing
- 3.1 Market definition
- Exhibit 11: Offerings of vendors included in the market definition
- 3.2 Market segment analysis
- Exhibit 12: Market segments
- 3.4 Market outlook: Forecast for 2021-2026
- Exhibit 13: Chart on Global - Market size and forecast 2021-2026 ($ million)
- Exhibit 14: Data Table on Global - Market size and forecast 2021-2026 ($ million)
- Exhibit 15: Chart on Global Market: Year-over-year growth 2021-2026 (%)
- Exhibit 16: Data Table on Global Market: Year-over-year growth 2021-2026 (%)
4 Five Forces Analysis
- 4.1 Five forces summary
- Exhibit 17: Five forces analysis - Comparison between2021 and 2026
- 4.2 Bargaining power of buyers
- Exhibit 18: Chart on Bargaining power of buyers – Impact of key factors 2021 and 2026
- 4.3 Bargaining power of suppliers
- Exhibit 19: Bargaining power of suppliers – Impact of key factors in 2021 and 2026
- 4.4 Threat of new entrants
- Exhibit 20: Threat of new entrants – Impact of key factors in 2021 and 2026
- 4.5 Threat of substitutes
- Exhibit 21: Threat of substitutes – Impact of key factors in 2021 and 2026
- 4.6 Threat of rivalry
- Exhibit 22: Threat of rivalry – Impact of key factors in 2021 and 2026
- 4.7 Market condition
- Exhibit 23: Chart on Market condition - Five forces 2021 and 2026
5 Market Segmentation by Product
- 5.1 Market segments
- Exhibit 24: Chart on Product - Market share 2021-2026 (%)
- Exhibit 25: Data Table on Product - Market share 2021-2026 (%)
- 5.2 Comparison by Product
- Exhibit 26: Chart on Comparison by Product
- Exhibit 27: Data Table on Comparison by Product
- 5.3 Dairy - Market size and forecast 2021-2026
- Exhibit 28: Chart on Dairy - Market size and forecast 2021-2026 ($ million)
- Exhibit 29: Data Table on Dairy - Market size and forecast 2021-2026 ($ million)
- Exhibit 30: Chart on Dairy - Year-over-year growth 2021-2026 (%)
- Exhibit 31: Data Table on Dairy - Year-over-year growth 2021-2026 (%)
- 5.4 Bakery - Market size and forecast 2021-2026
- Exhibit 32: Chart on Bakery - Market size and forecast 2021-2026 ($ million)
- Exhibit 33: Data Table on Bakery - Market size and forecast 2021-2026 ($ million)
- Exhibit 34: Chart on Bakery - Year-over-year growth 2021-2026 (%)
- Exhibit 35: Data Table on Bakery - Year-over-year growth 2021-2026 (%)
- 5.5 Others - Market size and forecast 2021-2026
- Exhibit 36: Chart on Others - Market size and forecast 2021-2026 ($ million)
- Exhibit 37: Data Table on Others - Market size and forecast 2021-2026 ($ million)
- Exhibit 38: Chart on Others - Year-over-year growth 2021-2026 (%)
- Exhibit 39: Data Table on Others - Year-over-year growth 2021-2026 (%)
- 5.6 Market opportunity by Product
- Exhibit 40: Market opportunity by Product ($ million)
6 Customer Landscape
- 6.1 Customer landscape overview
- Exhibit 41: Analysis of price sensitivity, lifecycle, customer purchase basket, adoption rates, and purchase criteria
7 Geographic Landscape
- 7.1 Geographic segmentation
- Exhibit 42: Chart on Market share by geography 2021-2026 (%)
- Exhibit 43: Data Table on Market share by geography 2021-2026 (%)
- 7.2 Geographic comparison
- Exhibit 44: Chart on Geographic comparison
- Exhibit 45: Data Table on Geographic comparison
- 7.3 North America - Market size and forecast 2021-2026
- Exhibit 46: Chart on North America - Market size and forecast 2021-2026 ($ million)
- Exhibit 47: Data Table on North America - Market size and forecast 2021-2026 ($ million)
- Exhibit 48: Chart on North America - Year-over-year growth 2021-2026 (%)
- Exhibit 49: Data Table on North America - Year-over-year growth 2021-2026 (%)
- 7.4 Europe - Market size and forecast 2021-2026
- Exhibit 50: Chart on Europe - Market size and forecast 2021-2026 ($ million)
- Exhibit 51: Data Table on Europe - Market size and forecast 2021-2026 ($ million)
- Exhibit 52: Chart on Europe - Year-over-year growth 2021-2026 (%)
- Exhibit 53: Data Table on Europe - Year-over-year growth 2021-2026 (%)
- 7.5 APAC - Market size and forecast 2021-2026
- Exhibit 54: Chart on APAC - Market size and forecast 2021-2026 ($ million)
- Exhibit 55: Data Table on APAC - Market size and forecast 2021-2026 ($ million)
- Exhibit 56: Chart on APAC - Year-over-year growth 2021-2026 (%)
- Exhibit 57: Data Table on APAC - Year-over-year growth 2021-2026 (%)
- 7.6 South America - Market size and forecast 2021-2026
- Exhibit 58: Chart on South America - Market size and forecast 2021-2026 ($ million)
- Exhibit 59: Data Table on South America - Market size and forecast 2021-2026 ($ million)
- Exhibit 60: Chart on South America - Year-over-year growth 2021-2026 (%)
- Exhibit 61: Data Table on South America - Year-over-year growth 2021-2026 (%)
- 7.7 Middle East and Africa - Market size and forecast 2021-2026
- Exhibit 62: Chart on Middle East and Africa - Market size and forecast 2021-2026 ($ million)
- Exhibit 63: Data Table on Middle East and Africa - Market size and forecast 2021-2026 ($ million)
- Exhibit 64: Chart on Middle East and Africa - Year-over-year growth 2021-2026 (%)
- Exhibit 65: Data Table on Middle East and Africa - Year-over-year growth 2021-2026 (%)
- 7.8 US - Market size and forecast 2021-2026
- Exhibit 66: Chart on US - Market size and forecast 2021-2026 ($ million)
- Exhibit 67: Data Table on US - Market size and forecast 2021-2026 ($ million)
- Exhibit 68: Chart on US - Year-over-year growth 2021-2026 (%)
- Exhibit 69: Data Table on US - Year-over-year growth 2021-2026 (%)
- 7.9 UK - Market size and forecast 2021-2026
- Exhibit 70: Chart on UK - Market size and forecast 2021-2026 ($ million)
- Exhibit 71: Data Table on UK - Market size and forecast 2021-2026 ($ million)
- Exhibit 72: Chart on UK - Year-over-year growth 2021-2026 (%)
- Exhibit 73: Data Table on UK - Year-over-year growth 2021-2026 (%)
- 7.10 China - Market size and forecast 2021-2026
- Exhibit 74: Chart on China - Market size and forecast 2021-2026 ($ million)
- Exhibit 75: Data Table on China - Market size and forecast 2021-2026 ($ million)
- Exhibit 76: Chart on China - Year-over-year growth 2021-2026 (%)
- Exhibit 77: Data Table on China - Year-over-year growth 2021-2026 (%)
- 7.11 Brazil - Market size and forecast 2021-2026
- Exhibit 78: Chart on Brazil - Market size and forecast 2021-2026 ($ million)
- Exhibit 79: Data Table on Brazil - Market size and forecast 2021-2026 ($ million)
- Exhibit 80: Chart on Brazil - Year-over-year growth 2021-2026 (%)
- Exhibit 81: Data Table on Brazil - Year-over-year growth 2021-2026 (%)
- 7.12 Germany - Market size and forecast 2021-2026
- Exhibit 82: Chart on Germany - Market size and forecast 2021-2026 ($ million)
- Exhibit 83: Data Table on Germany - Market size and forecast 2021-2026 ($ million)
- Exhibit 84: Chart on Germany - Year-over-year growth 2021-2026 (%)
- Exhibit 85: Data Table on Germany - Year-over-year growth 2021-2026 (%)
- 7.13 Market opportunity by geography
- Exhibit 86: Market opportunity by geography ($ million)
8 Drivers, Challenges, and Trends
- 8.3 Impact of drivers and challenges
- Exhibit 87: Impact of drivers and challenges in 2021 and 2026
9 Vendor Landscape
- 9.2 Vendor landscape
- Exhibit 88: Overview on Criticality of inputs and Factors of differentiation
- 9.3 Landscape disruption
- Exhibit 89: Overview on factors of disruption
- 9.4 Industry risks
- Exhibit 90: Impact of key risks on business
10 Vendor Analysis
- 10.1 Vendors covered
- Exhibit 91: Vendors covered
- 10.2 Market positioning of vendors
- Exhibit 92: Matrix on vendor position and classification
- 10.3 Barry Callebaut AG
- Exhibit 93: Barry Callebaut AG - Overview
- Exhibit 94: Barry Callebaut AG - Business segments
- Exhibit 95: Barry Callebaut AG - Key news
- Exhibit 96: Barry Callebaut AG - Key offerings
- Exhibit 97: Barry Callebaut AG - Segment focus
- 10.4 BioGaia AB
- Exhibit 98: BioGaia AB - Overview
- Exhibit 99: BioGaia AB - Product / Service
- Exhibit 100: BioGaia AB - Key news
- Exhibit 101: BioGaia AB - Key offerings
- 10.5 Cargill Inc.
- Exhibit 102: Cargill Inc. - Overview
- Exhibit 103: Cargill Inc. - Product / Service
- Exhibit 104: Cargill Inc. - Key news
- Exhibit 105: Cargill Inc. - Key offerings
- 10.6 Chr Hansen Holding AS
- Exhibit 106: Chr Hansen Holding AS - Overview
- Exhibit 107: Chr Hansen Holding AS - Business segments
- Exhibit 108: Chr Hansen Holding AS - Key news
- Exhibit 109: Chr Hansen Holding AS - Key offerings
- Exhibit 110: Chr Hansen Holding AS - Segment focus
- 10.7 Conagra Brands Inc.
- Exhibit 111: Conagra Brands Inc. - Overview
- Exhibit 112: Conagra Brands Inc. - Business segments
- Exhibit 113: Conagra Brands Inc. - Key news
- Exhibit 114: Conagra Brands Inc. - Key offerings
- Exhibit 115: Conagra Brands Inc. - Segment focus
- 10.8 Danone SA
- Exhibit 116: Danone SA - Overview
- Exhibit 117: Danone SA - Business segments
- Exhibit 118: Danone SA - Key news
- Exhibit 119: Danone SA - Key offerings
- Exhibit 120: Danone SA - Segment focus
- 10.9 General Mills Inc.
- Exhibit 121: General Mills Inc. - Overview
- Exhibit 122: General Mills Inc. - Business segments
- Exhibit 123: General Mills Inc. - Key offerings
- Exhibit 124: General Mills Inc. - Segment focus
- 10.10 Koninklijke DSM NV
- Exhibit 125: Koninklijke DSM NV - Overview
- Exhibit 126: Koninklijke DSM NV - Business segments
- Exhibit 127: Koninklijke DSM NV - Key news
- Exhibit 128: Koninklijke DSM NV - Key offerings
- Exhibit 129: Koninklijke DSM NV - Segment focus
- 10.11 Nestle SA
- Exhibit 130: Nestle SA - Overview
- Exhibit 131: Nestle SA - Business segments
- Exhibit 132: Nestle SA - Key news
- Exhibit 133: Nestle SA - Key offerings
- Exhibit 134: Nestle SA - Segment focus
- 10.12 The Kraft Heinz Co.
- Exhibit 135: The Kraft Heinz Co. - Overview
- Exhibit 136: The Kraft Heinz Co. - Business segments
- Exhibit 137: The Kraft Heinz Co. - Key offerings
- Exhibit 138: The Kraft Heinz Co. - Segment focus
11 Appendix
- 11.2 Inclusions and exclusions checklist
- Exhibit 139: Inclusions checklist
- Exhibit 140: Exclusions checklist
- 11.3 Currency conversion rates for US$
- Exhibit 141: Currency conversion rates for US$
- 11.4 Research methodology
- Exhibit 142: Research methodology
- Exhibit 143: Validation techniques employed for market sizing
- Exhibit 144: Information sources
- 11.5 List of abbreviations
- Exhibit 145: List of abbreviations
- food allergy among consumers: There is an increase in the number of people suffering from food allergies globally. Food allergy is caused when the immune system reacts to the ingestion of certain foods. Ingredients of packaged foods and meats that can create allergic reactions in some people include (but are not limited to) milk, eggs, fish, crustacean shellfish (e.g., crab, lobster, and shrimp), tree nuts (e.g., almonds, walnuts, and pecan), peanuts, wheat, and soybeans. Even consumption of small amounts of food allergens can trigger signs and symptoms such as digestive problems, hives, and swollen airways. In some people, a food allergy can cause severe symptoms, or even a life-threatening reaction is, known as anaphylaxis. For example, in the US, nearly 3% of the adult population suffers from shellfish allergy.


