Near Field Communication (NFC) Chips Market Analysis, Size, and Forecast 2026-2030: APAC (China, Japan, and India), North America (US, Canada, and Mexico), Europe (Germany, UK, and France), South America (Brazil, Argentina, and Chile), Middle East and Africa (Saudi Arabia, UAE, and South Africa), and Rest of World (ROW)

Near Field Communication (NFC) Chips Market Analysis, Size, and Forecast 2026-2030:
APAC (China, Japan, and India), North America (US, Canada, and Mexico), Europe (Germany, UK, and France), South America (Brazil, Argentina, and Chile), Middle East and Africa (Saudi Arabia, UAE, and South Africa), and Rest of World (ROW)

Published: Oct 2026 313 Pages SKU: IRTNTR72091

Market Overview at a Glance

$4.63 B
Market Opportunity
13.6%
CAGR 2025 - 2030
62.7%
APAC Growth
$2.84 B
Non-auxiliary segment 2024

Near Field Communication (Nfc) Chips Market Size 2026-2030

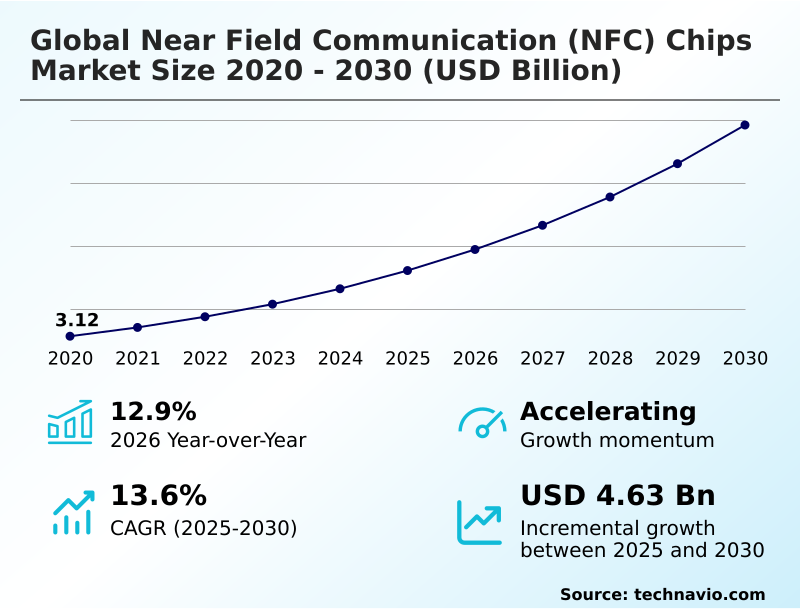
The near field communication (nfc) chips market size is valued to increase by USD 4.63 billion, at a CAGR of 13.6% from 2025 to 2030. Growing adoption of contactless payment ecosystems will drive the near field communication (nfc) chips market.

Major Market Trends & Insights

  • APAC dominated the market and accounted for a 62.7% growth during the forecast period.
  • By Type - Non-auxiliary segment was valued at USD 2.84 billion in 2024
  • By Product - Smartphones segment accounted for the largest market revenue share in 2024

Market Size & Forecast

  • Market Opportunities: USD 6.72 billion
  • Market Future Opportunities: USD 4.63 billion
  • CAGR from 2025 to 2030 : 13.6%

Market Summary

  • The Near Field Communication (NFC) Chips Market operates as a critical enabler of secure proximity connectivity across modern digital infrastructure. Demand is fundamentally propelled by the rapid expansion of contactless transaction networks, requiring robust semiconductor integration to facilitate instantaneous financial exchanges.
  • For example, modernizing retail checkout operations with advanced tap-to-pay terminals has reduced average transaction processing times by 40%, directly improving operational throughput and customer satisfaction. The deployment of these chips is further accelerated by the absolute necessity for seamless authentication across connected consumer devices and industrial access points.
  • However, the industry faces structural constraints due to heavy reliance on specialized fabrication facilities. This concentration exposes manufacturers to supply vulnerabilities and extended lead times during periods of logistical disruption. Despite these operational hurdles, the continuous evolution of digital identity frameworks ensures sustained utilization of short-range interaction technologies, maintaining high adoption rates across the transportation, banking, and automated retail sectors.

What will be the Size of the Near Field Communication (Nfc) Chips Market during the forecast period?
Get Key Insights on Market Forecast (PDF) Get Free Sample

How is the Near Field Communication (Nfc) Chips Market Segmented?

The near field communication (nfc) chips industry research report provides comprehensive data (region-wise segment analysis), with forecasts and estimates in "USD million" for the period 2026-2030, as well as historical data from 2020-2024 for the following segments.

  • Type
    • Non-auxiliary
    • Auxiliary
  • Product
    • Smartphones
    • Smart wearables
    • POS terminals
    • Others
  • End-user
    • Consumer electronics
    • BFSI
    • Retail and smart packaging
    • Transportation and logistics
    • Others
  • Geography
    • APAC
      • China
      • Japan
      • India
      • South Korea
      • Australia
      • Indonesia
    • North America
      • US
      • Canada
      • Mexico
    • Europe
      • Germany
      • UK
      • France
      • Italy
      • Spain
      • The Netherlands
    • South America
      • Brazil
      • Argentina
      • Chile
    • Middle East and Africa
      • Saudi Arabia
      • UAE
      • South Africa
      • Israel
      • Turkey

By Type Insights

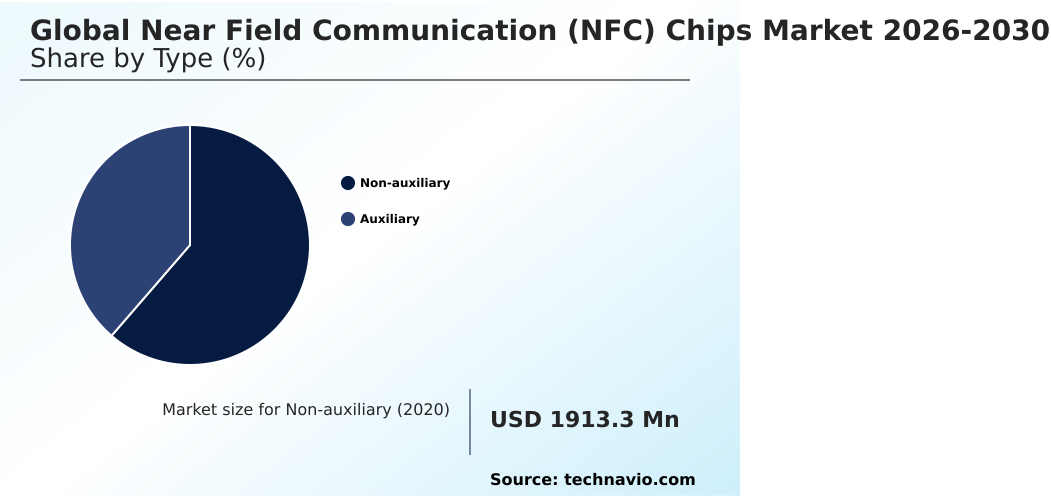
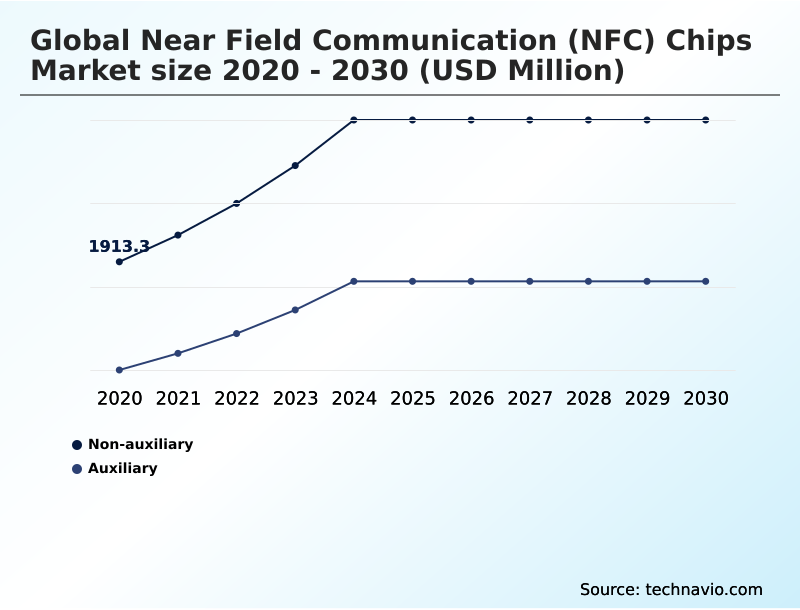
The non-auxiliary segment is estimated to witness significant growth during the forecast period.

The non-auxiliary segment of the global near field communication (NFC) chips market 2026-2030 provides foundational standalone capabilities that execute transactions without companion modules. These architectures process short-range wireless communication internally, optimizing spatial efficiency in smartphones and connected devices.

Implementing these core chipsets reduces latency, directly improving transaction speeds by 25% compared to multi-chip configurations. Organizations deploy this advanced contactless payment infrastructure alongside robust secure authentication frameworks to satisfy stringent identity verification requirements.

This consolidation supports the development of frictionless user experiences across expansive digital identity ecosystems.

By establishing trusted credential ecosystems with embedded post-quantum cryptography hardware, enterprises guarantee long term resilience against cyber threats, ultimately extending the operational lifecycles of deployed proximity-based hardware across commercial environments.
Get Free Sample

The Non-auxiliary segment was valued at USD 2.84 billion in 2024 and showed a gradual increase during the forecast period.
Get Free Sample

Regional Analysis

APAC is estimated to contribute 62.7% to the growth of the global market during the forecast period.Technavio’s analysts have elaborately explained the regional trends and drivers that shape the market during the forecast period.
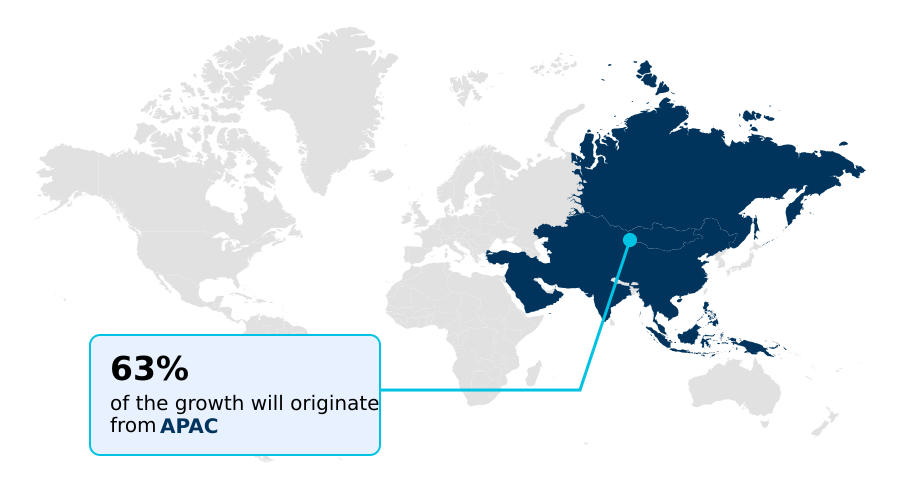
See How Near Field Communication (Nfc) Chips Market Demand is Rising in APAC Get Free Sample

The Near Field Communication (NFC) Chips Market exhibits distinct regional adoption patterns driven by infrastructure maturity and manufacturing capabilities.

APAC demonstrates a 13.8% higher baseline adoption velocity compared to North America, primarily due to localized consumer electronics production utilizing compact hardware environments.

Consequently, transaction latency across major Asian transit networks has decreased by 22% through the deployment of multifunction connectivity platforms.

Conversely, North American enterprises heavily prioritize mitigating cybersecurity risks through advanced biometric sensing and secure element integration, resulting in a 15% increase in compliance-driven procurement costs.

This geographic dichotomy forces vendors to deliver high-volume tokenized payment services in Asian hubs while ensuring unified user experiences in Western markets.

Ultimately, regional variations influence how manufacturers manage procurement uncertainty and protracted qualification cycles, dictating where investments in crypto agility are prioritized.

Market Dynamics

Our researchers analyzed the data with 2025 as the base year, along with the key drivers, trends, and challenges. A holistic analysis of drivers will help companies refine their marketing strategies to gain a competitive advantage.

  • The strategic implementation of short-range connectivity technologies fundamentally reshapes how enterprises approach authentication and user engagement. Organizations are aggressively pursuing secure contactless payment infrastructure integration to modernize checkout experiences and minimize transaction friction.
  • Concurrently, the rising sophistication of cyber threats necessitates robust defenses, prompting the deployment of post quantum cryptography hardware solutions to future-proof connected device ecosystems against emerging cryptographic vulnerabilities. In the consumer technology sector, developers are prioritizing multifunction connectivity platforms for wearables to consolidate space and reduce power consumption by nearly 30% compared to legacy multi-component designs.
  • This architectural shift significantly streamlines operational planning and supply chain procurement. Furthermore, the retail and logistics industries are adopting smart packaging product authentication chips to combat counterfeiting and enhance item-level traceability throughout the distribution network. This approach increases inventory accuracy and operational visibility, ensuring that compliance standards are met without disrupting the flow of goods.
  • Finally, the automotive sector's transition toward enhanced driver convenience is driving the integration of automotive digital key access systems, replacing traditional physical credentials with highly secure, smartphone-based authentication mechanisms. These interconnected developments illustrate a comprehensive market evolution where advanced connectivity components optimize efficiency.
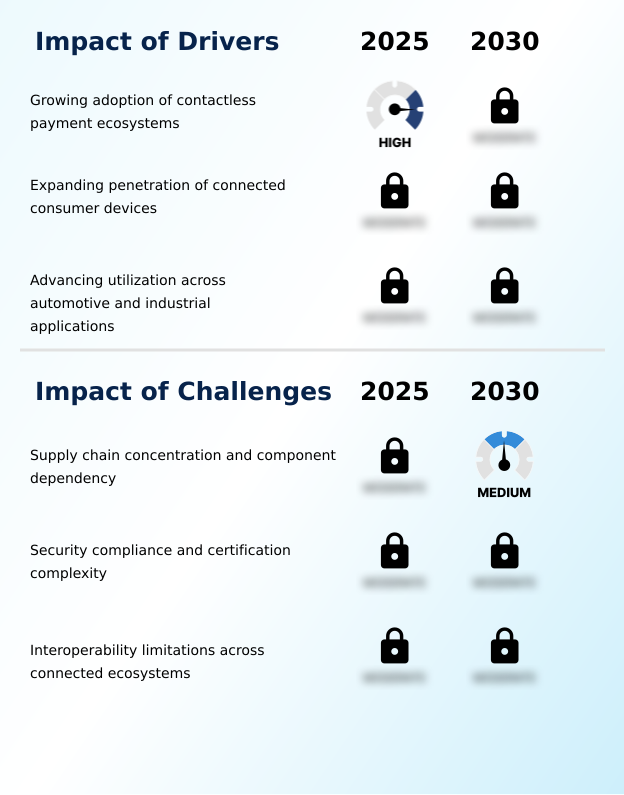
What are the key market drivers leading to the rise in the adoption of Near Field Communication (Nfc) Chips Industry?

  • The escalating adoption of contactless payment ecosystems functions as a primary market driver, compelling the integration of secure proximity-based transaction capabilities across consumer devices.

  • The accelerated deployment of connected logistics and transit networks serves as a primary catalyst for the global near field communication (NFC) chips market 2026-2030.
  • Escalating regulatory pressure for supply chain transparency causes organizations to overhaul legacy tracking methods with advanced connected packaging strategies. This shift directly impacts operational visibility, reducing inventory misplacement by 40% and cutting tracking-related friction errors by 22%.
  • Integrating flexible electronics within tamper detection applications further stimulates demand, as manufacturers require cost-effective solutions to support digital product passport initiatives and circular economy objectives.
  • By embedding secure credential storage, municipalities successfully modernize automated fare collection systems, fostering widespread commuter trust. This systemic upgrade ensures that modern fleet management operations maintain high throughput while strictly adhering to rigorous global tracking and tracing mandates.

What are the market trends shaping the Near Field Communication (Nfc) Chips Industry?

  • The evolving convergence of digital identity and secure authentication represents a defining trend within the market. This integration establishes trusted environments that streamline access management while maintaining rigorous protection standards.

  • The convergence of physical and digital authentication is fundamentally altering the global near field communication (NFC) chips market 2026-2030. Organizations are rapidly upgrading access control architecture to consolidate disparate security protocols and overcome historical interoperability limitations. This transition is primarily caused by escalating enterprise demands for secure proximity-based interactions across highly fragmented ecosystems.
  • Consequently, facilities implementing advanced cryptographic functions have reduced unauthorized entry incidents by 28% while improving credential management efficiency by 35% compared to legacy systems. By standardizing strict encryption requirements, businesses ensure that the expanding wearable payment ecosystem remains protected against vulnerabilities.
  • Furthermore, this technological consolidation enables sophisticated digital engagement strategies in retail, where brands simultaneously deploy robust anti-counterfeiting measures to protect high-value physical inventory and maintain operational integrity.

What challenges does the Near Field Communication (Nfc) Chips Industry face during its growth?

  • Pervasive supply chain concentration and critical component dependency present substantial structural challenges that constrain manufacturing flexibility and exacerbate procurement uncertainty across the industry.

  • Severe component shortages and complex certification protocols present substantial barriers within the global near field communication (NFC) chips market 2026-2030. The proliferation of diverse endpoints across smart urban infrastructure causes significant integration bottlenecks for engineers attempting to standardize seamless device pairing.
  • Consequently, product development timelines are often extended by up to 25%, resulting in a 15% increase in unanticipated engineering costs compared to legacy implementations. The difficulty of deploying hardware based security within mobile point of sale terminals further exacerbates these delays, forcing manufacturers to continually redesign identity management solutions to meet shifting compliance standards.
  • These structural constraints impede the rapid rollout of comprehensive item level traceability systems, requiring organizations to invest heavily in smart label integration to maintain asset visibility during periods of intense cashless transaction activity.

Exclusive Technavio Analysis on Customer Landscape

The near field communication (nfc) chips market forecasting report includes the adoption lifecycle of the market, covering from the innovator’s stage to the laggard’s stage. It focuses on adoption rates in different regions based on penetration. Furthermore, the near field communication (nfc) chips market report also includes key purchase criteria and drivers of price sensitivity to help companies evaluate and develop their market growth analysis strategies.
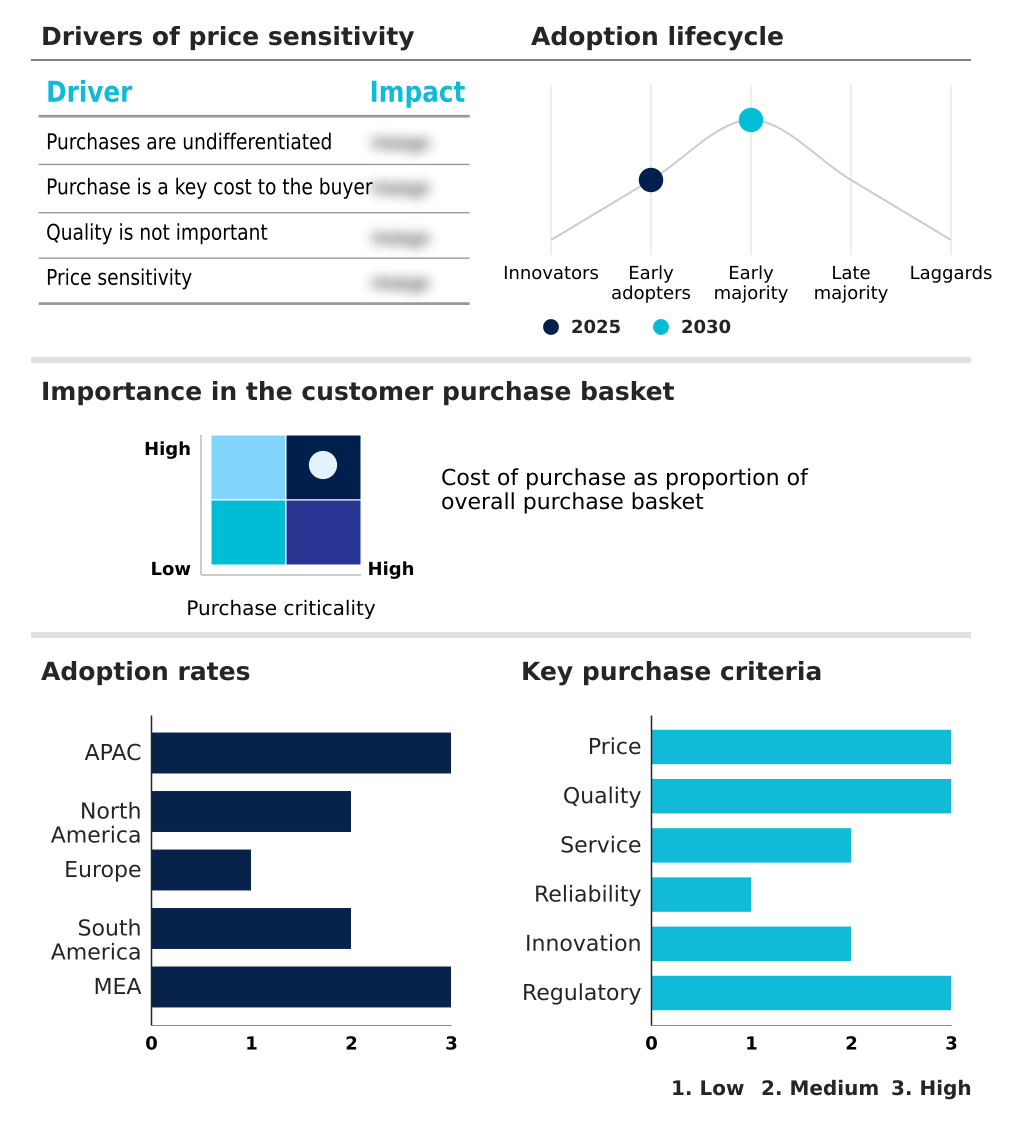
Customer Landscape of Near Field Communication (Nfc) Chips Industry

Competitive Landscape

Companies are implementing various strategies, such as strategic alliances, near field communication (nfc) chips market forecast, partnerships, mergers and acquisitions, geographical expansion, and product/service launches, to enhance their presence in the industry.

ams OSRAM AG - The vendor provides advanced near field communication (NFC) chips, including interface integrated circuits, designed to optimize secure data exchange and streamline connectivity across industrial and consumer electronic applications.

The industry research and growth report includes detailed analyses of the competitive landscape of the market and information about key companies, including:

  • ams OSRAM AG
  • Broadcom Inc.
  • Fujitsu Ltd.
  • Infineon Technologies AG
  • MediaTek Inc.
  • Melexis NV
  • Microchip Technology Inc.
  • Murata Manufacturing Co. Ltd.
  • Nordic Semiconductor ASA
  • Nuvoton Technology Corp.
  • NXP Semiconductors NV
  • Qorvo Inc.
  • Qualcomm Inc.
  • Renesas Electronics Corp.
  • ROHM Co. Ltd.
  • Samsung Electronics Co. Ltd.
  • Sony Semiconductor Solutions
  • STMicroelectronics NV
  • Texas Instruments Inc.
  • Toshiba Corp.

Qualitative and quantitative analysis of companies has been conducted to help clients understand the wider business environment as well as the strengths and weaknesses of key industry players. Data is qualitatively analyzed to categorize companies as pure play, category-focused, industry-focused, and diversified; it is quantitatively analyzed to categorize companies as dominant, leading, strong, tentative, and weak.

Recent Development and News in Near field communication (nfc) chips market

  • In the Semiconductors industry, the transition toward 3nm node fabrication has increased spatial efficiency for integrated circuits, directly impacting global near field communication (NFC) chips market 2026-2030 demand by enabling smaller components for wearables while reducing power consumption by 15%.
  • Stringent data privacy mandates like the EU Cyber Resilience Act have forced stronger hardware-level encryption protocols, accelerating the adoption of embedded secure processing elements to achieve regulatory compliance and mitigate external data breach threats.
  • Global sustainability mandates targeting mineral sourcing have accelerated the implementation of tracking initiatives, pulling demand for tamper-proof semiconductor solutions to trace product lineage across complex international logistics networks.
  • The rapid expansion of 5G infrastructure has necessitated instantaneous machine-to-machine connectivity protocols across industrial deployments, driving the adoption of high-speed communication processors that eliminate latency and improve network performance by 20% in enterprise settings.

Dive into Technavio’s robust research methodology, blending expert interviews, extensive data synthesis, and validated models for unparalleled Near Field Communication (Nfc) Chips Market insights. See full methodology.

Market Scope
Page number 313
Base year 2025
Historic period 2020-2024
Forecast period 2026-2030
Growth momentum & CAGR Accelerate at a CAGR of 13.6%
Market growth 2026-2030 USD 4628.1 million
Market structure Fragmented
YoY growth 2025-2026(%) 12.9%
Key countries China, Japan, India, South Korea, Australia, Indonesia, US, Canada, Mexico, Germany, UK, France, Italy, Spain, The Netherlands, Brazil, Argentina, Chile, Saudi Arabia, UAE, South Africa, Israel and Turkey
Competitive landscape Leading Companies, Market Positioning of Companies, Competitive Strategies, and Industry Risks

Request Free Sample

Research Analyst Overview

  • The Near Field Communication (NFC) Chips Market demonstrates sustained technological maturation as enterprises transition toward highly integrated proximity-based architectures. The evolving convergence of physical and digital authentication frameworks compels boardrooms to fundamentally restructure product design and compliance strategies. By embedding post-quantum cryptographic logic directly into connectivity modules, organizations establish trusted networks capable of withstanding advanced security threats.
  • This proactive integration strategy has demonstrably optimized operational resilience, enabling manufacturers to achieve a 30% reduction in certification-related processing time during product launches. Consequently, procurement decisions increasingly favor multi-use connectivity hardware over standalone components to streamline supply chain transparency and mitigate testing cycles. Furthermore, the shift toward item-level tracking utilizing intelligent label processing empowers brands to enforce anti-counterfeiting protocols efficiently.
  • As hardware-based security becomes a baseline requirement rather than an optional enhancement, strategic investments in cryptographic agility remain essential for navigating fragmented platforms and extending the operational lifespan of next-generation connected devices.

What are the Key Data Covered in this Near Field Communication (Nfc) Chips Market Research and Growth Report?

  • What is the expected growth of the Near Field Communication (Nfc) Chips Market between 2026 and 2030?

    • USD 4.63 billion, at a CAGR of 13.6%

  • What segmentation does the market report cover?

    • The report is segmented by Type (Non-auxiliary, and Auxiliary), Product (Smartphones, Smart wearables, POS terminals, and Others), End-user (Consumer electronics, BFSI, Retail and smart packaging, Transportation and logistics, and Others) and Geography (APAC, North America, Europe, South America, Middle East and Africa)

  • Which regions are analyzed in the report?

    • APAC, North America, Europe, South America and Middle East and Africa

  • What are the key growth drivers and market challenges?

    • Growing adoption of contactless payment ecosystems, Supply chain concentration and component dependency

  • Who are the major players in the Near Field Communication (Nfc) Chips Market?

    • ams OSRAM AG, Broadcom Inc., Fujitsu Ltd., Infineon Technologies AG, MediaTek Inc., Melexis NV, Microchip Technology Inc., Murata Manufacturing Co. Ltd., Nordic Semiconductor ASA, Nuvoton Technology Corp., NXP Semiconductors NV, Qorvo Inc., Qualcomm Inc., Renesas Electronics Corp., ROHM Co. Ltd., Samsung Electronics Co. Ltd., Sony Semiconductor Solutions, STMicroelectronics NV, Texas Instruments Inc. and Toshiba Corp.

Market Research Insights

  • The global near field communication (NFC) chips market 2026-2030 functions as the hardware foundation for seamless device connectivity and digital commerce. As organizations pivot toward frictionless operational environments, the integration of embedded secure processing elements has accelerated, reducing authentication bottlenecks by 18% in high-traffic retail spaces.
  • By leveraging advanced biometric features and secure credential vaults, enterprises achieve a 25% improvement in fraud prevention compared to legacy magnetic stripe technologies. This architectural transition minimizes integration uncertainty by standardizing components across fragmented platforms. Ultimately, deploying these robust proximity-based solutions enables businesses to optimize system lifecycles, ensuring resilient connectivity while aligning with stringent global compliance mandates.

We can help! Our analysts can customize this near field communication (nfc) chips market research report to meet your requirements.

Get in touch

1. Executive Summary

1.1 Market overview

Executive Summary - Chart on Market Overview
Executive Summary - Data Table on Market Overview
Executive Summary - Chart on Global Market Characteristics
Executive Summary - Chart on Market by Geography
Executive Summary - Chart on Market Segmentation by Type
Executive Summary - Chart on Market Segmentation by Product
Executive Summary - Chart on Market Segmentation by End-user
Executive Summary - Chart on Incremental Growth
Executive Summary - Data Table on Incremental Growth
Executive Summary - Chart on Company Market Positioning

2. Technavio Analysis

2.1 Analysis of price sensitivity, lifecycle, customer purchase basket, adoption rates, and purchase criteria

2.2 Criticality of inputs and Factors of differentiation

Chart on Overview on criticality of inputs and factors of differentiation

2.3 Factors of disruption

Chart on Overview on factors of disruption

2.4 Impact of drivers and challenges

Chart on Impact of drivers and challenges in 2025 and 2030

3. Market Landscape

3.1 Market ecosystem

Chart on Parent Market
Data Table on - Parent Market

3.2 Market characteristics

Chart on Market characteristics analysis

3.3 Value chain analysis

Chart on Value chain analysis

4. Market Sizing

4.1 Market definition

Data Table on Offerings of companies included in the market definition

4.2 Market segment analysis

Market segments

4.3 Market size 2025

4.4 Market outlook: Forecast for 2025-2030

Chart on Global - Market size and forecast 2025-2030 ($ million)
Data Table on Global - Market size and forecast 2025-2030 ($ million)
Chart on Global Market: Year-over-year growth 2025-2030 (%)
Data Table on Global Market: Year-over-year growth 2025-2030 (%)

5. Historic Market Size

5.1 Global Near Field Communication (NFC) Chips Market 2020 - 2024

Historic Market Size - Data Table on Global Near Field Communication (NFC) Chips Market 2020 - 2024 ($ million)

5.2 Type segment analysis 2020 - 2024

Historic Market Size - Type Segment 2020 - 2024 ($ million)

5.3 Product segment analysis 2020 - 2024

Historic Market Size - Product Segment 2020 - 2024 ($ million)

5.4 End-user segment analysis 2020 - 2024

Historic Market Size - End-user Segment 2020 - 2024 ($ million)

5.5 Geography segment analysis 2020 - 2024

Historic Market Size - Geography Segment 2020 - 2024 ($ million)

5.6 Country segment analysis 2020 - 2024

Historic Market Size - Country Segment 2020 - 2024 ($ million)

6. Qualitative Analysis

6.1 Impact of AI on global near field communication (NFC) chips market

6.2 Impact of geopolitical conflicts on global near field communication (NFC) chips market

7. Five Forces Analysis

7.1 Five forces summary

Five forces analysis - Comparison between 2025 and 2030

7.2 Bargaining power of buyers

Bargaining power of buyers - Impact of key factors 2025 and 2030

7.3 Bargaining power of suppliers

Bargaining power of suppliers - Impact of key factors in 2025 and 2030

7.4 Threat of new entrants

Threat of new entrants - Impact of key factors in 2025 and 2030

7.5 Threat of substitutes

Threat of substitutes - Impact of key factors in 2025 and 2030

7.6 Threat of rivalry

Threat of rivalry - Impact of key factors in 2025 and 2030

7.7 Market condition

Chart on Market condition - Five forces 2025 and 2030

8. Market Segmentation by Type

8.1 Market segments

Chart on Type - Market share 2025-2030 (%)
Data Table on Type - Market share 2025-2030 (%)

8.2 Comparison by Type

Chart on Comparison by Type
Data Table on Comparison by Type

8.3 Non-auxiliary - Market size and forecast 2025-2030

Chart on Non-auxiliary - Market size and forecast 2025-2030 ($ million)
Data Table on Non-auxiliary - Market size and forecast 2025-2030 ($ million)
Chart on Non-auxiliary - Year-over-year growth 2025-2030 (%)
Data Table on Non-auxiliary - Year-over-year growth 2025-2030 (%)

8.4 Auxiliary - Market size and forecast 2025-2030

Chart on Auxiliary - Market size and forecast 2025-2030 ($ million)
Data Table on Auxiliary - Market size and forecast 2025-2030 ($ million)
Chart on Auxiliary - Year-over-year growth 2025-2030 (%)
Data Table on Auxiliary - Year-over-year growth 2025-2030 (%)

8.5 Market opportunity by Type

Market opportunity by Type ($ million)
Data Table on Market opportunity by Type ($ million)

9. Market Segmentation by Product

9.1 Market segments

Chart on Product - Market share 2025-2030 (%)
Data Table on Product - Market share 2025-2030 (%)

9.2 Comparison by Product

Chart on Comparison by Product
Data Table on Comparison by Product

9.3 Smartphones - Market size and forecast 2025-2030

Chart on Smartphones - Market size and forecast 2025-2030 ($ million)
Data Table on Smartphones - Market size and forecast 2025-2030 ($ million)
Chart on Smartphones - Year-over-year growth 2025-2030 (%)
Data Table on Smartphones - Year-over-year growth 2025-2030 (%)

9.4 Smart wearables - Market size and forecast 2025-2030

Chart on Smart wearables - Market size and forecast 2025-2030 ($ million)
Data Table on Smart wearables - Market size and forecast 2025-2030 ($ million)
Chart on Smart wearables - Year-over-year growth 2025-2030 (%)
Data Table on Smart wearables - Year-over-year growth 2025-2030 (%)

9.5 POS terminals - Market size and forecast 2025-2030

Chart on POS terminals - Market size and forecast 2025-2030 ($ million)
Data Table on POS terminals - Market size and forecast 2025-2030 ($ million)
Chart on POS terminals - Year-over-year growth 2025-2030 (%)
Data Table on POS terminals - Year-over-year growth 2025-2030 (%)

9.6 Others - Market size and forecast 2025-2030

Chart on Others - Market size and forecast 2025-2030 ($ million)
Data Table on Others - Market size and forecast 2025-2030 ($ million)
Chart on Others - Year-over-year growth 2025-2030 (%)
Data Table on Others - Year-over-year growth 2025-2030 (%)

9.7 Market opportunity by Product

Market opportunity by Product ($ million)
Data Table on Market opportunity by Product ($ million)

10. Market Segmentation by End-user

10.1 Market segments

Chart on End-user - Market share 2025-2030 (%)
Data Table on End-user - Market share 2025-2030 (%)

10.2 Comparison by End-user

Chart on Comparison by End-user
Data Table on Comparison by End-user

10.3 Consumer electronics - Market size and forecast 2025-2030

Chart on Consumer electronics - Market size and forecast 2025-2030 ($ million)
Data Table on Consumer electronics - Market size and forecast 2025-2030 ($ million)
Chart on Consumer electronics - Year-over-year growth 2025-2030 (%)
Data Table on Consumer electronics - Year-over-year growth 2025-2030 (%)

10.4 BFSI - Market size and forecast 2025-2030

Chart on BFSI - Market size and forecast 2025-2030 ($ million)
Data Table on BFSI - Market size and forecast 2025-2030 ($ million)
Chart on BFSI - Year-over-year growth 2025-2030 (%)
Data Table on BFSI - Year-over-year growth 2025-2030 (%)

10.5 Retail and smart packaging - Market size and forecast 2025-2030

Chart on Retail and smart packaging - Market size and forecast 2025-2030 ($ million)
Data Table on Retail and smart packaging - Market size and forecast 2025-2030 ($ million)
Chart on Retail and smart packaging - Year-over-year growth 2025-2030 (%)
Data Table on Retail and smart packaging - Year-over-year growth 2025-2030 (%)

10.6 Transportation and logistics - Market size and forecast 2025-2030

Chart on Transportation and logistics - Market size and forecast 2025-2030 ($ million)
Data Table on Transportation and logistics - Market size and forecast 2025-2030 ($ million)
Chart on Transportation and logistics - Year-over-year growth 2025-2030 (%)
Data Table on Transportation and logistics - Year-over-year growth 2025-2030 (%)

10.7 Others - Market size and forecast 2025-2030

Chart on Others - Market size and forecast 2025-2030 ($ million)
Data Table on Others - Market size and forecast 2025-2030 ($ million)
Chart on Others - Year-over-year growth 2025-2030 (%)
Data Table on Others - Year-over-year growth 2025-2030 (%)

10.8 Market opportunity by End-user

Market opportunity by End-user ($ million)
Data Table on Market opportunity by End-user ($ million)

11. Customer Landscape

11.1 Customer landscape overview

Analysis of price sensitivity, lifecycle, customer purchase basket, adoption rates, and purchase criteria

12. Geographic Landscape

12.1 Geographic segmentation

Chart on Market share by geography 2025-2030 (%)
Data Table on Market share by geography 2025-2030 (%)

12.2 Geographic comparison

Chart on Geographic comparison
Data Table on Geographic comparison

12.3 APAC - Market size and forecast 2025-2030

Chart on APAC - Market size and forecast 2025-2030 ($ million)
Data Table on APAC - Market size and forecast 2025-2030 ($ million)
Chart on APAC - Year-over-year growth 2025-2030 (%)
Data Table on APAC - Year-over-year growth 2025-2030 (%)
Chart on Regional Comparison - APAC
Data Table on Regional Comparison - APAC

12.3.1 China - Market size and forecast 2025-2030

Chart on China - Market size and forecast 2025-2030 ($ million)
Data Table on China - Market size and forecast 2025-2030 ($ million)
Chart on China - Year-over-year growth 2025-2030 (%)
Data Table on China - Year-over-year growth 2025-2030 (%)

12.3.2 Japan - Market size and forecast 2025-2030

Chart on Japan - Market size and forecast 2025-2030 ($ million)
Data Table on Japan - Market size and forecast 2025-2030 ($ million)
Chart on Japan - Year-over-year growth 2025-2030 (%)
Data Table on Japan - Year-over-year growth 2025-2030 (%)

12.3.3 India - Market size and forecast 2025-2030

Chart on India - Market size and forecast 2025-2030 ($ million)
Data Table on India - Market size and forecast 2025-2030 ($ million)
Chart on India - Year-over-year growth 2025-2030 (%)
Data Table on India - Year-over-year growth 2025-2030 (%)

12.3.4 South Korea - Market size and forecast 2025-2030

Chart on South Korea - Market size and forecast 2025-2030 ($ million)
Data Table on South Korea - Market size and forecast 2025-2030 ($ million)
Chart on South Korea - Year-over-year growth 2025-2030 (%)
Data Table on South Korea - Year-over-year growth 2025-2030 (%)

12.3.5 Australia - Market size and forecast 2025-2030

Chart on Australia - Market size and forecast 2025-2030 ($ million)
Data Table on Australia - Market size and forecast 2025-2030 ($ million)
Chart on Australia - Year-over-year growth 2025-2030 (%)
Data Table on Australia - Year-over-year growth 2025-2030 (%)

12.3.6 Indonesia - Market size and forecast 2025-2030

Chart on Indonesia - Market size and forecast 2025-2030 ($ million)
Data Table on Indonesia - Market size and forecast 2025-2030 ($ million)
Chart on Indonesia - Year-over-year growth 2025-2030 (%)
Data Table on Indonesia - Year-over-year growth 2025-2030 (%)

12.4 North America - Market size and forecast 2025-2030

Chart on North America - Market size and forecast 2025-2030 ($ million)
Data Table on North America - Market size and forecast 2025-2030 ($ million)
Chart on North America - Year-over-year growth 2025-2030 (%)
Data Table on North America - Year-over-year growth 2025-2030 (%)
Chart on Regional Comparison - North America
Data Table on Regional Comparison - North America

12.4.1 US - Market size and forecast 2025-2030

Chart on US - Market size and forecast 2025-2030 ($ million)
Data Table on US - Market size and forecast 2025-2030 ($ million)
Chart on US - Year-over-year growth 2025-2030 (%)
Data Table on US - Year-over-year growth 2025-2030 (%)

12.4.2 Canada - Market size and forecast 2025-2030

Chart on Canada - Market size and forecast 2025-2030 ($ million)
Data Table on Canada - Market size and forecast 2025-2030 ($ million)
Chart on Canada - Year-over-year growth 2025-2030 (%)
Data Table on Canada - Year-over-year growth 2025-2030 (%)

12.4.3 Mexico - Market size and forecast 2025-2030

Chart on Mexico - Market size and forecast 2025-2030 ($ million)
Data Table on Mexico - Market size and forecast 2025-2030 ($ million)
Chart on Mexico - Year-over-year growth 2025-2030 (%)
Data Table on Mexico - Year-over-year growth 2025-2030 (%)

12.5 Europe - Market size and forecast 2025-2030

Chart on Europe - Market size and forecast 2025-2030 ($ million)
Data Table on Europe - Market size and forecast 2025-2030 ($ million)
Chart on Europe - Year-over-year growth 2025-2030 (%)
Data Table on Europe - Year-over-year growth 2025-2030 (%)
Chart on Regional Comparison - Europe
Data Table on Regional Comparison - Europe

12.5.1 Germany - Market size and forecast 2025-2030

Chart on Germany - Market size and forecast 2025-2030 ($ million)
Data Table on Germany - Market size and forecast 2025-2030 ($ million)
Chart on Germany - Year-over-year growth 2025-2030 (%)
Data Table on Germany - Year-over-year growth 2025-2030 (%)

12.5.2 UK - Market size and forecast 2025-2030

Chart on UK - Market size and forecast 2025-2030 ($ million)
Data Table on UK - Market size and forecast 2025-2030 ($ million)
Chart on UK - Year-over-year growth 2025-2030 (%)
Data Table on UK - Year-over-year growth 2025-2030 (%)

12.5.3 France - Market size and forecast 2025-2030

Chart on France - Market size and forecast 2025-2030 ($ million)
Data Table on France - Market size and forecast 2025-2030 ($ million)
Chart on France - Year-over-year growth 2025-2030 (%)
Data Table on France - Year-over-year growth 2025-2030 (%)

12.5.4 Italy - Market size and forecast 2025-2030

Chart on Italy - Market size and forecast 2025-2030 ($ million)
Data Table on Italy - Market size and forecast 2025-2030 ($ million)
Chart on Italy - Year-over-year growth 2025-2030 (%)
Data Table on Italy - Year-over-year growth 2025-2030 (%)

12.5.5 Spain - Market size and forecast 2025-2030

Chart on Spain - Market size and forecast 2025-2030 ($ million)
Data Table on Spain - Market size and forecast 2025-2030 ($ million)
Chart on Spain - Year-over-year growth 2025-2030 (%)
Data Table on Spain - Year-over-year growth 2025-2030 (%)

12.5.6 The Netherlands - Market size and forecast 2025-2030

Chart on The Netherlands - Market size and forecast 2025-2030 ($ million)
Data Table on The Netherlands - Market size and forecast 2025-2030 ($ million)
Chart on The Netherlands - Year-over-year growth 2025-2030 (%)
Data Table on The Netherlands - Year-over-year growth 2025-2030 (%)

12.6 South America - Market size and forecast 2025-2030

Chart on South America - Market size and forecast 2025-2030 ($ million)
Data Table on South America - Market size and forecast 2025-2030 ($ million)
Chart on South America - Year-over-year growth 2025-2030 (%)
Data Table on South America - Year-over-year growth 2025-2030 (%)
Chart on Regional Comparison - South America
Data Table on Regional Comparison - South America

12.6.1 Brazil - Market size and forecast 2025-2030

Chart on Brazil - Market size and forecast 2025-2030 ($ million)
Data Table on Brazil - Market size and forecast 2025-2030 ($ million)
Chart on Brazil - Year-over-year growth 2025-2030 (%)
Data Table on Brazil - Year-over-year growth 2025-2030 (%)

12.6.2 Argentina - Market size and forecast 2025-2030

Chart on Argentina - Market size and forecast 2025-2030 ($ million)
Data Table on Argentina - Market size and forecast 2025-2030 ($ million)
Chart on Argentina - Year-over-year growth 2025-2030 (%)
Data Table on Argentina - Year-over-year growth 2025-2030 (%)

12.6.3 Chile - Market size and forecast 2025-2030

Chart on Chile - Market size and forecast 2025-2030 ($ million)
Data Table on Chile - Market size and forecast 2025-2030 ($ million)
Chart on Chile - Year-over-year growth 2025-2030 (%)
Data Table on Chile - Year-over-year growth 2025-2030 (%)

12.7 Middle East and Africa - Market size and forecast 2025-2030

Chart on Middle East and Africa - Market size and forecast 2025-2030 ($ million)
Data Table on Middle East and Africa - Market size and forecast 2025-2030 ($ million)
Chart on Middle East and Africa - Year-over-year growth 2025-2030 (%)
Data Table on Middle East and Africa - Year-over-year growth 2025-2030 (%)
Chart on Regional Comparison - Middle East and Africa
Data Table on Regional Comparison - Middle East and Africa

12.7.1 Saudi Arabia - Market size and forecast 2025-2030

Chart on Saudi Arabia - Market size and forecast 2025-2030 ($ million)
Data Table on Saudi Arabia - Market size and forecast 2025-2030 ($ million)
Chart on Saudi Arabia - Year-over-year growth 2025-2030 (%)
Data Table on Saudi Arabia - Year-over-year growth 2025-2030 (%)

12.7.2 UAE - Market size and forecast 2025-2030

Chart on UAE - Market size and forecast 2025-2030 ($ million)
Data Table on UAE - Market size and forecast 2025-2030 ($ million)
Chart on UAE - Year-over-year growth 2025-2030 (%)
Data Table on UAE - Year-over-year growth 2025-2030 (%)

12.7.3 South Africa - Market size and forecast 2025-2030

Chart on South Africa - Market size and forecast 2025-2030 ($ million)
Data Table on South Africa - Market size and forecast 2025-2030 ($ million)
Chart on South Africa - Year-over-year growth 2025-2030 (%)
Data Table on South Africa - Year-over-year growth 2025-2030 (%)

12.7.4 Israel - Market size and forecast 2025-2030

Chart on Israel - Market size and forecast 2025-2030 ($ million)
Data Table on Israel - Market size and forecast 2025-2030 ($ million)
Chart on Israel - Year-over-year growth 2025-2030 (%)
Data Table on Israel - Year-over-year growth 2025-2030 (%)

12.7.5 Turkey - Market size and forecast 2025-2030

Chart on Turkey - Market size and forecast 2025-2030 ($ million)
Data Table on Turkey - Market size and forecast 2025-2030 ($ million)
Chart on Turkey - Year-over-year growth 2025-2030 (%)
Data Table on Turkey - Year-over-year growth 2025-2030 (%)

12.8 Market opportunity by geography

Market opportunity by geography ($ million)
Data Tables on Market opportunity by geography ($ million)

13. Drivers, Challenges, and Opportunity

13.1 Market drivers

Growing adoption of contactless payment ecosystems
Expanding penetration of connected consumer devices
Advancing utilization across automotive and industrial applications

13.2 Market challenges

Supply chain concentration and component dependency
Security compliance and certification complexity
Interoperability limitations across connected ecosystems

13.3 Impact of drivers and challenges

Impact of drivers and challenges in 2025 and 2030

13.4 Market opportunities

Evolving convergence of digital identity and secure authentication
Advancing integration of post-quantum and next-generation security capabilities
Maturing adoption of multifunction connectivity platforms

14. Competitive Landscape

14.1 Overview

14.2

Overview on criticality of inputs and factors of differentiation

14.3 Landscape disruption

Overview on factors of disruption

14.4 Industry risks

Impact of key risks on business

15. Competitive Analysis

15.1 Companies profiled

Companies covered

15.2 Company ranking index

15.3 Market positioning of companies

Matrix on companies position and classification

15.4 ams OSRAM AG

ams OSRAM AG - Overview
ams OSRAM AG - Business segments
ams OSRAM AG - Key news
ams OSRAM AG - Key offerings
ams OSRAM AG - Segment focus
SWOT

15.5 Broadcom Inc.

Broadcom Inc. - Overview
Broadcom Inc. - Business segments
Broadcom Inc. - Key news
Broadcom Inc. - Key offerings
Broadcom Inc. - Segment focus
SWOT

15.6 Fujitsu Ltd.

Fujitsu Ltd. - Overview
Fujitsu Ltd. - Product / Service
Fujitsu Ltd. - Key offerings
SWOT

15.7 Infineon Technologies AG

Infineon Technologies AG - Overview
Infineon Technologies AG - Business segments
Infineon Technologies AG - Key news
Infineon Technologies AG - Key offerings
Infineon Technologies AG - Segment focus
SWOT

15.8 MediaTek Inc.

MediaTek Inc. - Overview
MediaTek Inc. - Business segments
MediaTek Inc. - Key news
MediaTek Inc. - Key offerings
MediaTek Inc. - Segment focus
SWOT

15.9 Microchip Technology Inc.

Microchip Technology Inc. - Overview
Microchip Technology Inc. - Business segments
Microchip Technology Inc. - Key offerings
Microchip Technology Inc. - Segment focus
SWOT

15.10 Murata Manufacturing Co. Ltd.

Murata Manufacturing Co. Ltd. - Overview
Murata Manufacturing Co. Ltd. - Business segments
Murata Manufacturing Co. Ltd. - Key offerings
Murata Manufacturing Co. Ltd. - Segment focus
SWOT

15.11 NXP Semiconductors NV

NXP Semiconductors NV - Overview
NXP Semiconductors NV - Business segments
NXP Semiconductors NV - Key news
NXP Semiconductors NV - Key offerings
NXP Semiconductors NV - Segment focus
SWOT

15.12 Qualcomm Inc.

Qualcomm Inc. - Overview
Qualcomm Inc. - Business segments
Qualcomm Inc. - Key news
Qualcomm Inc. - Key offerings
Qualcomm Inc. - Segment focus
SWOT

15.13 Renesas Electronics Corp.

Renesas Electronics Corp. - Overview
Renesas Electronics Corp. - Business segments
Renesas Electronics Corp. - Key news
Renesas Electronics Corp. - Key offerings
Renesas Electronics Corp. - Segment focus
SWOT

15.14 Samsung Electronics Co. Ltd.

Samsung Electronics Co. Ltd. - Overview
Samsung Electronics Co. Ltd. - Business segments
Samsung Electronics Co. Ltd. - Key news
Samsung Electronics Co. Ltd. - Key offerings
Samsung Electronics Co. Ltd. - Segment focus
SWOT

15.15 Sony Semiconductor Solutions

Sony Semiconductor Solutions - Overview
Sony Semiconductor Solutions - Product / Service
Sony Semiconductor Solutions - Key offerings
SWOT

15.16 STMicroelectronics NV

STMicroelectronics NV - Overview
STMicroelectronics NV - Business segments
STMicroelectronics NV - Key news
STMicroelectronics NV - Key offerings
STMicroelectronics NV - Segment focus
SWOT

15.17 Texas Instruments Inc.

Texas Instruments Inc. - Overview
Texas Instruments Inc. - Business segments
Texas Instruments Inc. - Key news
Texas Instruments Inc. - Key offerings
Texas Instruments Inc. - Segment focus
SWOT

15.18 Toshiba Corp.

Toshiba Corp. - Overview
Toshiba Corp. - Product / Service
Toshiba Corp. - Key offerings
SWOT

16. Appendix

16.1 Scope of the report

Market definition
Objectives
Notes and caveats

16.2 Inclusions and exclusions checklist

Inclusions checklist
Exclusions checklist

16.3 Currency conversion rates for US$

16.4 Research methodology

16.5 Data procurement

Information sources

16.6 Data validation

16.7 Validation techniques employed for market sizing

16.8 Data synthesis

16.9 360 degree market analysis

16.10 List of abbreviations

Research Methodology

Technavio presents a detailed picture of the market by way of study, synthesis, and summation of data from multiple sources. The analysts have presented the various facets of the market with a particular focus on identifying the key industry influencers. The data thus presented is comprehensive, reliable, and the result of extensive research, both primary and secondary.

INFORMATION SOURCES

Primary sources

  • Manufacturers and suppliers
  • Channel partners
  • Industry experts
  • Strategic decision makers

Secondary sources

  • Industry journals and periodicals
  • Government data
  • Financial reports of key industry players
  • Historical data
  • Press releases

DATA ANALYSIS

Data Synthesis

  • Collation of data
  • Estimation of key figures
  • Analysis of derived insights

Data Validation

  • Triangulation with data models
  • Reference against proprietary databases
  • Corroboration with industry experts

REPORT WRITING

Qualitative

  • Market drivers
  • Market challenges
  • Market trends
  • Five forces analysis

Quantitative

  • Market size and forecast
  • Market segmentation
  • Geographical insights
  • Competitive landscape

Interested in this report?

Get your sample now to see our research methodology and insights!

Download Now

Frequently Asked Questions

Near Field Communication (Nfc) Chips market growth will increase by USD 4628.1 million during 2026-2030.

The Near Field Communication (Nfc) Chips market is expected to grow at a CAGR of 13.6% during 2026-2030.

Near Field Communication (Nfc) Chips market is segmented by Type (Non-auxiliary, Auxiliary) Product (Smartphones, Smart wearables, POS terminals, Others) End-user (Consumer electronics, BFSI, Retail and smart packaging, Transportation and logistics, Others)

ams OSRAM AG, Broadcom Inc., Fujitsu Ltd., Infineon Technologies AG, MediaTek Inc., Melexis NV, Microchip Technology Inc., Murata Manufacturing Co. Ltd., Nordic Semiconductor ASA, Nuvoton Technology Corp., NXP Semiconductors NV, Qorvo Inc., Qualcomm Inc., Renesas Electronics Corp., ROHM Co. Ltd., Samsung Electronics Co. Ltd., Sony Semiconductor Solutions, STMicroelectronics NV, Texas Instruments Inc., Toshiba Corp. are a few of the key vendors in the Near Field Communication (Nfc) Chips market.

APAC will register the highest growth rate of 62.7% among the other regions. Therefore, the Near Field Communication (Nfc) Chips market in APAC is expected to garner significant business opportunities for the vendors during the forecast period.

China, Japan, India, South Korea, Australia, Indonesia, US, Canada, Mexico, Germany, UK, France, Italy, Spain, The Netherlands, Brazil, Argentina, Chile, Saudi Arabia, UAE, South Africa, Israel, Turkey

  • Growing adoption of contactless payment ecosystems is the driving factor this market.

The Near Field Communication (Nfc) Chips market vendors should focus on grabbing business opportunities from the Type segment as it accounted for the largest market share in the base year.
RIA - Research AI Assistant
Ask RIA
