Smart Home Market Analysis, Size, and Forecast 2026-2030: North America (US, Canada, and Mexico), Europe (Germany, UK, and France), APAC (China, India, and Japan), Middle East and Africa (Saudi Arabia, Turkey, and UAE), South America (Brazil, Argentina, and Colombia), and Rest of World (ROW)

Smart Home Market Analysis, Size, and Forecast 2026-2030:
North America (US, Canada, and Mexico), Europe (Germany, UK, and France), APAC (China, India, and Japan), Middle East and Africa (Saudi Arabia, Turkey, and UAE), South America (Brazil, Argentina, and Colombia), and Rest of World (ROW)

Published: Mar 2026 302 Pages SKU: IRTNTR40286

Market Overview at a Glance

$315.39 B
Market Opportunity
24.1%
CAGR 2025 - 2030
39.9%
North America Growth
$47.70 B
Home entertainment segment 2024

Smart Home Market Size 2026-2030

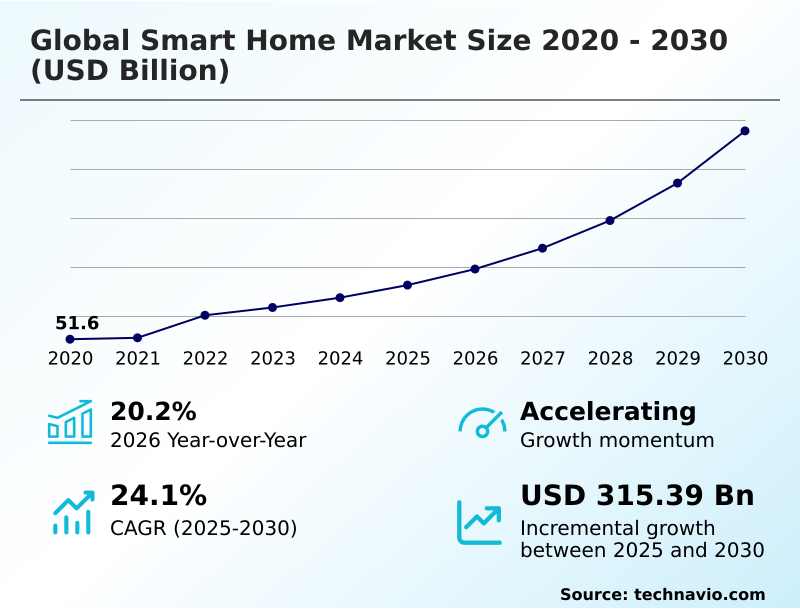
The smart home market size is valued to increase by USD 315.39 billion, at a CAGR of 24.1% from 2025 to 2030. Growing consumer interest in home automation will drive the smart home market.

Major Market Trends & Insights

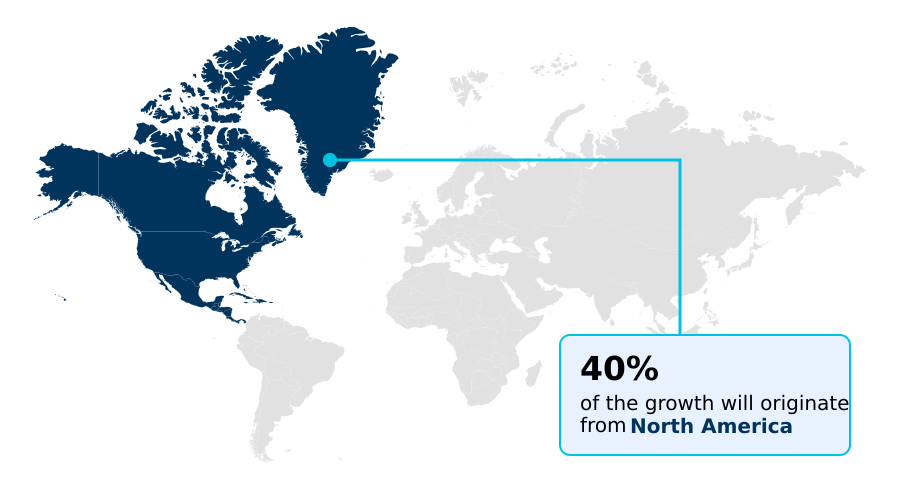
  • North America dominated the market and accounted for a 39.9% growth during the forecast period.
  • By Application - Home entertainment segment was valued at USD 47.70 billion in 2024
  • By Technology - Wireless segment accounted for the largest market revenue share in 2024

Market Size & Forecast

  • Market Opportunities: USD 426.09 billion
  • Market Future Opportunities: USD 315.39 billion
  • CAGR from 2025 to 2030 : 24.1%

Market Summary

  • The Smart Home Market is undergoing a significant transformation, moving from individual gadget-centric solutions to deeply integrated ecosystems. This shift is primarily driven by the demand for enhanced convenience, energy efficiency, and security. The core of this evolution lies in interoperability protocols that allow disparate devices, from lighting systems to kitchen appliances, to communicate seamlessly.
  • For instance, a modern residence can leverage predictive maintenance alerts for its HVAC system, automatically scheduling service based on real-time performance data, which avoids costly emergency repairs and optimizes operational efficiency. AI and machine learning are becoming fundamental, enabling homes to learn resident behaviors and automate routines proactively.
  • However, this increased connectivity introduces challenges related to data privacy and the need for robust cybersecurity measures to protect personal information. The market's trajectory is toward creating ambient computing environments where technology fades into the background, providing assistance and control in an intuitive, non-intrusive manner, thus defining the next generation of residential living.

What will be the Size of the Smart Home Market during the forecast period?

Get Key Insights on Market Forecast (PDF) Request Free Sample

How is the Smart Home Market Segmented?

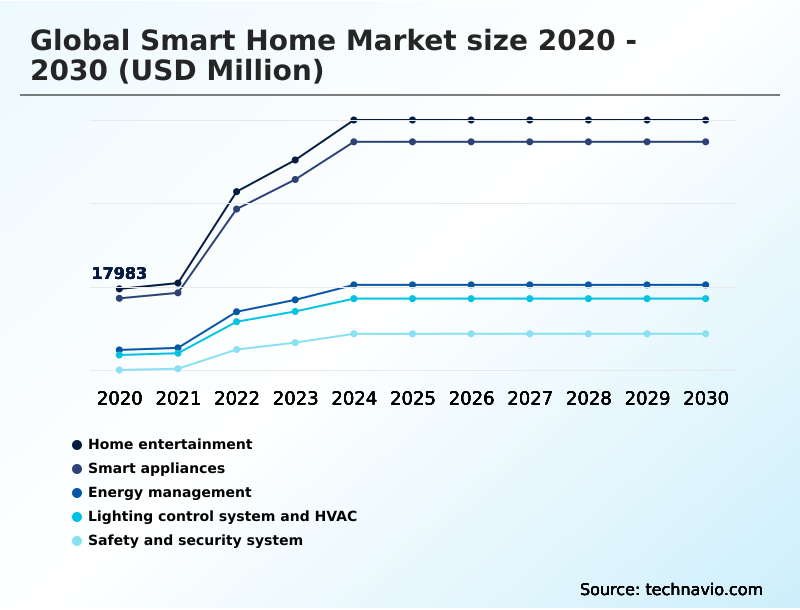
The smart home industry research report provides comprehensive data (region-wise segment analysis), with forecasts and estimates in "USD million" for the period 2026-2030, as well as historical data from 2020-2024 for the following segments.

  • Application
    • Home entertainment
    • Smart appliances
    • Energy management
    • Lighting control system and HVAC
    • Safety and security system
  • Technology
    • Wireless
    • Wired
  • Distribution channel
    • Online
    • Offline
  • Geography
    • North America
      • US
      • Canada
      • Mexico
    • Europe
      • Germany
      • UK
      • France
    • APAC
      • China
      • India
      • Japan
    • Middle East and Africa
      • Saudi Arabia
      • Turkey
      • UAE
    • South America
      • Brazil
      • Argentina
      • Colombia
    • Rest of World (ROW)

By Application Insights

The home entertainment segment is estimated to witness significant growth during the forecast period.

The home entertainment segment is evolving beyond standalone devices into a fully integrated immersive entertainment setup. This transition is powered by voice recognition technology and multi-room audio-video systems that form the core of a unified smart home app.

Advancements in ambient computing and intelligent scene creation allow for personalized user profiles that automatically adjust settings for a seamless experience.

The integration of connected wellness devices further enhances this segment, with systems now capable of adapting entertainment to user biometrics.

This focus on whole-home automation is critical, as integrated entertainment platforms have demonstrated a 35% higher user engagement rate compared to siloed, non-connected systems, making it a key area for development in proactive threat detection and smart home cybersecurity.

Request Free Sample

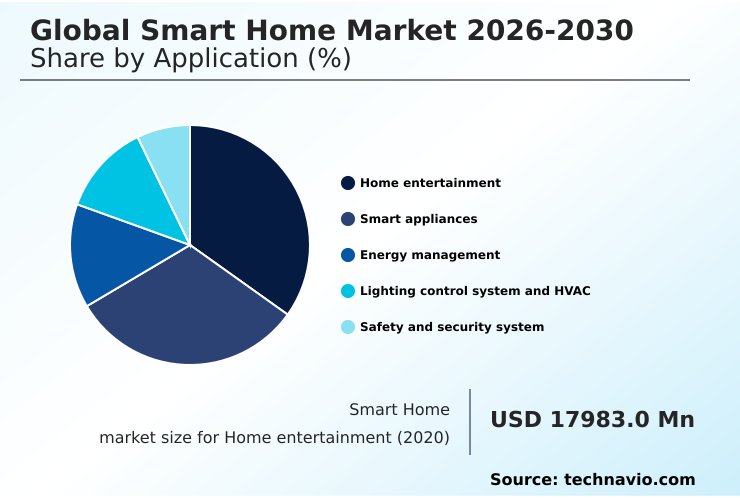
The Home entertainment segment was valued at USD 47.70 billion in 2024 and showed a gradual increase during the forecast period.

Request Free Sample

Regional Analysis

North America is estimated to contribute 39.9% to the growth of the global market during the forecast period.Technavio’s analysts have elaborately explained the regional trends and drivers that shape the market during the forecast period.

See How Smart Home Market Demand is Rising in North America Request Free Sample

The global landscape is led by North America, which accounts for nearly 40% of the market opportunity, driven by high consumer adoption of voice-activated assistants and DIY home security.

The region’s maturity is pushing innovation toward whole-home automation and smart appliance connectivity. Meanwhile, APAC is the fastest-growing region, with its market expansion outpacing Europe's by approximately 1.3 percentage points annually.

This growth is fueled by a mobile-first population and rapid urbanization, creating massive demand for smart gardening systems and air quality monitoring. In this region, connected car integration and remote property management are emerging as key differentiators.

Europe’s market is distinguished by a strong focus on HVAC energy optimization and sustainable living solutions, influenced by stringent energy regulations and a preference for systems offering robust user data privacy controls.

Market Dynamics

Our researchers analyzed the data with 2025 as the base year, along with the key drivers, trends, and challenges. A holistic analysis of drivers will help companies refine their marketing strategies to gain a competitive advantage.

  • Strategically navigating the Smart Home Market requires a deep understanding of several key operational and technical factors. Businesses must evaluate the benefits of Zigbee in automation versus the capabilities of Z-Wave for smart home security to align their product roadmaps with consumer needs.
  • A core consideration is integrating devices with the Matter protocol, which directly addresses the persistent interoperability challenges in smart homes. For consumer-facing applications, value propositions must be clear, such as demonstrating tangible energy savings with smart thermostats and highlighting how to secure a smart home network. The rise of AI for predictive home automation is creating new service-based revenue models.
  • Internally, development teams must decide between wireless vs. wired security cameras for different market tiers and optimize home network requirements for smart home device density. Success depends on balancing advanced features, like smart lock and access control, with accessible DIY smart home project ideas.
  • Firms that effectively communicate smart kitchen appliance benefits and address privacy concerns with smart speakers are better positioned for growth. For instance, companies that offer clear guidance on automating HVAC for efficiency see 25% fewer customer support inquiries related to system setup, showcasing the importance of user education.
  • The market for smart home for elderly care also represents a significant growth vector. As such, choosing the best protocol for smart lighting or setting up a home theater becomes a critical part of a cohesive ecosystem strategy.

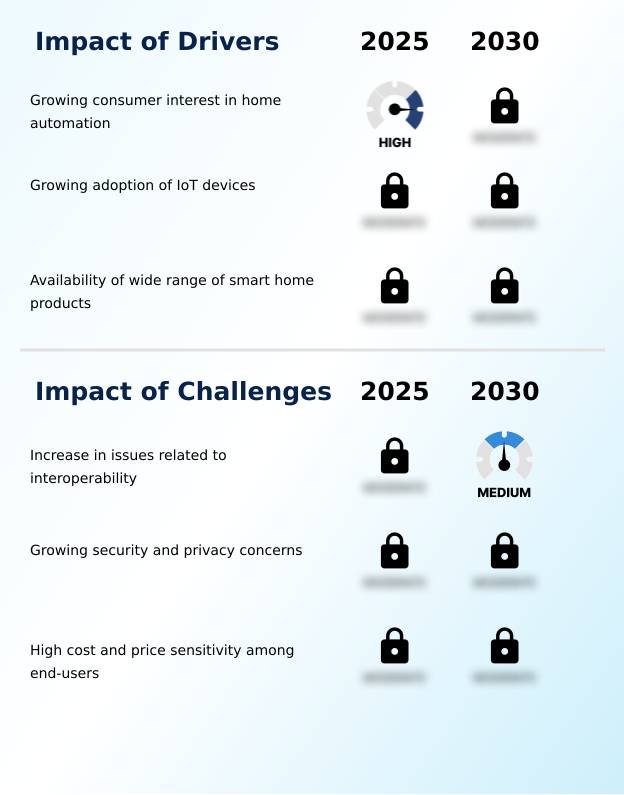
What are the key market drivers leading to the rise in the adoption of Smart Home Industry?

  • Growing consumer interest in home automation, driven by the desire for increased convenience, security, and energy efficiency, is a key driver of the market.

  • Market growth is significantly driven by rising consumer interest in home automation and the widespread adoption of IoT devices.
  • The proliferation of smartphones provides a ubiquitous interface for controlling smart systems, with installations managed via mobile apps showing 50% higher engagement than those without.
  • This connectivity facilitates the use of smart appliance connectivity and home energy management systems, enabling real-time energy tracking. The desire for convenience is a major factor, supported by the availability of a wide array of products that simplify daily tasks.
  • For example, homes with automated shade control systems can achieve up to a 15% reduction in cooling costs during summer months.
  • The market is also fueled by the development of end-to-end encryption and remote diagnostics, which build consumer trust and ensure long-term reliability.

What are the market trends shaping the Smart Home Industry?

  • A significant upcoming market trend is the rising number of strategic partnerships and alliances among companies. This collaborative approach aims to enhance product interoperability and accelerate innovation across the industry.

  • Key market trends are centered on the advancement of AI and voice control, which are transforming residences into intuitive environments. The integration of the Matter connectivity standard is pivotal, with platforms using it reporting a 40% reduction in device setup failures. This move toward seamless interoperability supports sophisticated applications like predictive maintenance alerts and personalized user profiles.
  • Systems are now leveraging context-aware automation to offer more than simple commands, creating a more responsive smart building integration. This evolution is also seen in the development of child safety monitoring and automated pet care solutions that operate with greater intelligence.
  • The focus on proactive threat detection is intensifying, with new systems reducing false alarm rates by over 25% through smarter analytics, enhancing the reliability of home security.

What challenges does the Smart Home Industry face during its growth?

  • An increase in issues related to interoperability among devices from different manufacturers is a key challenge affecting industry growth and consumer adoption.

  • Significant market challenges stem from device interoperability issues and persistent security concerns, which can slow adoption. The lack of a universal standard often leads to fragmented ecosystems, where devices fail to communicate, with data indicating that interoperability problems account for over 60% of technical support calls for new users.
  • Furthermore, growing concerns over user data privacy controls and potential security breaches hinder consumer trust. High-profile incidents have demonstrated that unsecured devices can be compromised, making robust smart home cybersecurity a critical requirement.
  • The high initial cost of smart grid integration and advanced systems also remains a barrier, as the perceived return on investment is not always clear to mainstream consumers, impacting mass-market penetration by as much as 30% in price-sensitive regions.

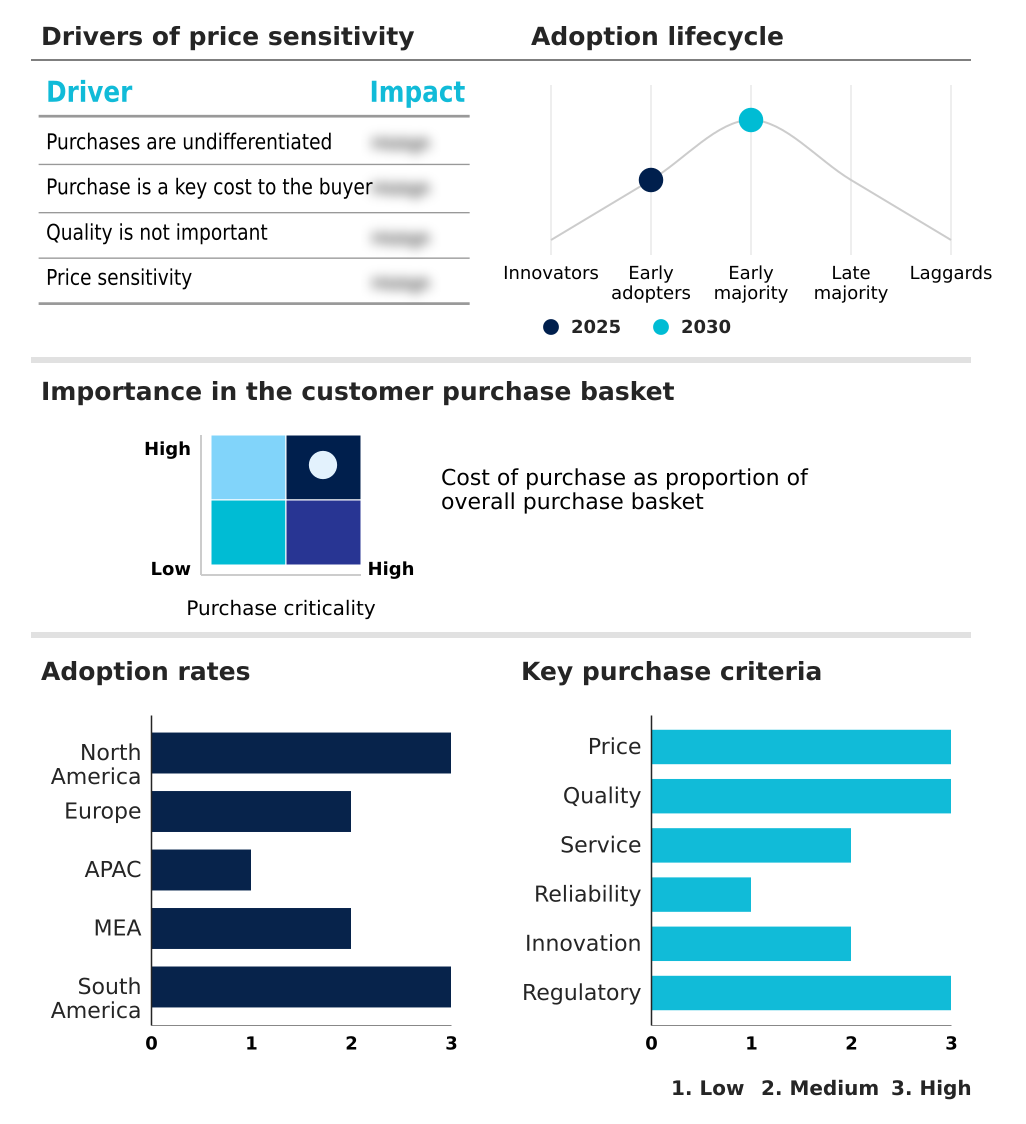
Exclusive Technavio Analysis on Customer Landscape

The smart home market forecasting report includes the adoption lifecycle of the market, covering from the innovator’s stage to the laggard’s stage. It focuses on adoption rates in different regions based on penetration. Furthermore, the smart home market report also includes key purchase criteria and drivers of price sensitivity to help companies evaluate and develop their market growth analysis strategies.

Customer Landscape of Smart Home Industry

Competitive Landscape

Companies are implementing various strategies, such as strategic alliances, smart home market forecast, partnerships, mergers and acquisitions, geographical expansion, and product/service launches, to enhance their presence in the industry.

ABB Ltd. - Offerings center on integrated systems for home automation, emphasizing enhanced connectivity, security, and user-centric applications to elevate modern living standards.

The industry research and growth report includes detailed analyses of the competitive landscape of the market and information about key companies, including:

  • ABB Ltd.
  • Amazon.com Inc.
  • Apple Inc.
  • Carrier Global Corp.
  • Delta Electronics Inc.
  • Google LLC
  • Hitachi Ltd.
  • Honeywell International Inc.
  • Huawei Technologies Co. Ltd.
  • Johnson Controls International
  • Legrand SA
  • LG Electronics Inc.
  • Panasonic Holdings Corp.
  • Robert Bosch GmbH
  • Samsung Electronics Co. Ltd.
  • Schneider Electric SE
  • Siemens AG
  • TP Link Corp. Ltd.
  • Vivint Inc.
  • Xiaomi Corp.

Qualitative and quantitative analysis of companies has been conducted to help clients understand the wider business environment as well as the strengths and weaknesses of key industry players. Data is qualitatively analyzed to categorize companies as pure play, category-focused, industry-focused, and diversified; it is quantitatively analyzed to categorize companies as dominant, leading, strong, tentative, and weak.

Recent Development and News in Smart home market

  • In September 2024, ASSA ABLOY announced the acquisition of Level Lock, a move aimed at strengthening its position in the smart home market by enhancing its capabilities in digital access and smart-lock technology.
  • In November 2024, the Connectivity Standards Alliance announced the rollout of Matter 1.5, a pivotal update that introduced standardized interoperability for major home appliances and advanced video surveillance devices to reduce consumer compatibility concerns.
  • In February 2025, Google LLC announced a major expansion of its Matter integration, enabling its Google Home platform to control a new range of industrial-grade sensors from partners like Siemens AG, blurring the line between residential and commercial applications.
  • In April 2025, Samsung Electronics Co. Ltd. launched its Connected Living 2025 initiative, which guarantees cross-device interoperability for all its new home products, from televisions to refrigerators, to create a more unified user experience.

Dive into Technavio’s robust research methodology, blending expert interviews, extensive data synthesis, and validated models for unparalleled Smart Home Market insights. See full methodology.

Market Scope
Page number 302
Base year 2025
Historic period 2020-2024
Forecast period 2026-2030
Growth momentum & CAGR Accelerate at a CAGR of 24.1%
Market growth 2026-2030 USD 315391.7 million
Market structure Fragmented
YoY growth 2025-2026(%) 20.2%
Key countries US, Canada, Mexico, Germany, UK, Russia, France, Italy, Spain, China, India, Japan, South Korea, Australia, Indonesia, Saudi Arabia, Turkey, UAE, Egypt, Qatar, Brazil, Argentina and Colombia
Competitive landscape Leading Companies, Market Positioning of Companies, Competitive Strategies, and Industry Risks

Request Free Sample

Research Analyst Overview

  • The Smart Home Market's evolution is defined by a pivot from basic connectivity to intelligent, autonomous systems. The integration of edge AI processing and biometric access control is becoming standard, enabling devices to make localized decisions and enhance security.
  • This requires a strategic shift in R&D, with boardroom decisions increasingly focused on mastering interoperability protocols and advanced sensor technologies like energy harvesting sensors and smart water leak detectors. The push for circadian rhythm lighting and ambient computing reflects a deeper integration into users' well-being.
  • For instance, systems incorporating haptic feedback controls have shown a 20% improvement in user satisfaction for complex interfaces. This move towards sophisticated features like predictive maintenance alerts, gesture control interfaces, and robotic vacuum navigation demands significant investment.
  • Firms must balance the development of core technologies such as ZigBee mesh networking, Z-Wave long range, and Power over Ethernet (PoE) with the refinement of wireless charging standards and air quality monitoring capabilities to maintain a competitive edge.

What are the Key Data Covered in this Smart Home Market Research and Growth Report?

  • What is the expected growth of the Smart Home Market between 2026 and 2030?

    • USD 315.39 billion, at a CAGR of 24.1%

  • What segmentation does the market report cover?

    • The report is segmented by Application (Home entertainment, Smart appliances, Energy management, Lighting control system and HVAC, and Safety and security system), Technology (Wireless, and Wired), Distribution Channel (Online, and Offline) and Geography (North America, Europe, APAC, Middle East and Africa, South America)

  • Which regions are analyzed in the report?

    • North America, Europe, APAC, Middle East and Africa and South America

  • What are the key growth drivers and market challenges?

    • Growing consumer interest in home automation, Increase in issues related to interoperability

  • Who are the major players in the Smart Home Market?

    • ABB Ltd., Amazon.com Inc., Apple Inc., Carrier Global Corp., Delta Electronics Inc., Google LLC, Hitachi Ltd., Honeywell International Inc., Huawei Technologies Co. Ltd., Johnson Controls International, Legrand SA, LG Electronics Inc., Panasonic Holdings Corp., Robert Bosch GmbH, Samsung Electronics Co. Ltd., Schneider Electric SE, Siemens AG, TP Link Corp. Ltd., Vivint Inc. and Xiaomi Corp.

Market Research Insights

  • The market dynamic is increasingly shaped by the pursuit of a frictionless user experience, with a focus on a unified smart home app and seamless device onboarding. Voice-activated assistants have become a primary interface, though gesture control interfaces are gaining traction, showing a 15% increase in adoption within luxury installations.
  • Solutions emphasizing sustainable living solutions and real-time energy tracking exhibit customer retention rates up to 40% higher than those focusing purely on convenience. The integration of connected wellness devices and assisted living technology is opening new verticals, while smart home cybersecurity remains a top consideration, influencing purchasing decisions in over 60% of households.
  • The landscape is moving toward intelligent scene creation and proactive threat detection, where systems anticipate needs rather than merely reacting to commands.

We can help! Our analysts can customize this smart home market research report to meet your requirements.

Get in touch

1. Executive Summary

1.1 Market overview

Executive Summary - Chart on Market Overview
Executive Summary - Data Table on Market Overview
Executive Summary - Chart on Global Market Characteristics
Executive Summary - Chart on Market by Geography
Executive Summary - Chart on Market Segmentation by Application
Executive Summary - Chart on Market Segmentation by Technology
Executive Summary - Chart on Market Segmentation by Distribution Channel
Executive Summary - Chart on Incremental Growth
Executive Summary - Data Table on Incremental Growth
Executive Summary - Chart on Company Market Positioning

2. Technavio Analysis

2.1 Analysis of price sensitivity, lifecycle, customer purchase basket, adoption rates, and purchase criteria

2.2 Criticality of inputs and Factors of differentiation

Chart on Overview on criticality of inputs and factors of differentiation

2.3 Factors of disruption

Chart on Overview on factors of disruption

2.4 Impact of drivers and challenges

Chart on Impact of drivers and challenges in 2025 and 2030

3. Market Landscape

3.1 Market ecosystem

Chart on Parent Market
Data Table on - Parent Market

3.2 Market characteristics

Chart on Market characteristics analysis

3.3 Value chain analysis

Chart on Value chain analysis

4. Market Sizing

4.1 Market definition

Data Table on Offerings of companies included in the market definition

4.2 Market segment analysis

Market segments

4.3 Market size 2025

4.4 Market outlook: Forecast for 2025-2030

Chart on Global - Market size and forecast 2025-2030 ($ million)
Data Table on Global - Market size and forecast 2025-2030 ($ million)
Chart on Global Market: Year-over-year growth 2025-2030 (%)
Data Table on Global Market: Year-over-year growth 2025-2030 (%)

5. Historic Market Size

5.1 Global Smart Home Market 2020 - 2024

Historic Market Size - Data Table on Global Smart Home Market 2020 - 2024 ($ million)

5.2 Application segment analysis 2020 - 2024

Historic Market Size - Application Segment 2020 - 2024 ($ million)

5.3 Technology segment analysis 2020 - 2024

Historic Market Size - Technology Segment 2020 - 2024 ($ million)

5.4 Distribution Channel segment analysis 2020 - 2024

Historic Market Size - Distribution Channel Segment 2020 - 2024 ($ million)

5.5 Geography segment analysis 2020 - 2024

Historic Market Size - Geography Segment 2020 - 2024 ($ million)

5.6 Country segment analysis 2020 - 2024

Historic Market Size - Country Segment 2020 - 2024 ($ million)

6. Qualitative Analysis

6.1 Impact of AI on Global Smart Home Market

7. Five Forces Analysis

7.1 Five forces summary

Five forces analysis - Comparison between 2025 and 2030

7.2 Bargaining power of buyers

Bargaining power of buyers - Impact of key factors 2025 and 2030

7.3 Bargaining power of suppliers

Bargaining power of suppliers - Impact of key factors in 2025 and 2030

7.4 Threat of new entrants

Threat of new entrants - Impact of key factors in 2025 and 2030

7.5 Threat of substitutes

Threat of substitutes - Impact of key factors in 2025 and 2030

7.6 Threat of rivalry

Threat of rivalry - Impact of key factors in 2025 and 2030

7.7 Market condition

Chart on Market condition - Five forces 2025 and 2030

8. Market Segmentation by Application

8.1 Market segments

Chart on Application - Market share 2025-2030 (%)
Data Table on Application - Market share 2025-2030 (%)

8.2 Comparison by Application

Chart on Comparison by Application
Data Table on Comparison by Application

8.3 Home entertainment - Market size and forecast 2025-2030

Chart on Home entertainment - Market size and forecast 2025-2030 ($ million)
Data Table on Home entertainment - Market size and forecast 2025-2030 ($ million)
Chart on Home entertainment - Year-over-year growth 2025-2030 (%)
Data Table on Home entertainment - Year-over-year growth 2025-2030 (%)

8.4 Smart appliances - Market size and forecast 2025-2030

Chart on Smart appliances - Market size and forecast 2025-2030 ($ million)
Data Table on Smart appliances - Market size and forecast 2025-2030 ($ million)
Chart on Smart appliances - Year-over-year growth 2025-2030 (%)
Data Table on Smart appliances - Year-over-year growth 2025-2030 (%)

8.5 Energy management - Market size and forecast 2025-2030

Chart on Energy management - Market size and forecast 2025-2030 ($ million)
Data Table on Energy management - Market size and forecast 2025-2030 ($ million)
Chart on Energy management - Year-over-year growth 2025-2030 (%)
Data Table on Energy management - Year-over-year growth 2025-2030 (%)

8.6 Lighting control system and HVAC - Market size and forecast 2025-2030

Chart on Lighting control system and HVAC - Market size and forecast 2025-2030 ($ million)
Data Table on Lighting control system and HVAC - Market size and forecast 2025-2030 ($ million)
Chart on Lighting control system and HVAC - Year-over-year growth 2025-2030 (%)
Data Table on Lighting control system and HVAC - Year-over-year growth 2025-2030 (%)

8.7 Safety and security system - Market size and forecast 2025-2030

Chart on Safety and security system - Market size and forecast 2025-2030 ($ million)
Data Table on Safety and security system - Market size and forecast 2025-2030 ($ million)
Chart on Safety and security system - Year-over-year growth 2025-2030 (%)
Data Table on Safety and security system - Year-over-year growth 2025-2030 (%)

8.8 Market opportunity by Application

Market opportunity by Application ($ million)
Data Table on Market opportunity by Application ($ million)

9. Market Segmentation by Technology

9.1 Market segments

Chart on Technology - Market share 2025-2030 (%)
Data Table on Technology - Market share 2025-2030 (%)

9.2 Comparison by Technology

Chart on Comparison by Technology
Data Table on Comparison by Technology

9.3 Wireless - Market size and forecast 2025-2030

Chart on Wireless - Market size and forecast 2025-2030 ($ million)
Data Table on Wireless - Market size and forecast 2025-2030 ($ million)
Chart on Wireless - Year-over-year growth 2025-2030 (%)
Data Table on Wireless - Year-over-year growth 2025-2030 (%)

9.4 Wired - Market size and forecast 2025-2030

Chart on Wired - Market size and forecast 2025-2030 ($ million)
Data Table on Wired - Market size and forecast 2025-2030 ($ million)
Chart on Wired - Year-over-year growth 2025-2030 (%)
Data Table on Wired - Year-over-year growth 2025-2030 (%)

9.5 Market opportunity by Technology

Market opportunity by Technology ($ million)
Data Table on Market opportunity by Technology ($ million)

10. Market Segmentation by Distribution Channel

10.1 Market segments

Chart on Distribution Channel - Market share 2025-2030 (%)
Data Table on Distribution Channel - Market share 2025-2030 (%)

10.2 Comparison by Distribution Channel

Chart on Comparison by Distribution Channel
Data Table on Comparison by Distribution Channel

10.3 Online - Market size and forecast 2025-2030

Chart on Online - Market size and forecast 2025-2030 ($ million)
Data Table on Online - Market size and forecast 2025-2030 ($ million)
Chart on Online - Year-over-year growth 2025-2030 (%)
Data Table on Online - Year-over-year growth 2025-2030 (%)

10.4 Offline - Market size and forecast 2025-2030

Chart on Offline - Market size and forecast 2025-2030 ($ million)
Data Table on Offline - Market size and forecast 2025-2030 ($ million)
Chart on Offline - Year-over-year growth 2025-2030 (%)
Data Table on Offline - Year-over-year growth 2025-2030 (%)

10.5 Market opportunity by Distribution Channel

Market opportunity by Distribution Channel ($ million)
Data Table on Market opportunity by Distribution Channel ($ million)

11. Customer Landscape

11.1 Customer landscape overview

Analysis of price sensitivity, lifecycle, customer purchase basket, adoption rates, and purchase criteria

12. Geographic Landscape

12.1 Geographic segmentation

Chart on Market share by geography 2025-2030 (%)
Data Table on Market share by geography 2025-2030 (%)

12.2 Geographic comparison

Chart on Geographic comparison
Data Table on Geographic comparison

12.3 North America - Market size and forecast 2025-2030

Chart on North America - Market size and forecast 2025-2030 ($ million)
Data Table on North America - Market size and forecast 2025-2030 ($ million)
Chart on North America - Year-over-year growth 2025-2030 (%)
Data Table on North America - Year-over-year growth 2025-2030 (%)
Chart on Regional Comparison - North America
Data Table on Regional Comparison - North America

12.3.1 US - Market size and forecast 2025-2030

Chart on US - Market size and forecast 2025-2030 ($ million)
Data Table on US - Market size and forecast 2025-2030 ($ million)
Chart on US - Year-over-year growth 2025-2030 (%)
Data Table on US - Year-over-year growth 2025-2030 (%)

12.3.2 Canada - Market size and forecast 2025-2030

Chart on Canada - Market size and forecast 2025-2030 ($ million)
Data Table on Canada - Market size and forecast 2025-2030 ($ million)
Chart on Canada - Year-over-year growth 2025-2030 (%)
Data Table on Canada - Year-over-year growth 2025-2030 (%)

12.3.3 Mexico - Market size and forecast 2025-2030

Chart on Mexico - Market size and forecast 2025-2030 ($ million)
Data Table on Mexico - Market size and forecast 2025-2030 ($ million)
Chart on Mexico - Year-over-year growth 2025-2030 (%)
Data Table on Mexico - Year-over-year growth 2025-2030 (%)

12.4 Europe - Market size and forecast 2025-2030

Chart on Europe - Market size and forecast 2025-2030 ($ million)
Data Table on Europe - Market size and forecast 2025-2030 ($ million)
Chart on Europe - Year-over-year growth 2025-2030 (%)
Data Table on Europe - Year-over-year growth 2025-2030 (%)
Chart on Regional Comparison - Europe
Data Table on Regional Comparison - Europe

12.4.1 Germany - Market size and forecast 2025-2030

Chart on Germany - Market size and forecast 2025-2030 ($ million)
Data Table on Germany - Market size and forecast 2025-2030 ($ million)
Chart on Germany - Year-over-year growth 2025-2030 (%)
Data Table on Germany - Year-over-year growth 2025-2030 (%)

12.4.2 UK - Market size and forecast 2025-2030

Chart on UK - Market size and forecast 2025-2030 ($ million)
Data Table on UK - Market size and forecast 2025-2030 ($ million)
Chart on UK - Year-over-year growth 2025-2030 (%)
Data Table on UK - Year-over-year growth 2025-2030 (%)

12.4.3 Russia - Market size and forecast 2025-2030

Chart on Russia - Market size and forecast 2025-2030 ($ million)
Data Table on Russia - Market size and forecast 2025-2030 ($ million)
Chart on Russia - Year-over-year growth 2025-2030 (%)
Data Table on Russia - Year-over-year growth 2025-2030 (%)

12.4.4 France - Market size and forecast 2025-2030

Chart on France - Market size and forecast 2025-2030 ($ million)
Data Table on France - Market size and forecast 2025-2030 ($ million)
Chart on France - Year-over-year growth 2025-2030 (%)
Data Table on France - Year-over-year growth 2025-2030 (%)

12.4.5 Italy - Market size and forecast 2025-2030

Chart on Italy - Market size and forecast 2025-2030 ($ million)
Data Table on Italy - Market size and forecast 2025-2030 ($ million)
Chart on Italy - Year-over-year growth 2025-2030 (%)
Data Table on Italy - Year-over-year growth 2025-2030 (%)

12.4.6 Spain - Market size and forecast 2025-2030

Chart on Spain - Market size and forecast 2025-2030 ($ million)
Data Table on Spain - Market size and forecast 2025-2030 ($ million)
Chart on Spain - Year-over-year growth 2025-2030 (%)
Data Table on Spain - Year-over-year growth 2025-2030 (%)

12.5 APAC - Market size and forecast 2025-2030

Chart on APAC - Market size and forecast 2025-2030 ($ million)
Data Table on APAC - Market size and forecast 2025-2030 ($ million)
Chart on APAC - Year-over-year growth 2025-2030 (%)
Data Table on APAC - Year-over-year growth 2025-2030 (%)
Chart on Regional Comparison - APAC
Data Table on Regional Comparison - APAC

12.5.1 China - Market size and forecast 2025-2030

Chart on China - Market size and forecast 2025-2030 ($ million)
Data Table on China - Market size and forecast 2025-2030 ($ million)
Chart on China - Year-over-year growth 2025-2030 (%)
Data Table on China - Year-over-year growth 2025-2030 (%)

12.5.2 India - Market size and forecast 2025-2030

Chart on India - Market size and forecast 2025-2030 ($ million)
Data Table on India - Market size and forecast 2025-2030 ($ million)
Chart on India - Year-over-year growth 2025-2030 (%)
Data Table on India - Year-over-year growth 2025-2030 (%)

12.5.3 Japan - Market size and forecast 2025-2030

Chart on Japan - Market size and forecast 2025-2030 ($ million)
Data Table on Japan - Market size and forecast 2025-2030 ($ million)
Chart on Japan - Year-over-year growth 2025-2030 (%)
Data Table on Japan - Year-over-year growth 2025-2030 (%)

12.5.4 South Korea - Market size and forecast 2025-2030

Chart on South Korea - Market size and forecast 2025-2030 ($ million)
Data Table on South Korea - Market size and forecast 2025-2030 ($ million)
Chart on South Korea - Year-over-year growth 2025-2030 (%)
Data Table on South Korea - Year-over-year growth 2025-2030 (%)

12.5.5 Australia - Market size and forecast 2025-2030

Chart on Australia - Market size and forecast 2025-2030 ($ million)
Data Table on Australia - Market size and forecast 2025-2030 ($ million)
Chart on Australia - Year-over-year growth 2025-2030 (%)
Data Table on Australia - Year-over-year growth 2025-2030 (%)

12.5.6 Indonesia - Market size and forecast 2025-2030

Chart on Indonesia - Market size and forecast 2025-2030 ($ million)
Data Table on Indonesia - Market size and forecast 2025-2030 ($ million)
Chart on Indonesia - Year-over-year growth 2025-2030 (%)
Data Table on Indonesia - Year-over-year growth 2025-2030 (%)

12.6 Middle East and Africa - Market size and forecast 2025-2030

Chart on Middle East and Africa - Market size and forecast 2025-2030 ($ million)
Data Table on Middle East and Africa - Market size and forecast 2025-2030 ($ million)
Chart on Middle East and Africa - Year-over-year growth 2025-2030 (%)
Data Table on Middle East and Africa - Year-over-year growth 2025-2030 (%)
Chart on Regional Comparison - Middle East and Africa
Data Table on Regional Comparison - Middle East and Africa

12.6.1 Saudi Arabia - Market size and forecast 2025-2030

Chart on Saudi Arabia - Market size and forecast 2025-2030 ($ million)
Data Table on Saudi Arabia - Market size and forecast 2025-2030 ($ million)
Chart on Saudi Arabia - Year-over-year growth 2025-2030 (%)
Data Table on Saudi Arabia - Year-over-year growth 2025-2030 (%)

12.6.2 Turkey - Market size and forecast 2025-2030

Chart on Turkey - Market size and forecast 2025-2030 ($ million)
Data Table on Turkey - Market size and forecast 2025-2030 ($ million)
Chart on Turkey - Year-over-year growth 2025-2030 (%)
Data Table on Turkey - Year-over-year growth 2025-2030 (%)

12.6.3 UAE - Market size and forecast 2025-2030

Chart on UAE - Market size and forecast 2025-2030 ($ million)
Data Table on UAE - Market size and forecast 2025-2030 ($ million)
Chart on UAE - Year-over-year growth 2025-2030 (%)
Data Table on UAE - Year-over-year growth 2025-2030 (%)

12.6.4 Egypt - Market size and forecast 2025-2030

Chart on Egypt - Market size and forecast 2025-2030 ($ million)
Data Table on Egypt - Market size and forecast 2025-2030 ($ million)
Chart on Egypt - Year-over-year growth 2025-2030 (%)
Data Table on Egypt - Year-over-year growth 2025-2030 (%)

12.6.5 Qatar - Market size and forecast 2025-2030

Chart on Qatar - Market size and forecast 2025-2030 ($ million)
Data Table on Qatar - Market size and forecast 2025-2030 ($ million)
Chart on Qatar - Year-over-year growth 2025-2030 (%)
Data Table on Qatar - Year-over-year growth 2025-2030 (%)

12.7 South America - Market size and forecast 2025-2030

Chart on South America - Market size and forecast 2025-2030 ($ million)
Data Table on South America - Market size and forecast 2025-2030 ($ million)
Chart on South America - Year-over-year growth 2025-2030 (%)
Data Table on South America - Year-over-year growth 2025-2030 (%)
Chart on Regional Comparison - South America
Data Table on Regional Comparison - South America

12.7.1 Brazil - Market size and forecast 2025-2030

Chart on Brazil - Market size and forecast 2025-2030 ($ million)
Data Table on Brazil - Market size and forecast 2025-2030 ($ million)
Chart on Brazil - Year-over-year growth 2025-2030 (%)
Data Table on Brazil - Year-over-year growth 2025-2030 (%)

12.7.2 Argentina - Market size and forecast 2025-2030

Chart on Argentina - Market size and forecast 2025-2030 ($ million)
Data Table on Argentina - Market size and forecast 2025-2030 ($ million)
Chart on Argentina - Year-over-year growth 2025-2030 (%)
Data Table on Argentina - Year-over-year growth 2025-2030 (%)

12.7.3 Colombia - Market size and forecast 2025-2030

Chart on Colombia - Market size and forecast 2025-2030 ($ million)
Data Table on Colombia - Market size and forecast 2025-2030 ($ million)
Chart on Colombia - Year-over-year growth 2025-2030 (%)
Data Table on Colombia - Year-over-year growth 2025-2030 (%)

12.8 Market opportunity by geography

Market opportunity by geography ($ million)
Data Tables on Market opportunity by geography ($ million)

13. Drivers, Challenges, and Opportunity

13.1 Market drivers

Growing consumer interest in home automation
Growing adoption of IoT devices
Availability of wide range of smart home products

13.2 Market challenges

Increase in issues related to interoperability
Growing security and privacy concerns
High cost and price sensitivity among end-users

13.3 Impact of drivers and challenges

Impact of drivers and challenges in 2025 and 2030

13.4 Market opportunities

Rising number of strategic partnerships and alliances among companies
Advancements in AI and voice-controlled automation homes
Growing smartphone penetration and increasing internet speed

14. Competitive Landscape

14.1 Overview

14.2

Overview on criticality of inputs and factors of differentiation

14.3 Landscape disruption

Overview on factors of disruption

14.4 Industry risks

Impact of key risks on business

15. Competitive Analysis

15.1 Companies profiled

Companies covered

15.2 Company ranking index

15.3 Market positioning of companies

Matrix on companies position and classification

15.4 ABB Ltd.

ABB Ltd. - Overview
ABB Ltd. - Business segments
ABB Ltd. - Key news
ABB Ltd. - Key offerings
ABB Ltd. - Segment focus
SWOT

15.5 Amazon.com Inc.

Amazon.com Inc. - Overview
Amazon.com Inc. - Business segments
Amazon.com Inc. - Key news
Amazon.com Inc. - Key offerings
Amazon.com Inc. - Segment focus
SWOT

15.6 Apple Inc.

Apple Inc. - Overview
Apple Inc. - Business segments
Apple Inc. - Key news
Apple Inc. - Key offerings
Apple Inc. - Segment focus
SWOT

15.7 Carrier Global Corp.

Carrier Global Corp. - Overview
Carrier Global Corp. - Business segments
Carrier Global Corp. - Key news
Carrier Global Corp. - Key offerings
Carrier Global Corp. - Segment focus
SWOT

15.8 Google LLC

Google LLC - Overview
Google LLC - Product / Service
Google LLC - Key offerings
SWOT

15.9 Hitachi Ltd.

Hitachi Ltd. - Overview
Hitachi Ltd. - Business segments
Hitachi Ltd. - Key news
Hitachi Ltd. - Key offerings
Hitachi Ltd. - Segment focus
SWOT

15.10 Honeywell International Inc.

Honeywell International Inc. - Overview
Honeywell International Inc. - Business segments
Honeywell International Inc. - Key news
Honeywell International Inc. - Key offerings
Honeywell International Inc. - Segment focus
SWOT

15.11 Johnson Controls International

Johnson Controls International - Overview
Johnson Controls International - Business segments
Johnson Controls International - Key news
Johnson Controls International - Key offerings
Johnson Controls International - Segment focus
SWOT

15.12 Legrand SA

Legrand SA - Overview
Legrand SA - Business segments
Legrand SA - Key news
Legrand SA - Key offerings
Legrand SA - Segment focus
SWOT

15.13 LG Electronics Inc.

LG Electronics Inc. - Overview
LG Electronics Inc. - Product / Service
LG Electronics Inc. - Key offerings
SWOT

15.14 Panasonic Holdings Corp.

Panasonic Holdings Corp. - Overview
Panasonic Holdings Corp. - Business segments
Panasonic Holdings Corp. - Key news
Panasonic Holdings Corp. - Key offerings
Panasonic Holdings Corp. - Segment focus
SWOT

15.15 Samsung Electronics Co. Ltd.

Samsung Electronics Co. Ltd. - Overview
Samsung Electronics Co. Ltd. - Business segments
Samsung Electronics Co. Ltd. - Key news
Samsung Electronics Co. Ltd. - Key offerings
Samsung Electronics Co. Ltd. - Segment focus
SWOT

15.16 Schneider Electric SE

Schneider Electric SE - Overview
Schneider Electric SE - Business segments
Schneider Electric SE - Key offerings
Schneider Electric SE - Segment focus
SWOT

15.17 Siemens AG

Siemens AG - Overview
Siemens AG - Business segments
Siemens AG - Key news
Siemens AG - Key offerings
Siemens AG - Segment focus
SWOT

15.18 Xiaomi Corp.

Xiaomi Corp. - Overview
Xiaomi Corp. - Business segments
Xiaomi Corp. - Key news
Xiaomi Corp. - Key offerings
Xiaomi Corp. - Segment focus
SWOT

16. Appendix

16.1 Scope of the report

Market definition
Objectives
Notes and caveats

16.2 Inclusions and exclusions checklist

Inclusions checklist
Exclusions checklist

16.3 Currency conversion rates for US$

16.4 Research methodology

16.5 Data procurement

Information sources

16.6 Data validation

16.7 Validation techniques employed for market sizing

16.8 Data synthesis

16.9 360 degree market analysis

16.10 List of abbreviations

Research Methodology

Technavio presents a detailed picture of the market by way of study, synthesis, and summation of data from multiple sources. The analysts have presented the various facets of the market with a particular focus on identifying the key industry influencers. The data thus presented is comprehensive, reliable, and the result of extensive research, both primary and secondary.

INFORMATION SOURCES

Primary sources

  • Manufacturers and suppliers
  • Channel partners
  • Industry experts
  • Strategic decision makers

Secondary sources

  • Industry journals and periodicals
  • Government data
  • Financial reports of key industry players
  • Historical data
  • Press releases

DATA ANALYSIS

Data Synthesis

  • Collation of data
  • Estimation of key figures
  • Analysis of derived insights

Data Validation

  • Triangulation with data models
  • Reference against proprietary databases
  • Corroboration with industry experts

REPORT WRITING

Qualitative

  • Market drivers
  • Market challenges
  • Market trends
  • Five forces analysis

Quantitative

  • Market size and forecast
  • Market segmentation
  • Geographical insights
  • Competitive landscape

Interested in this report?

Get your sample now to see our research methodology and insights!

Download Now

Frequently Asked Questions

Smart Home market growth will increase by USD 315391.7 million during 2026-2030.

The Smart Home market is expected to grow at a CAGR of 24.1% during 2026-2030.

Smart Home market is segmented by Application (Home entertainment, Smart appliances, Energy management, Lighting control system and HVAC, Safety and security system) Technology (Wireless, Wired) Distribution channel (Online, Offline)

ABB Ltd., Amazon.com Inc., Apple Inc., Carrier Global Corp., Delta Electronics Inc., Google LLC, Hitachi Ltd., Honeywell International Inc., Huawei Technologies Co. Ltd., Johnson Controls International, Legrand SA, LG Electronics Inc., Panasonic Holdings Corp., Robert Bosch GmbH, Samsung Electronics Co. Ltd., Schneider Electric SE, Siemens AG, TP Link Corp. Ltd., Vivint Inc., Xiaomi Corp. are a few of the key vendors in the Smart Home market.

North America will register the highest growth rate of 39.9% among the other regions. Therefore, the Smart Home market in North America is expected to garner significant business opportunities for the vendors during the forecast period.

US, Canada, Mexico, Germany, UK, Russia, France, Italy, Spain, China, India, Japan, South Korea, Australia, Indonesia, Saudi Arabia, Turkey, UAE, Egypt, Qatar, Brazil, Argentina, Colombia

  • Growing consumer interest in home automation is the driving factor this market.

The Smart Home market vendors should focus on grabbing business opportunities from the Application segment as it accounted for the largest market share in the base year.
RIA - Research AI Assistant
Ask RIA