Niobium Market Analysis APAC, North America, Europe, South America, Middle East and Africa - US, China, India, Japan, Germany - Size and Forecast 2024-2028

Niobium Market Analysis APAC, North America, Europe, South America, Middle East and Africa - US, China, India, Japan, Germany - Size and Forecast 2024-2028

Published: Dec 2023 158 Pages SKU: IRTNTR77099

Market Overview at a Glance

$481.34 Mn
Market Opportunity
5%
CAGR
4.5
YoY growth 2023-2024(%)

Niobium Market Size 2024-2028

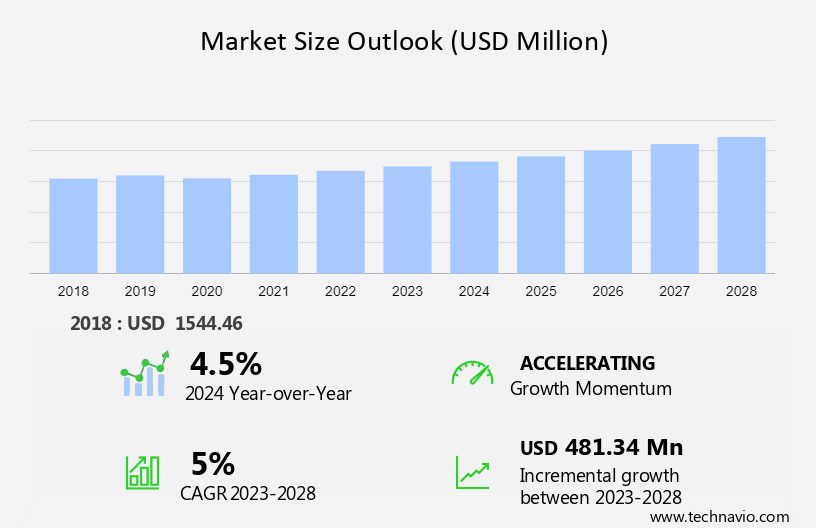
The niobium market size is forecast to increase by USD 481.34 mn at a CAGR of 5% between 2023 and 2028.

  • The market is experiencing significant growth due to its increasing applications in various industries. One of the primary drivers is the expanding production of steel, where niobium is used as a key additive to enhance its strength and durability. In the electronics sector, niobium's unique properties make it an essential component in superconductors, batteries, and superalloys for use in batteries, transformers, and pressure vessels. Furthermore, the demand for niobium in medical imaging, optical modulators, and lithium-ion batteries for electric vehicles and consumer electronics such as laptops, tablets, and smartphones is on the rise. Additionally, niobium's applications in niche markets like magnet manufacturing for construction and steel manufacturing, optoelectronics, and molybdenum alloys, further expand its market potential.
  • However, the market faces challenges such as limited supply and geographic concentration, which may impact its growth trajectory. Overall, the market is poised for growth due to its diverse applications in various industries, including steel production, electronics, and optoelectronics.
  • What will be the Size of the Niobium Market During the Forecast Period?

    Niobium Market Size

     Request Free Sample

  • The market encompasses the global trade of niobium and its alloys, primarily used in various industries for their high-strength and corrosion-resistant properties. Key end-use sectors include structural steel for construction, transportation, and heavy machinery; pressure vessels and steel reinforcing bars for infrastructure; railway tracks; and lithium-ion batteries for electric vehicles and renewable energy storage. Niobium demand is driven by the World Steel Association's increasing steel production, with significant growth in non-residential construction and passenger cars. The market is influenced by the availability of niobium ore resources, primarily derived from alkaline intrusive rocks such as carbonatites, granites, and pegmatites. Tantalite, a mineral containing both niobium and tantalum, is often mined as a byproduct.
  • Ferroniobium, an alloy of niobium and iron, is the primary form of niobium used in industries. Applications include high-performance batteries, wind turbines, medical imaging, particle accelerators, and advanced materials like high-performance alloys for jet engine components, gas turbines, and rocket subassemblies. The market is expected to continue growing due to increasing demand for electric vehicles, renewable energy, and advanced technologies.
  • How is this Niobium Industry segmented and which is the largest segment?

    The niobium industry research report provides comprehensive data (region-wise segment analysis), with forecasts and estimates in "USD million" for the period 2024-2028, as well as historical data from 2018-2022 for the following segments.

    • End-user
      • Construction
      • Automotive and transportation
      • Oil and gas
      • Aerospace and defense
      • Others
    • Application
      • Steel manufacturing
      • Superalloys
      • Others
    • Geography
      • APAC
        • China
        • India
        • Japan
      • North America
        • US
      • Europe
        • Germany
      • South America
        • Middle East and Africa

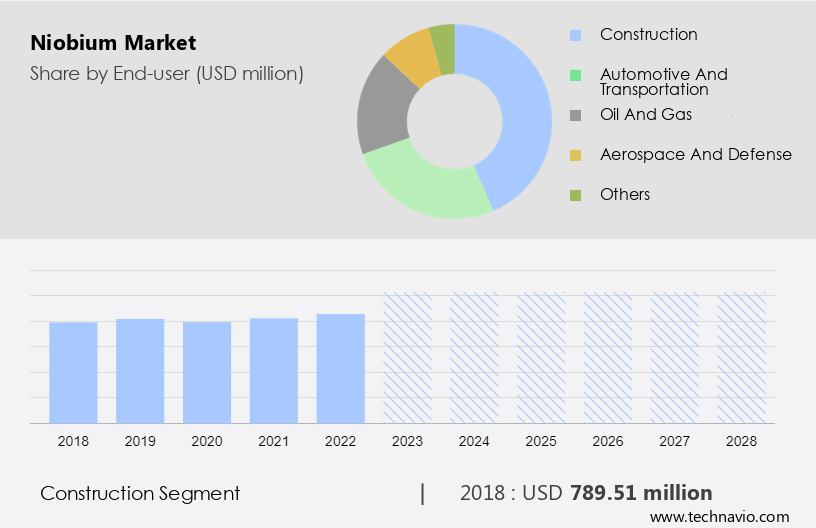
        By End-user Insights

        The construction segment is estimated to witness significant growth during the forecast period. Niobium, a valuable alloying element, significantly contributes to the construction sector and The market. Known as columbium, niobium enhances steel's properties, making it stronger, more durable, and resistant to corrosion. This alloying element is essential in infrastructure projects, buildings, and bridges. HSLA (High-Strength, Low-Alloy) steels, which contain niobium, offer increased load capacity and resistance to extreme weather conditions, making them suitable for constructing bridges, high-rise buildings, and industrial structures. Niobium's ability to improve steel's strength-to-weight ratio also makes it a desirable component in building lightweight structures without compromising durability. In the steel industry, niobium is used extensively in structural steel, transportation disruptions, pressure vessels, steel reinforcing bars, railway tracks, and various applications In the infrastructure sector.

        The demand for niobium is driven by its use in various industries, including automotive, lithium-ion batteries, and the energy sector. The World Steel Association reports that niobium is an essential component in superalloys, superconductors, electronic components, functional ceramics, and new-age technologies. Niobium's role in various industries and applications, coupled with increasing demand for high-performance materials, is expected to drive market growth.

        Niobium Market Size

        Get a glance at the market report of various segments Request Free Sample

        The Construction segment was valued at USD 789.51 mn in 2018 and showed a gradual increase during the forecast period.

        Regional Analysis

        APAC is estimated to contribute 40% to the growth of the global market during the forecast period. Technavio’s analysts have elaborately explained the regional trends and drivers that shape the market during the forecast period.

        Niobium Market Share by Geography

        For more insights on the market size of various regions, Request Free Sample

        Niobium, a metallic element primarily used as an alloying agent In the steel industry, particularly for high-strength and low-alloy steels, has experienced notable growth in demand withIn the Asia-Pacific (APAC) region. This expansion is attributed to the region's significant infrastructure development and industrialization, with countries like China and India investing heavily in projects such as bridges, highways, power plants, and buildings. In the steel industry, niobium is essential for producing high-performance steel, including ferroniobium and HSLA (High-Strength Low-Alloy) steel, which offer enhanced mechanical qualities, wear resistance, and corrosion resistance. The increasing demand for these steels in infrastructure and automotive sectors, driven by urbanization and industrial expansion, is propelling the growth of the market in APAC.

        Additionally, niobium is used in various industries, including transportation, energy, and electronics, further expanding its market potential.

        Market Dynamics

        Our researchers analyzed the data with 2023 as the base year, along with the key drivers, trends, and challenges. A holistic analysis of drivers will help companies refine their marketing strategies to gain a competitive advantage.

        What are the key market drivers leading to the rise In the adoption of Niobium Industry?

        • Increased growth in steel production is the key driver of the market.The market is experiencing notable expansion, primarily due to the rising global crude steel production. Niobium, an essential element, is extensively employed as an alloying agent in steelmaking. Its usage is predominantly observed In the production of high-strength, low-alloy (HSLA) steels, which are in high demand across various sectors, including automotive, construction, and infrastructure. HSLA steels offer superior mechanical qualities, such as high tensile strength, enhanced formability, and superior resistance to corrosion. As these industries continue to expand, the demand for niobium in steel production is projected to escalate. Niobium is also a vital component In the manufacturing of superalloys, superconductors, electronic components, functional ceramics, and new-age technologies.

          In the infrastructure sector, niobium is used In the production of pressure vessels, heavy machinery, railway tracks, and steel reinforcing bars. In the automotive industry, it is utilized In the manufacture of passenger cars and electric vehicles, contributing to improved fuel efficiency and safety standards. In the energy sector, niobium is used in power generation facilities, both fossil fuel-based and renewable, as well as in wind turbine components, including towers, blades, penstocks, and other critical components. The market growth is influenced by several factors, including the increasing demand for high-performance engines, the growing importance of lightweight materials in reducing carbon emissions, and the increasing focus on safety standards in various industries.

          Price volatility, geopolitical events, and economic conditions also impact the market. Major producers include Horwin Brasil, Telex Metals, and other leading mining companies. Niobium ore resources are primarily found in alkaline intrusive rocks such as carbonatites, granites, and pegmatites. The market is expected to continue its growth trajectory during the forecast period, driven by the increasing demand for niobium in various industries and applications.

        What are the market trends shaping the Niobium market?

        • Evolving electronics and optoelectronics is the upcoming market trend.The market is experiencing notable growth due to its increasing utilization in advanced technologies, particularly In the electronics and optoelectronics industries. As a transition metal, niobium boasts distinctive properties that make it indispensable for various electronic and optoelectronic devices. This trend is anticipated to substantially influence market expansion during the forecast period. A primary driver of this trend is the escalating demand for high-performance electronic gadgets, such as mobile phones, tablets, and laptops, which require niobium for miniaturization and performance enhancement. Niobium is extensively employed in electronic capacitors due to its capability to store and discharge large energy quantities swiftly.

          Additionally, it is a critical component in superconducting magnets, high-strength steels, and other high-tech applications, including lithium-ion batteries, heavy machinery, pressure vessels, steel reinforcing bars, railway tracks, and infrastructure development. The market dynamics are influenced by factors such as mine design, world consumption, and the availability of niobium ore resources, including tantalite, niobium, tantalum, alkaline intrusive, carbonatites, granites, and pegmatites. Key applications of niobium include steelmaking, superalloys, superconductors, electronic components, functional ceramics, and new-age technologies. The market is further influenced by factors such as ferroalloy loadings, construction, wind turbines, medical imaging, particle accelerators, high-performance batteries, iron-based superalloys, jet engine components, gas turbines, rocket subassemblies, turbo charger systems, heat resisting, combustion equipment, air frame systems, and various industries such as Toshiba, defence and aerospace, and the strategic metal industry.

          Import growth, vanadium market, rebar standards, steel makers, bridges, buildings, hangars, stadiums, high-performance engines, automobiles, lightweight materials, carbon emissions, fuel economy, nuclear fusion projects, niobium prices, and market insight reports also impact the market. Price volatility, geopolitical events, economic conditions, major producers, mining strikes, regulatory changes, and geopolitical tensions can cause price spikes and impact procurement levels, forecasted shipping delays, distributor mapping, commodity analysis, and production analysis.

        What challenges does the Niobium Industry face during its growth?

        • Limited supply and geographic concentration is a key challenge affecting the industry growth.The market encounters two primary challenges: the limited supply and geographic concentration of production. Niobium, a vital alloying element, is primarily derived from pyrochlore ores. The scarcity of these ores contributes to the metal's limited availability, resulting in potential price volatility and supply chain disruptions. Furthermore, the concentration of niobium production in a few countries, with Brazil being the leading producer, increases the market's vulnerability. This geographic focus can lead to geopolitical tensions and regulatory changes impacting the industry. Major consumers of niobium include the infrastructure sector for structural steel applications in construction, transportation, and infrastructure development. In the automotive industry, niobium is used in high-strength steels, pressure vessels, steel reinforcing bars, and railway tracks.

          Additionally, niobium is essential In the production of lithium-ion batteries, superalloys, superconductors, electronic components, functional ceramics, and new-age technologies. The market growth is driven by the increasing demand for high-performance batteries, iron-based superalloys, jet engine components, gas turbines, rocket subassemblies, turbo charger systems, heat resisting, and combustion equipment. Despite these challenges, the market continues to grow due to its crucial role in various industries, including infrastructure, automotive, and energy sectors.

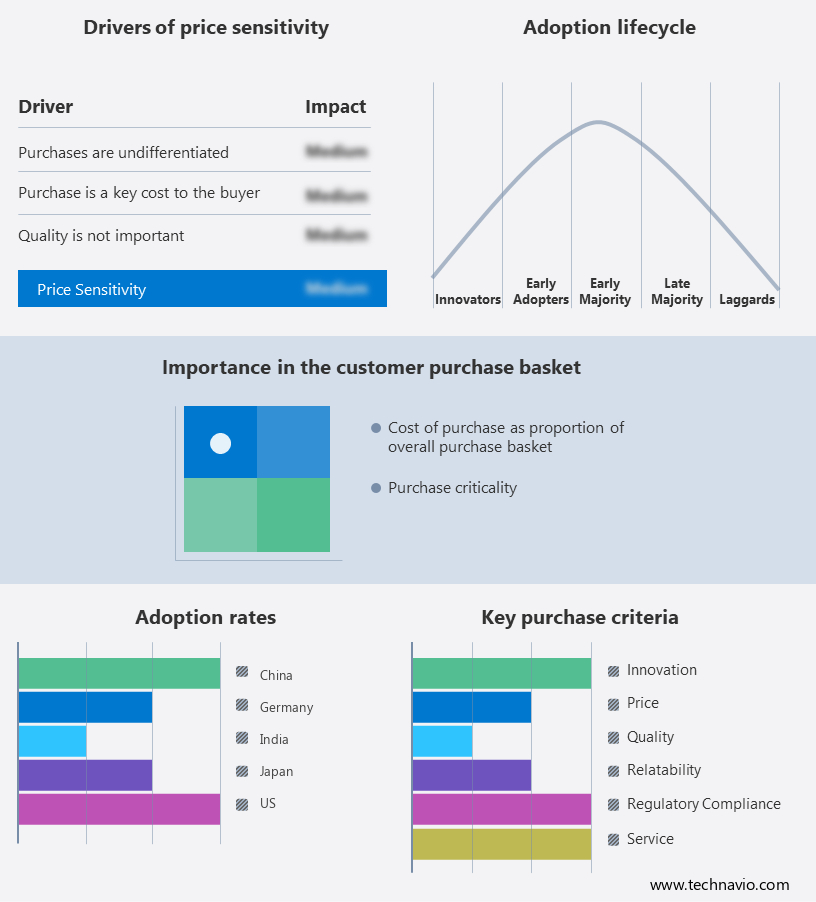
        Exclusive Customer Landscape

        The niobium market forecasting report includes the adoption lifecycle of the market, covering from the innovator’s stage to the laggard’s stage. It focuses on adoption rates in different regions based on penetration. Furthermore, the niobium market report also includes key purchase criteria and drivers of price sensitivity to help companies evaluate and develop their market growth analysis strategies.

        Niobium Market Share by Geography

         Customer Landscape

        Key Companies & Market Insights

        Companies are implementing various strategies, such as strategic alliances, niobium market forecast, partnerships, mergers and acquisitions, geographical expansion, and product/service launches, to enhance their presence In the industry.

        Accumet Materials Co. - Niobium is produced through electron beam float zone refining techniques in a high vacuum environment. This process ensures the niobium is of the highest purity and quality. The refining method utilizes an electron beam to melt and solidify the material, resulting in a defect-free crystal structure. This advanced refining technique is essential for the production of niobium used in various high-performance applications, such as superconductors and alloys for aerospace and defense industries. The company's commitment to using this refining technique underscores its dedication to delivering top-tier niobium products to the global market.

        The industry research and growth report includes detailed analyses of the competitive landscape of the market and information about key companies, including:

        • Accumet Materials Co.
        • Admat Inc.
        • ALL METAL SALES, INC.
        • ARA-T Advance GmbH
        • Aritech Chemazone Pvt. Ltd.
        • China Molybdenum Co. Ltd.
        • Companhia Brasileira de Metalurgia e Mineracao
        • Edgetech Industries LLC
        • Excel Metal and Engg Industries
        • Global Advanced Metals Pty Ltd.
        • Globe Metals and Mining Ltd.
        • H.C. Starck Solutions
        • JX Metals Corp.
        • Magris Performance Materials Inc.
        • Otto Chemie Pvt. Ltd.
        • Plansee SE
        • Shree Bajrang Sales (p) Ltd.
        • Wagener Elektrische Antriebstechnik GmbH
        • Grondmet GmbH
        • Manhar Metal Supply Corp.

        Qualitative and quantitative analysis of companies has been conducted to help clients understand the wider business environment as well as the strengths and weaknesses of key industry players. Data is qualitatively analyzed to categorize companies as pure play, category-focused, industry-focused, and diversified; it is quantitatively analyzed to categorize companies as dominant, leading, strong, tentative, and weak.

        Research Analyst Overview

        Niobium is a critical non-ferrous metal known for its exceptional physical properties, making it an essential element in various industries. This strategic metal is primarily used as an alloying agent in steel and superalloys, enhancing their mechanical qualities, such as strength, toughness, and corrosion resistance. The demand for niobium is driven by several sectors, including transportation, infrastructure, and new-age technologies. The transportation sector utilizes niobium In the production of high-strength steel for heavy machinery, railway tracks, and pressure vessels. In the infrastructure sector, niobium is employed In the construction of bridges, buildings, hangars, stadiums, and other large-scale projects. The growing adoption of electric vehicles and renewable energy sources has significantly increased the demand for niobium In the production of lithium-ion batteries.

        These batteries require high-performance materials to ensure optimal energy density, longevity, and safety. Niobium's unique properties make it an ideal choice for these applications. Moreover, niobium is a crucial component in superalloys, which are widely used In the aerospace and defense industries for manufacturing jet engine components, rocket subassemblies, and other high-performance materials. The demand for these materials is expected to grow as the global defense and aerospace sectors expand. Niobium is also used in various industrial applications, such as In the production of heat-resisting materials for combustion equipment, air frame systems, and turbo charger systems. Additionally, it is used In the energy sector for power generation facilities, both fossil fuel-based and renewable, as well as In the manufacturing of superconducting magnets and alloys for various industrial applications.

        The market is influenced by several factors, including price volatility, geopolitical events, economic conditions, and regulatory changes. Major producers of niobium include Horwin Brasil, Telex Metals, and other mining companies. The availability and pricing of niobium ore resources, such as pyrochlore, columbite, and other minerals, also impact the market dynamics. The demand for niobium is expected to grow as the infrastructure sector continues to expand, and the automotive industry shifts towards lightweight materials and improved fuel efficiency. Additionally, the increasing adoption of new-age technologies, such as nuclear fusion projects, particle accelerators, and high-performance batteries, is expected to drive the demand for niobium in various industries.

        In conclusion, niobium is a strategic metal with diverse applications in various industries, including transportation, infrastructure, and new-age technologies. Its unique physical properties make it an essential component In the production of high-performance materials, such as superalloys, lithium-ion batteries, and other advanced materials. The market is influenced by several factors, including geopolitical events, economic conditions, and regulatory changes, making it a dynamic and evolving market.

        Market Scope

        Report Coverage

        Details

        Page number

        158

        Base year

        2023

        Historic period

        2018-2022

        Forecast period

        2024-2028

        Growth momentum & CAGR

        Accelerate at a CAGR of 5%

        Market growth 2024-2028

        USD 481.34 million

        Market structure

        Fragmented

        YoY growth 2023-2024(%)

        4.5

        Key countries

        US, China, India, Japan, and Germany

        Competitive landscape

        Leading Companies, Market Positioning of Companies, Competitive Strategies, and Industry Risks

        Request Free Sample

        What are the Key Data Covered in this Niobium Market Research and Growth Report?

        • CAGR of the Niobium industry during the forecast period
        • Detailed information on factors that will drive the growth and forecasting between 2024 and 2028
        • Precise estimation of the size of the market and its contribution of the industry in focus to the parent market
        • Accurate predictions about upcoming growth and trends and changes in consumer behaviour
        • Growth of the market across APAC, North America, Europe, South America, and Middle East and Africa
        • Thorough analysis of the market’s competitive landscape and detailed information about companies
        • Comprehensive analysis of factors that will challenge the niobium market growth of industry companies

        We can help! Our analysts can customize this niobium market research report to meet your requirements.

        Get in touch


        1 Executive Summary

        • 1.1 Market overview
          • Exhibit 01: Executive Summary – Chart on Market Overview
          • Exhibit 02: Executive Summary – Data Table on Market Overview
          • Exhibit 03: Executive Summary – Chart on Global Market Characteristics
          • Exhibit 04: Executive Summary – Chart on Market by Geography
          • Exhibit 05: Executive Summary – Chart on Market Segmentation by End-user
          • Exhibit 06: Executive Summary – Chart on Market Segmentation by Application
          • Exhibit 07: Executive Summary – Chart on Incremental Growth
          • Exhibit 08: Executive Summary – Data Table on Incremental Growth
          • Exhibit 09: Executive Summary – Chart on Vendor Market Positioning

        2 Market Landscape

        • 2.1 Market ecosystem
          • Exhibit 10: Parent market
          • Exhibit 11: Market Characteristics

        3 Market Sizing

        • 3.1 Market definition
          • Exhibit 12: Offerings of vendors included in the market definition
        • 3.2 Market segment analysis
          • Exhibit 13: Market segments
        • 3.3 Market size 2023
          • 3.4 Market outlook: Forecast for 2023-2028
            • Exhibit 14: Chart on Global - Market size and forecast 2023-2028 ($ million)
            • Exhibit 15: Data Table on Global - Market size and forecast 2023-2028 ($ million)
            • Exhibit 16: Chart on Global Market: Year-over-year growth 2023-2028 (%)
            • Exhibit 17: Data Table on Global Market: Year-over-year growth 2023-2028 (%)

          4 Historic Market Size

          • 4.1 Global niobium market 2018 - 2022
            • Exhibit 18: Historic Market Size – Data Table on global niobium market 2018 - 2022 ($ million)
          • 4.2 End-User Segment Analysis 2018 - 2022
            • Exhibit 19: Historic Market Size – End-User Segment 2018 - 2022 ($ million)
          • 4.3 Application Segment Analysis 2018 - 2022
            • Exhibit 20: Historic Market Size – Application Segment 2018 - 2022 ($ million)
          • 4.4 Geography Segment Analysis 2018 - 2022
            • Exhibit 21: Historic Market Size – Geography Segment 2018 - 2022 ($ million)
          • 4.5 Country Segment Analysis 2018 - 2022
            • Exhibit 22: Historic Market Size – Country Segment 2018 - 2022 ($ million)

          5 Five Forces Analysis

          • 5.1 Five forces summary
            • Exhibit 23: Five forces analysis - Comparison between 2023 and 2028
          • 5.2 Bargaining power of buyers
            • Exhibit 24: Chart on Bargaining power of buyers – Impact of key factors 2023 and 2028
          • 5.3 Bargaining power of suppliers
            • Exhibit 25: Bargaining power of suppliers – Impact of key factors in 2023 and 2028
          • 5.4 Threat of new entrants
            • Exhibit 26: Threat of new entrants – Impact of key factors in 2023 and 2028
          • 5.5 Threat of substitutes
            • Exhibit 27: Threat of substitutes – Impact of key factors in 2023 and 2028
          • 5.6 Threat of rivalry
            • Exhibit 28: Threat of rivalry – Impact of key factors in 2023 and 2028
          • 5.7 Market condition
            • Exhibit 29: Chart on Market condition - Five forces 2023 and 2028

          6 Market Segmentation by End-user

          • 6.1 Market segments
            • Exhibit 30: Chart on End-user - Market share 2023-2028 (%)
            • Exhibit 31: Data Table on End-user - Market share 2023-2028 (%)
          • 6.2 Comparison by End-user
            • Exhibit 32: Chart on Comparison by End-user
            • Exhibit 33: Data Table on Comparison by End-user
          • 6.3 Construction - Market size and forecast 2023-2028
            • Exhibit 34: Chart on Construction - Market size and forecast 2023-2028 ($ million)
            • Exhibit 35: Data Table on Construction - Market size and forecast 2023-2028 ($ million)
            • Exhibit 36: Chart on Construction - Year-over-year growth 2023-2028 (%)
            • Exhibit 37: Data Table on Construction - Year-over-year growth 2023-2028 (%)
          • 6.4 Automotive and transportation - Market size and forecast 2023-2028
            • Exhibit 38: Chart on Automotive and transportation - Market size and forecast 2023-2028 ($ million)
            • Exhibit 39: Data Table on Automotive and transportation - Market size and forecast 2023-2028 ($ million)
            • Exhibit 40: Chart on Automotive and transportation - Year-over-year growth 2023-2028 (%)
            • Exhibit 41: Data Table on Automotive and transportation - Year-over-year growth 2023-2028 (%)
          • 6.5 Oil and gas - Market size and forecast 2023-2028
            • Exhibit 42: Chart on Oil and gas - Market size and forecast 2023-2028 ($ million)
            • Exhibit 43: Data Table on Oil and gas - Market size and forecast 2023-2028 ($ million)
            • Exhibit 44: Chart on Oil and gas - Year-over-year growth 2023-2028 (%)
            • Exhibit 45: Data Table on Oil and gas - Year-over-year growth 2023-2028 (%)
          • 6.6 Aerospace and defense - Market size and forecast 2023-2028
            • Exhibit 46: Chart on Aerospace and defense - Market size and forecast 2023-2028 ($ million)
            • Exhibit 47: Data Table on Aerospace and defense - Market size and forecast 2023-2028 ($ million)
            • Exhibit 48: Chart on Aerospace and defense - Year-over-year growth 2023-2028 (%)
            • Exhibit 49: Data Table on Aerospace and defense - Year-over-year growth 2023-2028 (%)
          • 6.7 Others - Market size and forecast 2023-2028
            • Exhibit 50: Chart on Others - Market size and forecast 2023-2028 ($ million)
            • Exhibit 51: Data Table on Others - Market size and forecast 2023-2028 ($ million)
            • Exhibit 52: Chart on Others - Year-over-year growth 2023-2028 (%)
            • Exhibit 53: Data Table on Others - Year-over-year growth 2023-2028 (%)
          • 6.8 Market opportunity by End-user
            • Exhibit 54: Market opportunity by End-user ($ million)
            • Exhibit 55: Data Table on Market opportunity by End-user ($ million)

          7 Market Segmentation by Application

          • 7.1 Market segments
            • Exhibit 56: Chart on Application - Market share 2023-2028 (%)
            • Exhibit 57: Data Table on Application - Market share 2023-2028 (%)
          • 7.2 Comparison by Application
            • Exhibit 58: Chart on Comparison by Application
            • Exhibit 59: Data Table on Comparison by Application
          • 7.3 Steel manufacturing - Market size and forecast 2023-2028
            • Exhibit 60: Chart on Steel manufacturing - Market size and forecast 2023-2028 ($ million)
            • Exhibit 61: Data Table on Steel manufacturing - Market size and forecast 2023-2028 ($ million)
            • Exhibit 62: Chart on Steel manufacturing - Year-over-year growth 2023-2028 (%)
            • Exhibit 63: Data Table on Steel manufacturing - Year-over-year growth 2023-2028 (%)
          • 7.4 Superalloys - Market size and forecast 2023-2028
            • Exhibit 64: Chart on Superalloys - Market size and forecast 2023-2028 ($ million)
            • Exhibit 65: Data Table on Superalloys - Market size and forecast 2023-2028 ($ million)
            • Exhibit 66: Chart on Superalloys - Year-over-year growth 2023-2028 (%)
            • Exhibit 67: Data Table on Superalloys - Year-over-year growth 2023-2028 (%)
          • 7.5 Others - Market size and forecast 2023-2028
            • Exhibit 68: Chart on Others - Market size and forecast 2023-2028 ($ million)
            • Exhibit 69: Data Table on Others - Market size and forecast 2023-2028 ($ million)
            • Exhibit 70: Chart on Others - Year-over-year growth 2023-2028 (%)
            • Exhibit 71: Data Table on Others - Year-over-year growth 2023-2028 (%)
          • 7.6 Market opportunity by Application
            • Exhibit 72: Market opportunity by Application ($ million)
            • Exhibit 73: Data Table on Market opportunity by Application ($ million)

          8 Customer Landscape

          • 8.1 Customer landscape overview
            • Exhibit 74: Analysis of price sensitivity, lifecycle, customer purchase basket, adoption rates, and purchase criteria

          9 Geographic Landscape

          • 9.1 Geographic segmentation
            • Exhibit 75: Chart on Market share by geography 2023-2028 (%)
            • Exhibit 76: Data Table on Market share by geography 2023-2028 (%)
          • 9.2 Geographic comparison
            • Exhibit 77: Chart on Geographic comparison
            • Exhibit 78: Data Table on Geographic comparison
          • 9.3 APAC - Market size and forecast 2023-2028
            • Exhibit 79: Chart on APAC - Market size and forecast 2023-2028 ($ million)
            • Exhibit 80: Data Table on APAC - Market size and forecast 2023-2028 ($ million)
            • Exhibit 81: Chart on APAC - Year-over-year growth 2023-2028 (%)
            • Exhibit 82: Data Table on APAC - Year-over-year growth 2023-2028 (%)
          • 9.4 North America - Market size and forecast 2023-2028
            • Exhibit 83: Chart on North America - Market size and forecast 2023-2028 ($ million)
            • Exhibit 84: Data Table on North America - Market size and forecast 2023-2028 ($ million)
            • Exhibit 85: Chart on North America - Year-over-year growth 2023-2028 (%)
            • Exhibit 86: Data Table on North America - Year-over-year growth 2023-2028 (%)
          • 9.5 Europe - Market size and forecast 2023-2028
            • Exhibit 87: Chart on Europe - Market size and forecast 2023-2028 ($ million)
            • Exhibit 88: Data Table on Europe - Market size and forecast 2023-2028 ($ million)
            • Exhibit 89: Chart on Europe - Year-over-year growth 2023-2028 (%)
            • Exhibit 90: Data Table on Europe - Year-over-year growth 2023-2028 (%)
          • 9.6 South America - Market size and forecast 2023-2028
            • Exhibit 91: Chart on South America - Market size and forecast 2023-2028 ($ million)
            • Exhibit 92: Data Table on South America - Market size and forecast 2023-2028 ($ million)
            • Exhibit 93: Chart on South America - Year-over-year growth 2023-2028 (%)
            • Exhibit 94: Data Table on South America - Year-over-year growth 2023-2028 (%)
          • 9.7 Middle East and Africa - Market size and forecast 2023-2028
            • Exhibit 95: Chart on Middle East and Africa - Market size and forecast 2023-2028 ($ million)
            • Exhibit 96: Data Table on Middle East and Africa - Market size and forecast 2023-2028 ($ million)
            • Exhibit 97: Chart on Middle East and Africa - Year-over-year growth 2023-2028 (%)
            • Exhibit 98: Data Table on Middle East and Africa - Year-over-year growth 2023-2028 (%)
          • 9.8 US - Market size and forecast 2023-2028
            • Exhibit 99: Chart on US - Market size and forecast 2023-2028 ($ million)
            • Exhibit 100: Data Table on US - Market size and forecast 2023-2028 ($ million)
            • Exhibit 101: Chart on US - Year-over-year growth 2023-2028 (%)
            • Exhibit 102: Data Table on US - Year-over-year growth 2023-2028 (%)
          • 9.9 China - Market size and forecast 2023-2028
            • Exhibit 103: Chart on China - Market size and forecast 2023-2028 ($ million)
            • Exhibit 104: Data Table on China - Market size and forecast 2023-2028 ($ million)
            • Exhibit 105: Chart on China - Year-over-year growth 2023-2028 (%)
            • Exhibit 106: Data Table on China - Year-over-year growth 2023-2028 (%)
          • 9.10 India - Market size and forecast 2023-2028
            • Exhibit 107: Chart on India - Market size and forecast 2023-2028 ($ million)
            • Exhibit 108: Data Table on India - Market size and forecast 2023-2028 ($ million)
            • Exhibit 109: Chart on India - Year-over-year growth 2023-2028 (%)
            • Exhibit 110: Data Table on India - Year-over-year growth 2023-2028 (%)
          • 9.11 Germany - Market size and forecast 2023-2028
            • Exhibit 111: Chart on Germany - Market size and forecast 2023-2028 ($ million)
            • Exhibit 112: Data Table on Germany - Market size and forecast 2023-2028 ($ million)
            • Exhibit 113: Chart on Germany - Year-over-year growth 2023-2028 (%)
            • Exhibit 114: Data Table on Germany - Year-over-year growth 2023-2028 (%)
          • 9.12 Japan - Market size and forecast 2023-2028
            • Exhibit 115: Chart on Japan - Market size and forecast 2023-2028 ($ million)
            • Exhibit 116: Data Table on Japan - Market size and forecast 2023-2028 ($ million)
            • Exhibit 117: Chart on Japan - Year-over-year growth 2023-2028 (%)
            • Exhibit 118: Data Table on Japan - Year-over-year growth 2023-2028 (%)
          • 9.13 Market opportunity by geography
            • Exhibit 119: Market opportunity by geography ($ million)
            • Exhibit 120: Data Tables on Market opportunity by geography ($ million)

          10 Drivers, Challenges, and Trends

          • 10.1 Market drivers
            • 10.2 Market challenges
              • 10.3 Impact of drivers and challenges
                • Exhibit 121: Impact of drivers and challenges in 2023 and 2028
              • 10.4 Market trends

                11 Vendor Landscape

                • 11.1 Overview
                  • 11.2 Vendor landscape
                    • Exhibit 122: Overview on Criticality of inputs and Factors of differentiation
                  • 11.3 Landscape disruption
                    • Exhibit 123: Overview on factors of disruption
                  • 11.4 Industry risks
                    • Exhibit 124: Impact of key risks on business

                  12 Vendor Analysis

                  • 12.1 Vendors covered
                    • Exhibit 125: Vendors covered
                  • 12.2 Market positioning of vendors
                    • Exhibit 126: Matrix on vendor position and classification
                  • 12.3 Accumet Materials Co.
                    • Exhibit 127: Accumet Materials Co. - Overview
                    • Exhibit 128: Accumet Materials Co. - Product / Service
                    • Exhibit 129: Accumet Materials Co. - Key offerings
                  • 12.4 Admat Inc.
                    • Exhibit 130: Admat Inc. - Overview
                    • Exhibit 131: Admat Inc. - Product / Service
                    • Exhibit 132: Admat Inc. - Key offerings
                  • 12.5 ALL METAL SALES, INC.
                    • Exhibit 133: ALL METAL SALES, INC. - Overview
                    • Exhibit 134: ALL METAL SALES, INC. - Product / Service
                    • Exhibit 135: ALL METAL SALES, INC. - Key offerings
                  • 12.6 Aritech Chemazone Pvt. Ltd.
                    • Exhibit 136: Aritech Chemazone Pvt. Ltd. - Overview
                    • Exhibit 137: Aritech Chemazone Pvt. Ltd. - Product / Service
                    • Exhibit 138: Aritech Chemazone Pvt. Ltd. - Key offerings
                  • 12.7 China Molybdenum Co. Ltd.
                    • Exhibit 139: China Molybdenum Co. Ltd. - Overview
                    • Exhibit 140: China Molybdenum Co. Ltd. - Product / Service
                    • Exhibit 141: China Molybdenum Co. Ltd. - Key offerings
                  • 12.8 Companhia Brasileira de Metalurgia e Mineracao
                    • Exhibit 142: Companhia Brasileira de Metalurgia e Mineracao - Overview
                    • Exhibit 143: Companhia Brasileira de Metalurgia e Mineracao - Product / Service
                    • Exhibit 144: Companhia Brasileira de Metalurgia e Mineracao - Key offerings
                  • 12.9 Edgetech Industries LLC
                    • Exhibit 145: Edgetech Industries LLC - Overview
                    • Exhibit 146: Edgetech Industries LLC - Product / Service
                    • Exhibit 147: Edgetech Industries LLC - Key offerings
                  • 12.10 Excel Metal and Engg Industries
                    • Exhibit 148: Excel Metal and Engg Industries - Overview
                    • Exhibit 149: Excel Metal and Engg Industries - Product / Service
                    • Exhibit 150: Excel Metal and Engg Industries - Key offerings
                  • 12.11 Global Advanced Metals Pty Ltd.
                    • Exhibit 151: Global Advanced Metals Pty Ltd. - Overview
                    • Exhibit 152: Global Advanced Metals Pty Ltd. - Product / Service
                    • Exhibit 153: Global Advanced Metals Pty Ltd. - Key offerings
                  • 12.12 H.C. Starck Solutions
                    • Exhibit 154: H.C. Starck Solutions - Overview
                    • Exhibit 155: H.C. Starck Solutions - Product / Service
                    • Exhibit 156: H.C. Starck Solutions - Key offerings
                  • 12.13 Magris Performance Materials Inc.
                    • Exhibit 157: Magris Performance Materials Inc. - Overview
                    • Exhibit 158: Magris Performance Materials Inc. - Product / Service
                    • Exhibit 159: Magris Performance Materials Inc. - Key offerings
                  • 12.14 Manhar Metal Supply Corp.
                    • Exhibit 160: Manhar Metal Supply Corp. - Overview
                    • Exhibit 161: Manhar Metal Supply Corp. - Product / Service
                    • Exhibit 162: Manhar Metal Supply Corp. - Key offerings
                  • 12.15 Otto Chemie Pvt. Ltd.
                    • Exhibit 163: Otto Chemie Pvt. Ltd. - Overview
                    • Exhibit 164: Otto Chemie Pvt. Ltd. - Product / Service
                    • Exhibit 165: Otto Chemie Pvt. Ltd. - Key offerings
                  • 12.16 Plansee SE
                    • Exhibit 166: Plansee SE - Overview
                    • Exhibit 167: Plansee SE - Key offerings
                  • 12.17 Shree Bajrang Sales (p) Ltd.
                    • Exhibit 168: Shree Bajrang Sales (p) Ltd. - Overview
                    • Exhibit 169: Shree Bajrang Sales (p) Ltd. - Product / Service
                    • Exhibit 170: Shree Bajrang Sales (p) Ltd. - Key offerings

                  13 Appendix

                  • 13.1 Scope of the report
                    • 13.2 Inclusions and exclusions checklist
                      • Exhibit 171: Inclusions checklist
                      • Exhibit 172: Exclusions checklist
                    • 13.3 Currency conversion rates for US$
                      • Exhibit 173: Currency conversion rates for US$
                    • 13.4 Research methodology
                      • Exhibit 174: Research methodology
                      • Exhibit 175: Validation techniques employed for market sizing
                      • Exhibit 176: Information sources
                    • 13.5 List of abbreviations
                      • Exhibit 177: List of abbreviations

                    Research Methodology

                    Technavio presents a detailed picture of the market by way of study, synthesis, and summation of data from multiple sources. The analysts have presented the various facets of the market with a particular focus on identifying the key industry influencers. The data thus presented is comprehensive, reliable, and the result of extensive research, both primary and secondary.

                    INFORMATION SOURCES

                    Primary sources

                    • Manufacturers and suppliers
                    • Channel partners
                    • Industry experts
                    • Strategic decision makers

                    Secondary sources

                    • Industry journals and periodicals
                    • Government data
                    • Financial reports of key industry players
                    • Historical data
                    • Press releases

                    DATA ANALYSIS

                    Data Synthesis

                    • Collation of data
                    • Estimation of key figures
                    • Analysis of derived insights

                    Data Validation

                    • Triangulation with data models
                    • Reference against proprietary databases
                    • Corroboration with industry experts

                    REPORT WRITING

                    Qualitative

                    • Market drivers
                    • Market challenges
                    • Market trends
                    • Five forces analysis

                    Quantitative

                    • Market size and forecast
                    • Market segmentation
                    • Geographical insights
                    • Competitive landscape

                    Interested in this report?

                    Get your sample now to see our research methodology and insights!

                    Download Now

                    Frequently Asked Questions

                    Niobium market growth will increase by $ 481.34 mn during 2024-2028.

                    The Niobium market is expected to grow at a CAGR of 5% during 2024-2028.

                    Niobium market is segmented by End-user( Construction, Automotive and transportation, Oil and gas, Aerospace and defense, Others) Application( Steel manufacturing, Superalloys, Others)

                    Accumet Materials Co., Admat Inc., ALL METAL SALES, INC., ARA-T Advance GmbH, Aritech Chemazone Pvt. Ltd., China Molybdenum Co. Ltd., Companhia Brasileira de Metalurgia e Mineracao, Edgetech Industries LLC, Excel Metal and Engg Industries, Global Advanced Metals Pty Ltd., Globe Metals and Mining Ltd., H.C. Starck Solutions, JX Metals Corp., Magris Performance Materials Inc., Otto Chemie Pvt. Ltd., Plansee SE, Shree Bajrang Sales (p) Ltd., Wagener Elektrische Antriebstechnik GmbH, Grondmet GmbH, Manhar Metal Supply Corp. are a few of the key vendors in the Niobium market.

                    APAC will register the highest growth rate of 40% among the other regions. Therefore, the Niobium market in APAC is expected to garner significant business opportunities for the vendors during the forecast period.

                    US, China, India, Japan, Germany

                    • Increased growth in steel productionThe global niobium market is experiencing significant growth is the driving factor this market.
                    • largely attributed to the increased production of steel worldwide. Niobium is the driving factor this market.
                    • a chemical element commonly used as an alloying agent is the driving factor this market.
                    • is widely utilized in the manufacturing process of high-strength is the driving factor this market.
                    • low-alloy (HSLA) steels. One of the primary factors driving the niobium market is the growing demand for HSLA steels in various industries is the driving factor this market.
                    • such as automotive is the driving factor this market.
                    • construction is the driving factor this market.
                    • and infrastructure. These steels offer enhanced mechanical properties is the driving factor this market.
                    • including high tensile strength is the driving factor this market.
                    • improved formability is the driving factor this market.
                    • and resistance to corrosion is the driving factor this market.
                    • making them ideal for applications requiring lightweight yet durable materials. As these industries continue to expand is the driving factor this market.
                    • the demand for niobium in steel production is expected to soar during the forecast period. The construction sector is the driving factor this market.
                    • particularly in emerging economies is the driving factor this market.
                    • is witnessing rapid growth is the driving factor this market.
                    • resulting in an increased need for steel and is the driving factor this market.
                    • therefore is the driving factor this market.
                    • niobium. Developing countries are increasingly investing in infrastructure projects driven by urbanization and population growth. For instance is the driving factor this market.
                    • extensive construction activities related to residential and commercial buildings is the driving factor this market.
                    • bridges is the driving factor this market.
                    • and highways are fueling the demand for niobium-infused HSLA steels. Moreover is the driving factor this market.
                    • geopolitical factors are also contributing to the surge in steel production and subsequently boosting the niobium market. Several governments are focusing on infrastructure development as a means to drive economic growth and stimulate recovery. For example is the driving factor this market.
                    • while global steel production fell by 4.2% in 2022 is the driving factor this market.
                    • Indias completed steel production grew by more than 6%. In FY 2024 is the driving factor this market.
                    • total steel consumption is the driving factor this market.
                    • including exports is the driving factor this market.
                    • is expected to be between 132 million and 135 million tons. Large-scale projects launched in regions such as Asia is the driving factor this market.
                    • Africa is the driving factor this market.
                    • and South America are propelling the demand for niobium-enhanced steels. The rising demand for HSLA steels in various industries is the driving factor this market.
                    • coupled with the expansion of the construction sector and infrastructure projects is the driving factor this market.
                    • is driving the need for niobium is the driving factor this market.
                    • which in turn will drive the growth of the global niobium market during the forecast period. is the driving factor this market.

                    The Niobium market vendors should focus on grabbing business opportunities from the Construction segment as it accounted for the largest market share in the base year.
                    RIA - Research AI Assistant
                    Ask RIA