Nitrogenous Fertilizer Market by Type, Product, and Geography - Forecast and Analysis 2023-2027

Nitrogenous Fertilizer Market by Type, Product, and Geography - Forecast and Analysis 2023-2027

Published: Jan 2023 172 Pages SKU: IRTNTR72431

Market Overview at a Glance

$32994.82 thousand t
Market Opportunity
4.67%
CAGR
3.92
YoY growth 2022-2023(%)

Nitrogenous Fertilizer Market Size 2023-2027 

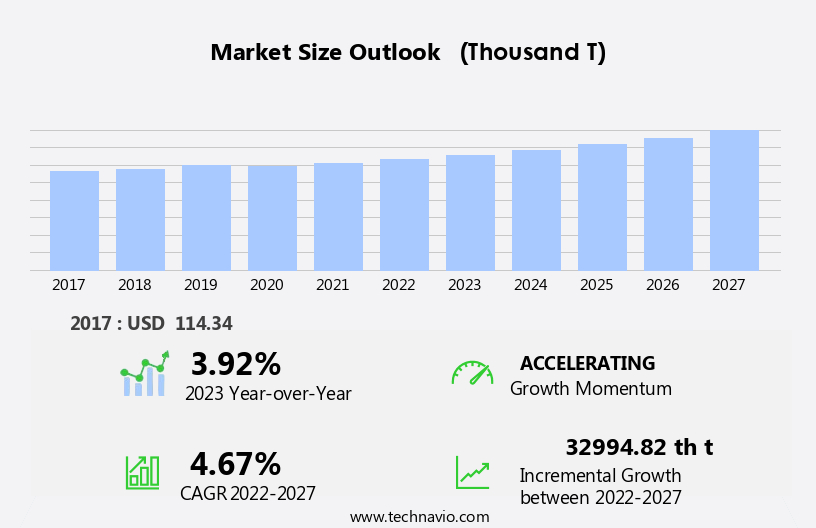
The nitrogenous fertilizer market size is forecast to increase by 32.99 thousand t at a CAGR of 4.67% between 2022 and 2027.

  • The market is experiencing significant growth due to several key trends. The increasing demand from developing countries, particularly in Asia Pacific, is driving market growth. Additionally, the adoption of precision farming techniques is boosting the market, as farmers seek to optimize fertilizer usage and improve crop yields. 
  • However, health concerns regarding the use of nitrogenous fertilizers, including potential negative environmental impacts and risks to human health, present challenges to market growth. These issues are prompting researchers and farmers to explore alternative fertilizer sources and application methods to mitigate risks and promote sustainable agriculture. Overall, the market is expected to continue expanding, driven by these trends and the ongoing need to increase agricultural productivity.

What will be the Size of the Nitrogenous Fertilizer Market During the Forecast Period?

Nitrogenous Fertilizer Market Size

 Request Free Sample

  • The market plays a crucial role in enhancing agricultural productivity by supplying essential nitrogen nutrients to plants. Nitrogen, a key component of amino acids and nucleic acids, is integral to photosynthesis, the process by which plants convert light energy into food. Nitrogenous fertilizers, such as ammonium nitrate, ammonium sulphate, calcium ammonium nitrate, and urea, provide this vital nutrient to the soil, promoting shoot development, flower distinction, and fruit quality. Nitrogen is a fundamental element for protoplasm, the living substance in plant cells. Its presence in the soil enhances the crop's yielding potential by improving root growth and nutrient uptake.

    The nitrogenous fertilizer industry has witnessed significant growth due to the increasing demand for higher crop output and improved soil nutrients. Farmland management practices, such as precision farming and irrigation techniques like drip irrigation and sprinkler irrigation, have further boosted the demand for nitrogenous fertilizers. The green manure approach, using animal manure as a natural source of nitrogen, is another sustainable solution gaining popularity. Investment in research and development to create efficient nitrogenous fertilizers and innovative application methods is driving the growth of the nitrogen fertilizer industry. Corteva Agriscience, among other key players, is focusing on developing nitrogen use efficiency technologies to minimize losses and optimize crop nutrient uptake in the root zone.

    UAN treatments and the root zone's optimal nitrogen availability are essential considerations for farmers to maximize crop production and maintain optimal soil health.

How is this Nitrogenous Fertilizer Industry segmented and which is the largest segment?

The  nitrogenous fertilizer industry research report provides comprehensive data (region-wise segment analysis), with forecasts and estimates in "USD th t" for the period 2023-2027, as well as historical data from 2017-2021 for the following segments.
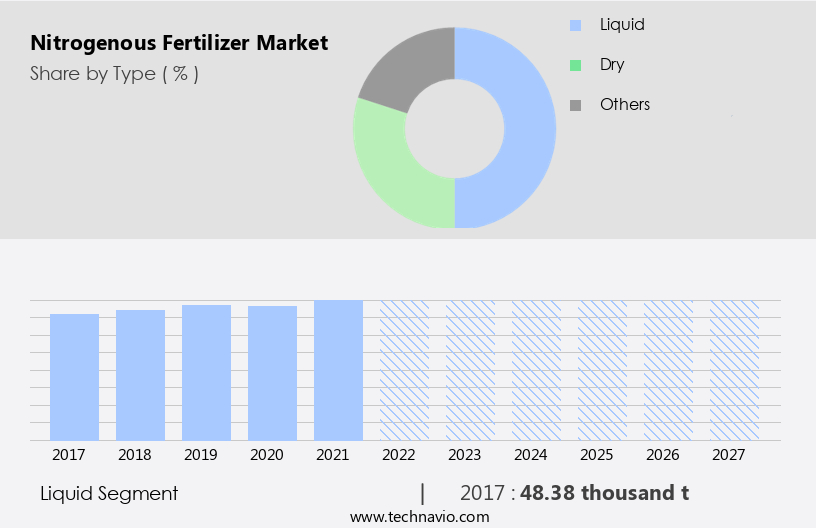
  • Type
    • Liquid
    • Dry
    • Others
  • Product
    • Urea
    • NPK
    • CAN and AN
    • DAP and MAP
    • Others
  • Geography
    • APAC
      • China
      • India
    • North America
      • US
    • Europe
      • Germany
    • Middle East and Africa
    • South America
      • Brazil

By Type Insights

  • The liquid segment is estimated to witness significant growth during the forecast period.

The market is experiencing significant growth, particularly in the liquid segment. This segment is anticipated to expand at a rapid pace due to increasing demand for high-efficiency fertilizers and environmental concerns. The liquid the market's growth is driven by the rising adoption of precision farming and protected agriculture, which require fertilizers with higher quality and greater productivity. However, the market's expansion is restrained by high installation and storage costs, as well as the need for special handling and storage facilities for liquid fertilizers. Corteva Agriscience and other key players in the industry are focusing on developing UAN treatments to improve crop uptake in the root zone, addressing the market's challenges and meeting the growing demand for efficient fertilizer solutions.

Nitrogenous Fertilizer Market Size

Get a glance at the share of various segments. Request Free Sample

The Liquid segment was valued at 48,376.21 thousand t in 2017 and showed a gradual increase during the forecast period.

Regional Analysis

  • APAC is estimated to contribute 57% to the growth of the global market during the forecast period.

Technavio's analysts have elaborately explained the regional trends and drivers that shape the market during the forecast period.

Nitrogenous Fertilizer Market Share by Geography

For more insights on the market share of various regions, Request Free Sample

The market in Asia Pacific is projected to experience significant growth during the forecast period. Countries such as China, India, Indonesia, and Pakistan exhibit a high demand for nitrogenous fertilizers due to their extensive agricultural production. Nitrogenous and potassium-based water-soluble fertilizers are commonly used to cultivate cereals, pulses, fruits, and vegetables. Urea- and NPK-based nitrogenous fertilizers are primarily utilized for rice, maize, fruits, and vegetable production. India, which is one of the world's largest consumers of fertilizers, consumes over 55 million metric tons annually. Despite a decrease in the cultivated area over the past five years, agriculture production in India has continued to increase, according to the Department of Agriculture, Cooperation and Farmers Welfare.

Nitrogenous fertilizers play a crucial role in enhancing crop yield and productivity. Urea, ammonium nitrate, ammonium sulfate, calcium ammonium nitrate, and other nitrogenous fertilizers are widely used to improve soil fertility and nutrient content.

Market Dynamics

Our nitrogenous fertilizer market researchers analyzed the data with 2022 as the base year, along with the key drivers, trends, and challenges. A holistic analysis of drivers will help companies refine their marketing strategies to gain a competitive advantage.

What are the key market drivers leading to the rise in adoption of Nitrogenous Fertilizer Industry?

Increase in demand from developing countries is the key driver of the market.

  • The market is experiencing significant growth due to the increasing demand for fertilizers in countries like China, India, Brazil, Indonesia, and Pakistan. This growth can be attributed to the expanding agricultural sector in these nations, aimed at meeting the rising food demands driven by population growth and increasing disposable wealth. Nitrogenous fertilizers, such as ammonium nitrate, ammonium sulfate, calcium ammonium nitrate, urea, and others, are essential for plant growth as they provide nitrogen, a key nutrient for photosynthesis. These fertilizers enhance shoot development, flower distinction, and fruit quality, leading to increased crop output and improved soil nutrients. The adoption of technology-driven irrigation methods, including drip irrigation and sprinkler irrigation, is also fueling the demand for nitrogenous fertilizers.

    In precision farming, nitrogenous fertilizers are applied based on the soil profile's nutritional balance, ensuring optimal crop uptake. The market is further driven by the need for nutritional balance in the soil to meet the global food demand and maintain food safety. APAC is a significant consumer of fertilizers, with the increasing population and per capita income contributing to the demand for food and agricultural products. Nitrogenous fertilizers are an integral part of modern farming practices, ensuring superior performance and yield. The market is expected to grow further with advancements in technology, such as soil sensors, drones, and vertical farming, and the development of specialty fertilizers, micronutrient fertilizers, and methylene urea.

    However, concerns over greenhouse gas emissions from nitrogen fertilizers and the growing trend towards organic food production may pose challenges to the market's growth.

What are the market trends shaping the Nitrogenous Fertilizer Industry?

Adoption of precision farming is the upcoming trend in the market.

  • Nitrogenous fertilizers play a crucial role in modern agriculture, particularly in the context of precision farming. This farming technique optimizes the use of resources, including nitrogenous fertilizers, to enhance crop production on limited arable land. Photosynthesis, the process by which plants convert carbon dioxide and water into energy, requires nitrogen, a key element found in protoplasm. Nitrogenous fertilizers, such as ammonium nitrate, ammonium sulfate, calcium ammonium nitrate, urea, and others, provide this essential nutrient to the soil. Animal manure and organic methods are alternative sources of nitrogen, but they may not provide the nutritional balance required for optimal shoot development, flower distinction, and fruit quality.

    Commercial nitrogenous fertilizers offer farmers a reliable and efficient solution to meet their crop's yielding potential. The nitrogenous fertilizer industry caters to various crops, including cereals & grains, oilseeds & pulses, and fruits & vegetables. Precision farming tools like drip irrigation and sprinkler irrigation facilitate the efficient application of nitrogenous fertilizers, ensuring optimal crop uptake in the root zone. Digital marketing and precision farming tools enable farmers to monitor soil nutrients and adjust fertilizer applications accordingly. However, the use of nitrogenous fertilizers also raises concerns regarding food safety, global need, and environmental impact, including greenhouse gas emissions. Biofertilizers and micronutrient fertilizers offer sustainable alternatives to synthetic chemicals.

    The adoption of precision farming techniques and the shift towards organic food production are expected to influence the market. The nitrogen fertilizer industry continues to innovate, with new products like methylene urea, yeast-coated fertilizer, and urea ammonium nitrate treatments. The market is driven by food demand, population growth, and the need to maximize farmland productivity. The industry faces challenges such as groundwater depletion, stream pollution, and the need for investment in sustainable farming practices. The market is expected to grow as farmers seek to maintain soil fertility and maximize crop output while minimizing environmental impact.

What challenges does Nitrogenous Fertilizer Industry face during the growth?

Health concerns regarding use of nitrogenous fertilizers is a key challenge affecting the industry growth.

  • Nitrogenous fertilizers play a crucial role in enhancing crop productivity by supplying essential nutrients, particularly nitrogen, to the soil. Photosynthesis, the process by which plants convert carbon dioxide into food, requires nitrogen for the production of amino acids in protoplasm. Nitrogenous fertilizers, such as ammonium nitrate, ammonium sulfate, calcium ammonium nitrate, urea, and others, are widely used to supplement the nutritional balance of the soil. However, the excessive use of these fertilizers can lead to environmental concerns. Nitrogen from fertilizers can leach into groundwater and streams, contributing to eutrophication and harming aquatic life. Moreover, the production and application of nitrogenous fertilizers contribute to greenhouse gas emissions.

    Farmers rely on nitrogenous fertilizers to maximize crop output, especially for cereals & grains, oilseeds & pulses, fruits & vegetables, and other food crops. The global population's increasing food demand and limited arable land necessitate the use of commercial fertilizers. However, there is a growing trend towards organic farming and the use of biofertilizers, which offer a more sustainable and eco-friendly alternative. The nitrogen fertilizer industry is continuously innovating, with advancements in precision farming, drip irrigation, and sprinkler irrigation, among others. Digital marketing and precision farming tools are also being used to optimize crop uptake and reduce waste.

    Methylene urea, a slow-release nitrogen fertilizer, and yeast-coated fertilizers are some of the recent developments in the industry. Despite the benefits, nitrogenous fertilizers' environmental impact and potential health risks cannot be ignored. It is essential to ensure food safety and maintain soil fertility through sustainable farming practices. The use of soil sensors, drones, and other advanced technologies can help monitor soil nutrients and optimize fertilizer application. Investment in research and development of specialty fertilizers and micronutrient fertilizers can also help address nutrient deficiencies and reduce the reliance on synthetic chemicals.

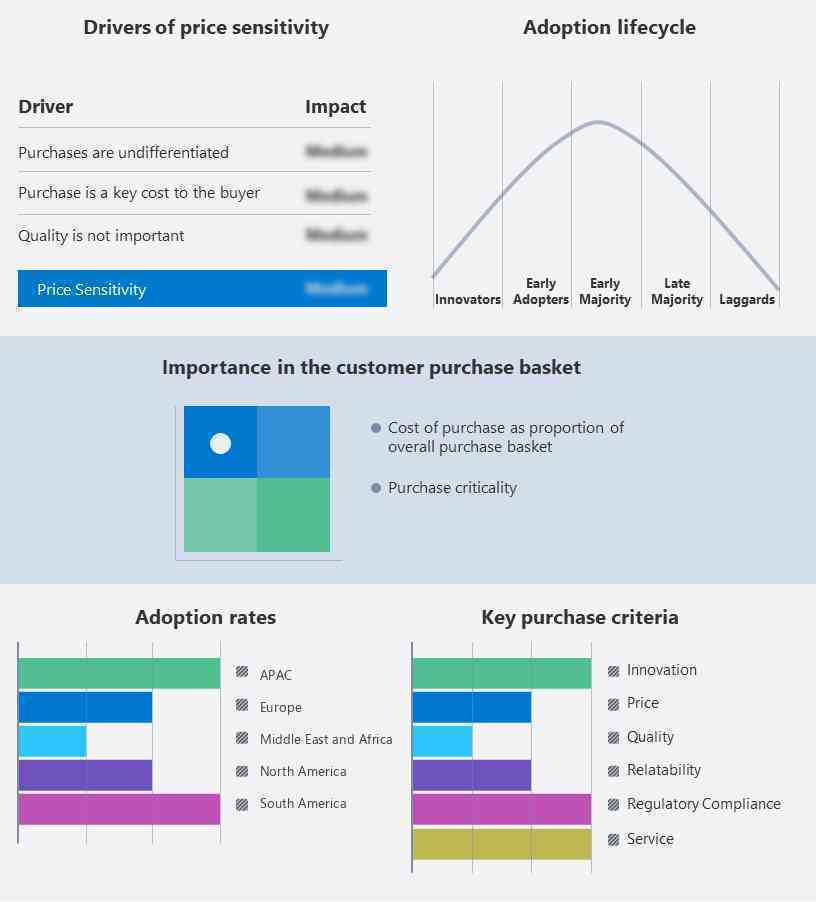
Exclusive Customer Landscape

The nitrogenous fertilizer market forecasting report includes the adoption lifecycle of the market, covering from the innovator's stage to the laggard's stage. It focuses on adoption rates in different regions based on penetration. Furthermore, the market report also includes key purchase criteria and drivers of price sensitivity to help companies evaluate and develop their market growth analysis strategies.

Nitrogenous Fertilizer Market Share by Geography

 Customer Landscape

Key Companies & Market Insights

Companies are implementing various strategies, such as strategic alliances, market forecast , partnerships, mergers and acquisitions, geographical expansion, and product/service launches, to enhance their presence in the industry.

AB Achema - Our company supplies a range of nitrogenous fertilizers, including Ammonium nitrate with a nitrogen content of 34.4 percent (N-34.4). This high-quality fertilizer is essential for enhancing crop productivity and ensuring healthy plant growth in American agriculture. By utilizing our nitrogenous fertilizers, farmers can effectively meet their nutrient requirements, thereby improving their yields and maximizing their returns. Our commitment to providing top-tier agricultural solutions enables US to cater to the specific needs of American farmers, ultimately contributing to the success of their operations.

The nitrogenous fertilizer industry research and growth report includes detailed analyses of the competitive landscape of the market and information about key companies, including:

  • AB Achema
  • Acron Group
  • Agropolychim AD
  • CF Industries Holdings Inc.
  • KBR Inc.
  • LSB Industries
  • OCI NV
  • Petrokemija D.D.
  • PhosAgro Group of Companies
  • PJSC Togliattiazot
  • Qatar Fertiliser Co.
  • Saudi Arabian Mining Co.
  • Saudi Basic Industries Corp.
  • Sinochem Group Co. Ltd.
  • The Mosaic Co.
  • Uralchem JSC
  • EuroChem Group AG
  • Koch Industries Inc.
  • Nutrien Ltd.
  • Yara International ASA

Qualitative and quantitative analysis of companies has been conducted to help clients understand the wider business environment as well as the strengths and weaknesses of key industry players. Data is qualitatively analyzed to categorize companies as pure play, category-focused, industry-focused, and diversified; it is quantitatively analyzed to categorize companies as dominant, leading, strong, tentative, and weak.

Research Analyst Overview

Nitrogenous fertilizers have been a cornerstone of modern agriculture, playing a crucial role in enhancing crop productivity and ensuring food security. These fertilizers, derived from various sources such as ammonium nitrate, ammonium sulfate, calcium ammonium nitrate, urea, and others, provide essential nitrogen to the soil, which is a key nutrient for photosynthesis. Photosynthesis, the process by which plants convert carbon dioxide and water into glucose and oxygen, requires nitrogen. Nitrogen is a vital component of protoplasm, the living substance of a cell. It is an integral part of various organic compounds, including proteins, nucleic acids, and chlorophyll.

Nitrogenous fertilizers contribute significantly to the development of shoots, flower buds, and fruit quality. They are essential for the nitrogen uptake by the crops, which is crucial for the crop's yielding potential. Farmers worldwide rely on these fertilizers to maintain a nutritional balance in the soil, ensuring optimal crop growth. The global population's increasing demand for food, coupled with the limited arable land, puts immense pressure on the agricultural sector to produce more with fewer resources. Nitrogenous fertilizers help farmers meet this challenge by increasing crop output. However, the use of these fertilizers is not without its challenges.

Environmental concerns, such as groundwater contamination and greenhouse gas emissions, have raised questions about the long-term sustainability of using synthetic nitrogenous fertilizers. Organic farming approaches, such as the use of animal manure and biofertilizers, offer a more sustainable alternative. The nitrogen fertilizer industry has responded to these concerns by investing in research and development of new technologies. Precision farming tools, such as soil sensors, drones, and vertical farming, enable farmers to apply nitrogenous fertilizers more efficiently and reduce the risk of over-fertilization. Moreover, the industry is also focusing on developing specialty fertilizers, micronutrient fertilizers, and methylene urea, which are more environmentally friendly and offer better crop uptake.

Urea treatments, for instance, are designed to release nitrogen slowly, reducing the risk of leaching. The nitrogen fertilizer industry's future lies in innovation and sustainability. Corteva Agriscience, one of the leading players in the industry, is investing in research and development of new nitrogenous fertilizer technologies. The company's focus on digital marketing and precision farming tools is helping farmers make more informed decisions about nitrogen application, reducing waste and improving crop yields. In conclusion, nitrogenous fertilizers continue to play a vital role in modern agriculture. Their ability to enhance crop productivity and ensure food security makes them an essential tool for farmers worldwide.

However, the industry must address environmental concerns and invest in sustainable technologies to ensure long-term growth and sustainability. The future of nitrogenous fertilizers lies in innovation, precision, and sustainability.

Nitrogenous Fertilizer Market Scope

Report Coverage

Details

Page number

172

Base year

2022

Historic period

2017-2021

Forecast period

2023-2027

Growth momentum & CAGR

Accelerate at a CAGR of 4.67%

Market growth 2023-2027

32994.82 th t

Market structure

Fragmented

YoY growth 2022-2023(%)

3.92

Key countries

US, China, India, Germany, and Brazil

Competitive landscape

Leading Companies, Market Positioning of Companies, Competitive Strategies, and Industry Risks

Request Free Sample

What are the Key Data Covered in this Market Research and Growth Report?

  • CAGR of the Nitrogenous Fertilizer industry during the forecast period
  • Detailed information on factors that will drive the market growth and forecasting between 2023 and 2027
  • Precise estimation of the size of the market  and its contribution of the industry in focus to the parent market
  • Accurate predictions about upcoming market growth and trends and changes in consumer behaviour
  • Growth of the market across APAC, North America, Europe, Middle East and Africa, and South America
  • Thorough analysis of the market's competitive landscape and detailed information about companies
  • Comprehensive analysis of factors that will challenge the growth of industry companies

We can help! Our analysts can customize this market research report to meet your requirements. Get in touch

1 Executive Summary

  • 1.1 Market overview
    • Exhibit 01: Executive Summary – Chart on Market Overview
    • Exhibit 02: Executive Summary – Data Table on Market Overview
    • Exhibit 03: Executive Summary – Chart on Global Market Characteristics
    • Exhibit 04: Executive Summary – Chart on Market by Geography
    • Exhibit 05: Executive Summary – Chart on Market Segmentation by Type
    • Exhibit 06: Executive Summary – Chart on Market Segmentation by Product
    • Exhibit 07: Executive Summary – Chart on Incremental Growth
    • Exhibit 08: Executive Summary – Data Table on Incremental Growth
    • Exhibit 09: Executive Summary – Chart on Vendor Market Positioning

2 Market Landscape

  • 2.1 Market ecosystem
    • Exhibit 10: Parent market
    • Exhibit 11: Market Characteristics

3 Market Sizing

  • 3.1 Market definition
    • Exhibit 12: Offerings of vendors included in the market definition
  • 3.2 Market segment analysis
    • Exhibit 13: Market segments
  • 3.3 Market size 2022
    • 3.4 Market outlook: Forecast for 2022-2027
      • Exhibit 14: Chart on Global - Market size and forecast 2022-2027 (thousand t)
      • Exhibit 15: Data Table on Global - Market size and forecast 2022-2027 (thousand t)
      • Exhibit 16: Chart on Global Market- Year-over-year growth 2022-2027 (%)
      • Exhibit 17: Data Table on Global Market- Year-over-year growth 2022-2027 (%)

    4 Historic Market Size

    • 4.1 Global nitrogenous fertilizer market 2017 - 2021
      • Exhibit 18: Historic Market Size – Data Table on Global nitrogenous fertilizer market 2017 - 2021 (thousand t)
    • 4.2 Type Segment Analysis 2017 - 2021
      • Exhibit 19: Historic Market Size – Type Segment 2017 - 2021 (thousand t)
    • 4.3 Product Segment Analysis 2017 - 2021
      • Exhibit 20: Historic Market Size – Product Segment 2017 - 2021 (thousand t)
    • 4.4 Geography Segment Analysis 2017 - 2021
      • Exhibit 21: Historic Market Size – Geography Segment 2017 - 2021 (thousand t)
    • 4.5 Country Segment Analysis 2017 - 2021
      • Exhibit 22: Historic Market Size – Country Segment 2017 - 2021 (thousand t)

    5 Five Forces Analysis

    • 5.1 Five forces summary
      • Exhibit 23: Five forces analysis - Comparison between 2022 and 2027
    • 5.2 Bargaining power of buyers
      • Exhibit 24: Chart on Bargaining power of buyers – Impact of key factors 2022 and 2027
    • 5.3 Bargaining power of suppliers
      • Exhibit 25: Bargaining power of suppliers – Impact of key factors in 2022 and 2027
    • 5.4 Threat of new entrants
      • Exhibit 26: Threat of new entrants – Impact of key factors in 2022 and 2027
    • 5.5 Threat of substitutes
      • Exhibit 27: Threat of substitutes – Impact of key factors in 2022 and 2027
    • 5.6 Threat of rivalry
      • Exhibit 28: Threat of rivalry – Impact of key factors in 2022 and 2027
    • 5.7 Market condition
      • Exhibit 29: Chart on Market condition - Five forces 2022 and 2027

    6 Market Segmentation by Type

    • 6.1 Market segments
      • Exhibit 30: Chart on Type - Market share 2022-2027 (%)
      • Exhibit 31: Data Table on Type - Market share 2022-2027 (%)
    • 6.2 Comparison by Type
      • Exhibit 32: Chart on Comparison by Type
      • Exhibit 33: Data Table on Comparison by Type
    • 6.3 Liquid - Market size and forecast 2022-2027
      • Exhibit 34: Chart on Liquid - Market size and forecast 2022-2027 (thousand t)
      • Exhibit 35: Data Table on Liquid - Market size and forecast 2022-2027 (thousand t)
      • Exhibit 36: Chart on Liquid - Year-over-year growth 2022-2027 (%)
      • Exhibit 37: Data Table on Liquid - Year-over-year growth 2022-2027 (%)
    • 6.4 Dry - Market size and forecast 2022-2027
      • Exhibit 38: Chart on Dry - Market size and forecast 2022-2027 (thousand t)
      • Exhibit 39: Data Table on Dry - Market size and forecast 2022-2027 (thousand t)
      • Exhibit 40: Chart on Dry - Year-over-year growth 2022-2027 (%)
      • Exhibit 41: Data Table on Dry - Year-over-year growth 2022-2027 (%)
    • 6.5 Others - Market size and forecast 2022-2027
      • Exhibit 42: Chart on Others - Market size and forecast 2022-2027 (thousand t)
      • Exhibit 43: Data Table on Others - Market size and forecast 2022-2027 (thousand t)
      • Exhibit 44: Chart on Others - Year-over-year growth 2022-2027 (%)
      • Exhibit 45: Data Table on Others - Year-over-year growth 2022-2027 (%)
    • 6.6 Market opportunity by Type
      • Exhibit 46: Market opportunity by Type (thousand t)

    7 Market Segmentation by Product

    • 7.1 Market segments
      • Exhibit 47: Chart on Product - Market share 2022-2027 (%)
      • Exhibit 48: Data Table on Product - Market share 2022-2027 (%)
    • 7.2 Comparison by Product
      • Exhibit 49: Chart on Comparison by Product
      • Exhibit 50: Data Table on Comparison by Product
    • 7.3 Urea - Market size and forecast 2022-2027
      • Exhibit 51: Chart on Urea - Market size and forecast 2022-2027 (thousand t)
      • Exhibit 52: Data Table on Urea - Market size and forecast 2022-2027 (thousand t)
      • Exhibit 53: Chart on Urea - Year-over-year growth 2022-2027 (%)
      • Exhibit 54: Data Table on Urea - Year-over-year growth 2022-2027 (%)
    • 7.4 NPK - Market size and forecast 2022-2027
      • Exhibit 55: Chart on NPK - Market size and forecast 2022-2027 (thousand t)
      • Exhibit 56: Data Table on NPK - Market size and forecast 2022-2027 (thousand t)
      • Exhibit 57: Chart on NPK - Year-over-year growth 2022-2027 (%)
      • Exhibit 58: Data Table on NPK - Year-over-year growth 2022-2027 (%)
    • 7.5 CAN and AN - Market size and forecast 2022-2027
      • Exhibit 59: Chart on CAN and AN - Market size and forecast 2022-2027 (thousand t)
      • Exhibit 60: Data Table on CAN and AN - Market size and forecast 2022-2027 (thousand t)
      • Exhibit 61: Chart on CAN and AN - Year-over-year growth 2022-2027 (%)
      • Exhibit 62: Data Table on CAN and AN - Year-over-year growth 2022-2027 (%)
    • 7.6 DAP and MAP - Market size and forecast 2022-2027
      • Exhibit 63: Chart on DAP and MAP - Market size and forecast 2022-2027 (thousand t)
      • Exhibit 64: Data Table on DAP and MAP - Market size and forecast 2022-2027 (thousand t)
      • Exhibit 65: Chart on DAP and MAP - Year-over-year growth 2022-2027 (%)
      • Exhibit 66: Data Table on DAP and MAP - Year-over-year growth 2022-2027 (%)
    • 7.7 Others - Market size and forecast 2022-2027
      • Exhibit 67: Chart on Others - Market size and forecast 2022-2027 (thousand t)
      • Exhibit 68: Data Table on Others - Market size and forecast 2022-2027 (thousand t)
      • Exhibit 69: Chart on Others - Year-over-year growth 2022-2027 (%)
      • Exhibit 70: Data Table on Others - Year-over-year growth 2022-2027 (%)
    • 7.8 Market opportunity by Product
      • Exhibit 71: Market opportunity by Product (thousand t)

    8 Customer Landscape

    • 8.1 Customer landscape overview
      • Exhibit 72: Analysis of price sensitivity, lifecycle, customer purchase basket, adoption rates, and purchase criteria

    9 Geographic Landscape

    • 9.1 Geographic segmentation
      • Exhibit 73: Chart on Market share by geography 2022-2027 (%)
      • Exhibit 74: Data Table on Market share by geography 2022-2027 (%)
    • 9.2 Geographic comparison
      • Exhibit 75: Chart on Geographic comparison
      • Exhibit 76: Data Table on Geographic comparison
    • 9.3 APAC - Market size and forecast 2022-2027
      • Exhibit 77: Chart on APAC - Market size and forecast 2022-2027 (thousand t)
      • Exhibit 78: Data Table on APAC - Market size and forecast 2022-2027 (thousand t)
      • Exhibit 79: Chart on APAC - Year-over-year growth 2022-2027 (%)
      • Exhibit 80: Data Table on APAC - Year-over-year growth 2022-2027 (%)
    • 9.4 North America - Market size and forecast 2022-2027
      • Exhibit 81: Chart on North America - Market size and forecast 2022-2027 (thousand t)
      • Exhibit 82: Data Table on North America - Market size and forecast 2022-2027 (thousand t)
      • Exhibit 83: Chart on North America - Year-over-year growth 2022-2027 (%)
      • Exhibit 84: Data Table on North America - Year-over-year growth 2022-2027 (%)
    • 9.5 Europe - Market size and forecast 2022-2027
      • Exhibit 85: Chart on Europe - Market size and forecast 2022-2027 (thousand t)
      • Exhibit 86: Data Table on Europe - Market size and forecast 2022-2027 (thousand t)
      • Exhibit 87: Chart on Europe - Year-over-year growth 2022-2027 (%)
      • Exhibit 88: Data Table on Europe - Year-over-year growth 2022-2027 (%)
    • 9.6 Middle East and Africa - Market size and forecast 2022-2027
      • Exhibit 89: Chart on Middle East and Africa - Market size and forecast 2022-2027 (thousand t)
      • Exhibit 90: Data Table on Middle East and Africa - Market size and forecast 2022-2027 (thousand t)
      • Exhibit 91: Chart on Middle East and Africa - Year-over-year growth 2022-2027 (%)
      • Exhibit 92: Data Table on Middle East and Africa - Year-over-year growth 2022-2027 (%)
    • 9.7 South America - Market size and forecast 2022-2027
      • Exhibit 93: Chart on South America - Market size and forecast 2022-2027 (thousand t)
      • Exhibit 94: Data Table on South America - Market size and forecast 2022-2027 (thousand t)
      • Exhibit 95: Chart on South America - Year-over-year growth 2022-2027 (%)
      • Exhibit 96: Data Table on South America - Year-over-year growth 2022-2027 (%)
    • 9.8 China - Market size and forecast 2022-2027
      • Exhibit 97: Chart on China - Market size and forecast 2022-2027 (thousand t)
      • Exhibit 98: Data Table on China - Market size and forecast 2022-2027 (thousand t)
      • Exhibit 99: Chart on China - Year-over-year growth 2022-2027 (%)
      • Exhibit 100: Data Table on China - Year-over-year growth 2022-2027 (%)
    • 9.9 India - Market size and forecast 2022-2027
      • Exhibit 101: Chart on India - Market size and forecast 2022-2027 (thousand t)
      • Exhibit 102: Data Table on India - Market size and forecast 2022-2027 (thousand t)
      • Exhibit 103: Chart on India - Year-over-year growth 2022-2027 (%)
      • Exhibit 104: Data Table on India - Year-over-year growth 2022-2027 (%)
    • 9.10 US - Market size and forecast 2022-2027
      • Exhibit 105: Chart on US - Market size and forecast 2022-2027 (thousand t)
      • Exhibit 106: Data Table on US - Market size and forecast 2022-2027 (thousand t)
      • Exhibit 107: Chart on US - Year-over-year growth 2022-2027 (%)
      • Exhibit 108: Data Table on US - Year-over-year growth 2022-2027 (%)
    • 9.11 Germany - Market size and forecast 2022-2027
      • Exhibit 109: Chart on Germany - Market size and forecast 2022-2027 (thousand t)
      • Exhibit 110: Data Table on Germany - Market size and forecast 2022-2027 (thousand t)
      • Exhibit 111: Chart on Germany - Year-over-year growth 2022-2027 (%)
      • Exhibit 112: Data Table on Germany - Year-over-year growth 2022-2027 (%)
    • 9.12 Brazil - Market size and forecast 2022-2027
      • Exhibit 113: Chart on Brazil - Market size and forecast 2022-2027 (thousand t)
      • Exhibit 114: Data Table on Brazil - Market size and forecast 2022-2027 (thousand t)
      • Exhibit 115: Chart on Brazil - Year-over-year growth 2022-2027 (%)
      • Exhibit 116: Data Table on Brazil - Year-over-year growth 2022-2027 (%)
    • 9.13 Market opportunity by geography
      • Exhibit 117: Market opportunity by geography (thousand t)

    10 Drivers, Challenges, and Trends

    • 10.1 Market drivers
      • 10.2 Market challenges
        • 10.3 Impact of drivers and challenges
          • Exhibit 118: Impact of drivers and challenges in 2022 and 2027
        • 10.4 Market trends

          11 Vendor Landscape

          • 11.1 Overview
            • 11.2 Vendor landscape
              • Exhibit 119: Overview on Criticality of inputs and Factors of differentiation
            • 11.3 Landscape disruption
              • Exhibit 120: Overview on factors of disruption
            • 11.4 Industry risks
              • Exhibit 121: Impact of key risks on business

            12 Vendor Analysis

            • 12.1 Vendors covered
              • Exhibit 122: Vendors covered
            • 12.2 Market positioning of vendors
              • Exhibit 123: Matrix on vendor position and classification
            • 12.3 AB Achema
              • Exhibit 124: AB Achema - Overview
              • Exhibit 125: AB Achema - Product / Service
              • Exhibit 126: AB Achema - Key offerings
            • 12.4 Acron Group
              • Exhibit 127: Acron Group - Overview
              • Exhibit 128: Acron Group - Business segments
              • Exhibit 129: Acron Group - Key offerings
              • Exhibit 130: Acron Group - Segment focus
            • 12.5 Agropolychim AD
              • Exhibit 131: Agropolychim AD - Overview
              • Exhibit 132: Agropolychim AD - Product / Service
              • Exhibit 133: Agropolychim AD - Key offerings
            • 12.6 CF Industries Holdings Inc.
              • Exhibit 134: CF Industries Holdings Inc. - Overview
              • Exhibit 135: CF Industries Holdings Inc. - Business segments
              • Exhibit 136: CF Industries Holdings Inc. - Key news
              • Exhibit 137: CF Industries Holdings Inc. - Key offerings
              • Exhibit 138: CF Industries Holdings Inc. - Segment focus
            • 12.7 EuroChem Group AG
              • Exhibit 139: EuroChem Group AG - Overview
              • Exhibit 140: EuroChem Group AG - Product / Service
              • Exhibit 141: EuroChem Group AG - Key news
              • Exhibit 142: EuroChem Group AG - Key offerings
            • 12.8 KBR Inc.
              • Exhibit 143: KBR Inc. - Overview
              • Exhibit 144: KBR Inc. - Business segments
              • Exhibit 145: KBR Inc. - Key news
              • Exhibit 146: KBR Inc. - Key offerings
              • Exhibit 147: KBR Inc. - Segment focus
            • 12.9 Koch Industries Inc.
              • Exhibit 148: Koch Industries Inc. - Overview
              • Exhibit 149: Koch Industries Inc. - Product / Service
              • Exhibit 150: Koch Industries Inc. - Key news
              • Exhibit 151: Koch Industries Inc. - Key offerings
            • 12.10 LSB Industries
              • Exhibit 152: LSB Industries - Overview
              • Exhibit 153: LSB Industries - Product / Service
              • Exhibit 154: LSB Industries - Key offerings
            • 12.11 Nutrien Ltd.
              • Exhibit 155: Nutrien Ltd. - Overview
              • Exhibit 156: Nutrien Ltd. - Business segments
              • Exhibit 157: Nutrien Ltd. - Key offerings
              • Exhibit 158: Nutrien Ltd. - Segment focus
            • 12.12 OCI NV
              • Exhibit 159: OCI NV - Overview
              • Exhibit 160: OCI NV - Business segments
              • Exhibit 161: OCI NV - Key offerings
              • Exhibit 162: OCI NV - Segment focus
            • 12.13 Petrokemija D.D.
              • Exhibit 163: Petrokemija D.D. - Overview
              • Exhibit 164: Petrokemija D.D. - Product / Service
              • Exhibit 165: Petrokemija D.D. - Key offerings
            • 12.14 PhosAgro Group of Companies
              • Exhibit 166: PhosAgro Group of Companies - Overview
              • Exhibit 167: PhosAgro Group of Companies - Product / Service
              • Exhibit 168: PhosAgro Group of Companies - Key offerings
            • 12.15 Saudi Arabian Mining Co.
              • Exhibit 169: Saudi Arabian Mining Co. - Overview
              • Exhibit 170: Saudi Arabian Mining Co. - Business segments
              • Exhibit 171: Saudi Arabian Mining Co. - Key offerings
              • Exhibit 172: Saudi Arabian Mining Co. - Segment focus
            • 12.16 Saudi Basic Industries Corp.
              • Exhibit 173: Saudi Basic Industries Corp. - Overview
              • Exhibit 174: Saudi Basic Industries Corp. - Business segments
              • Exhibit 175: Saudi Basic Industries Corp. - Key offerings
              • Exhibit 176: Saudi Basic Industries Corp. - Segment focus
            • 12.17 Yara International ASA
              • Exhibit 177: Yara International ASA - Overview
              • Exhibit 178: Yara International ASA - Business segments
              • Exhibit 179: Yara International ASA - Key news
              • Exhibit 180: Yara International ASA - Key offerings
              • Exhibit 181: Yara International ASA - Segment focus

            13 Appendix

            • 13.1 Scope of the report
              • 13.2 Inclusions and exclusions checklist
                • Exhibit 182: Inclusions checklist
                • Exhibit 183: Exclusions checklist
              • 13.3 Currency conversion rates for US$
                • Exhibit 184: Currency conversion rates for US$
              • 13.4 Research methodology
                • Exhibit 185: Research methodology
                • Exhibit 186: Validation techniques employed for market sizing
                • Exhibit 187: Information sources
              • 13.5 List of abbreviations
                • Exhibit 188: List of abbreviations

              Research Methodology

              Technavio presents a detailed picture of the market by way of study, synthesis, and summation of data from multiple sources. The analysts have presented the various facets of the market with a particular focus on identifying the key industry influencers. The data thus presented is comprehensive, reliable, and the result of extensive research, both primary and secondary.

              INFORMATION SOURCES

              Primary sources

              • Manufacturers and suppliers
              • Channel partners
              • Industry experts
              • Strategic decision makers

              Secondary sources

              • Industry journals and periodicals
              • Government data
              • Financial reports of key industry players
              • Historical data
              • Press releases

              DATA ANALYSIS

              Data Synthesis

              • Collation of data
              • Estimation of key figures
              • Analysis of derived insights

              Data Validation

              • Triangulation with data models
              • Reference against proprietary databases
              • Corroboration with industry experts

              REPORT WRITING

              Qualitative

              • Market drivers
              • Market challenges
              • Market trends
              • Five forces analysis

              Quantitative

              • Market size and forecast
              • Market segmentation
              • Geographical insights
              • Competitive landscape

              Interested in this report?

              Get your sample now to see our research methodology and insights!

              Download Now

              Frequently Asked Questions

              Nitrogenous Fertilizer market growth will increase by 32994.82 thousand t during 2023-2027.

              The Nitrogenous Fertilizer market is expected to grow at a CAGR of 4.67% during 2023-2027.

              Nitrogenous Fertilizer market is segmented by Type( Liquid, Dry, Others, DAP and MAP, Others) Product( Urea, NPK, CAN and AN, DAP and MAP, Others)

              AB Achema, Acron Group, Agropolychim AD, CF Industries Holdings Inc., KBR Inc., LSB Industries, OCI NV, Petrokemija D.D., PhosAgro Group of Companies, PJSC Togliattiazot, Qatar Fertiliser Co., Saudi Arabian Mining Co., Saudi Basic Industries Corp., Sinochem Group Co. Ltd., The Mosaic Co., Uralchem JSC, EuroChem Group AG, Koch Industries Inc., Nutrien Ltd., Yara International ASA are a few of the key vendors in the Nitrogenous Fertilizer market.

              APAC will register the highest growth rate of 56.75% among the other regions. Therefore, the Nitrogenous Fertilizer market in APAC is expected to garner significant business opportunities for the vendors during the forecast period.

              US, China, India, Germany, Brazil

              • Increase in demand from developing countriesThe growing demand for nitrogenous fertilizers from China is the driving factor this market.
              • India is the driving factor this market.
              • Brazil is the driving factor this market.
              • Indonesia is the driving factor this market.
              • and Pakistan is expected to drive the growth of the market during the forecast period. The growth of the agricultural sector in these countries to meet the growing food requirements has contributed to the nitrogenous fertilizer market growth. Nitrogenous fertilizers can be easily applied and ensure superior performance. The growing demand for high-quality fertilizers and the use of technology-driven irrigation is the driving factor this market.
              • including micro drip irrigation is the driving factor this market.
              • are expected to drive the demand for nitrogenous fertilizers in the coming years. APAC is one of the major consumers of fertilizers in the world. The increasing population and rising per capita income contribute to the demand for food and agricultural products. For instance is the driving factor this market.
              • the population of India and China reached nearly 1.41 billion and 1.41 billion is the driving factor this market.
              • respectively is the driving factor this market.
              • in 2021. The shift from grain-based to high protein-based diets is the driving factor this market.
              • particularly in China and India is the driving factor this market.
              • has increased the use of nitrogenous fertilizers to cultivate crops with high protein content. In India is the driving factor this market.
              • more than half of the population depends on agriculture as the primary source of livelihood. The country was the major producer of wheat is the driving factor this market.
              • sugarcane is the driving factor this market.
              • rice is the driving factor this market.
              • and fruits and vegetables in 2021. Government subsidies and incentives on fertilizers to support the agriculture sector will increase the demand for nitrogenous fertilizers. Government support and initiatives for agriculture production in APAC will increase the consumption of nitrogenous fertilizers. Hence is the driving factor this market.
              • such factors will drive the growth of the global nitrogenous fertilizer market during the forecast period. is the driving factor this market.

              The Nitrogenous Fertilizer market vendors should focus on grabbing business opportunities from the Liquid segment as it accounted for the largest market share in the base year.