Non-Photo Personalized Gifts Market Analysis North America, Europe, APAC, South America, Middle East and Africa - US, Germany, China, UK, Canada - Size and Forecast 2024-2028

Non-Photo Personalized Gifts Market Analysis North America, Europe, APAC, South America, Middle East and Africa - US, Germany, China, UK, Canada - Size and Forecast 2024-2028

Published: Aug 2024 179 Pages SKU: IRTNTR41377

Market Overview at a Glance

$12.02 B
Market Opportunity
10.44%
CAGR
8.64
YoY growth 2023-2024(%)

Non-photo Personalized Gifts Market Size 2024-2028

The non-photo personalized gifts market size is estimated to grow by USD 12.02 billion, at a CAGR of 10.44% between 2023 and 2028. The market experiencing steady expansion, driven by various factors. Firstly, the burgeoning gifting culture and escalating preference for seasonal decorations significantly contribute to market growth. In emerging countries, the organized retail sector's expansion plays a pivotal role in market development. Furthermore, the increasing popularity of private-label brands, offering unique and customized products, fuels market demand. These trends collectively shape the dynamic landscape of the non-photo personalized gifts industry.

What will be the Size of the Market During the Forecast Period?

Non-Photo Personalized Gifts Market Size

To learn more about this report, View Report Sample

Market Dynamics

The market is thriving with a diverse array of offerings, ranging from customized presents to bespoke accessories and home décor pieces. These gifts cater to various occasions, including milestone events, holidays, and anniversaries, allowing individuals to express their sentiments uniquely. With a focus on hand-crafted and organic materials, the market reflects growing consumer preferences for environmentally friendly options. Businesses specializing in personalized gift creation are witnessing industry expansion, fueled by the demand for lifestyle goods tailored to individual tastes. Moreover, the rise of experiential gifting and the influence of social media influencers have contributed to the popularity of specialized merchandise, including 3D-printed personalized gifts, offering consumers a wide range of options for expressing their affection to loved ones and friends.  

Key Market Driver

The growing organized retail in emerging countries is driving growth in the market. With the expansion of supermarkets, hypermarkets, and specialty stores, there is a marked increase in organized retailing around the world. Non-photo personalized gifts such as kitchenware, tableware, stationery, and greeting cards are primarily sold by established organized retailers. 

However, organized retailers provide consumers with convenience and value for money. A lot of gifts are available in organized retail stores, making it possible for the visitor to choose from a variety of options. A large number of consumers across the globe prefer shopping through supermarkets and hypermarkets, further increasing the importance of organized retailers among companies. Growing organized retailing in emerging countries will, thus, drive the market for non-photo personalized gifts during the forecast period.

Significant Market Trends

Innovations in the personalization of gifts are a key trend in the market. To increase the acceptance and sales of non-photo personalized gifts, suppliers operating in target markets are offering a higher level of personalization. Vendors are increasingly focusing on enhancing the customer experience during the personalization of product orders by integrating innovative technologies. 

Moreover, artificial intelligence is also becoming more and more important for some retailers on the market which are trying to help customers discover their perfect gift. Some of the vendors operating in the market in focus are adopting an in-store gift personalization strategy. Such innovations in the non-photo personalization of gifts will increase their sales and thereby accelerate the growth momentum of the market during the forecast period.

Major Market Challenge

The growing competition from homemade and DIY gifts is a major challenge in the market challenge. Individuals can make DIY non-photo personalized gifts and give them to the targeted end-users. They are also capable of adapting the gifts according to their creativity and ideas to achieve a higher level of attractiveness and efficiency for receivers. People can get ideas to personalize their gifts from various online platforms, such as YouTube tutorials and social media, and create them on their own. 

Also, sometimes, individuals may not be able to find the desired gift for the receiver either in offline or online stores. Hence, they're able to choose from the DIY versions and create their gifts that would be more charming and useful for the recipient.  Hence, the growing inclination for DIY, homemade non-photo personalized gifts will have a negative impact on sales and thereby hinder the potential growth of the market during the forecast period.

Customer Landscape

The market research report includes the adoption lifecycle of the market, covering from the innovator’s stage to the laggard’s stage. It focuses on adoption rates in different regions based on penetration. Furthermore, the report also includes key purchase criteria and drivers of price sensitivity to help companies evaluate and develop their growth strategies.

Non-photo Personalized Gifts Market Share by Geography

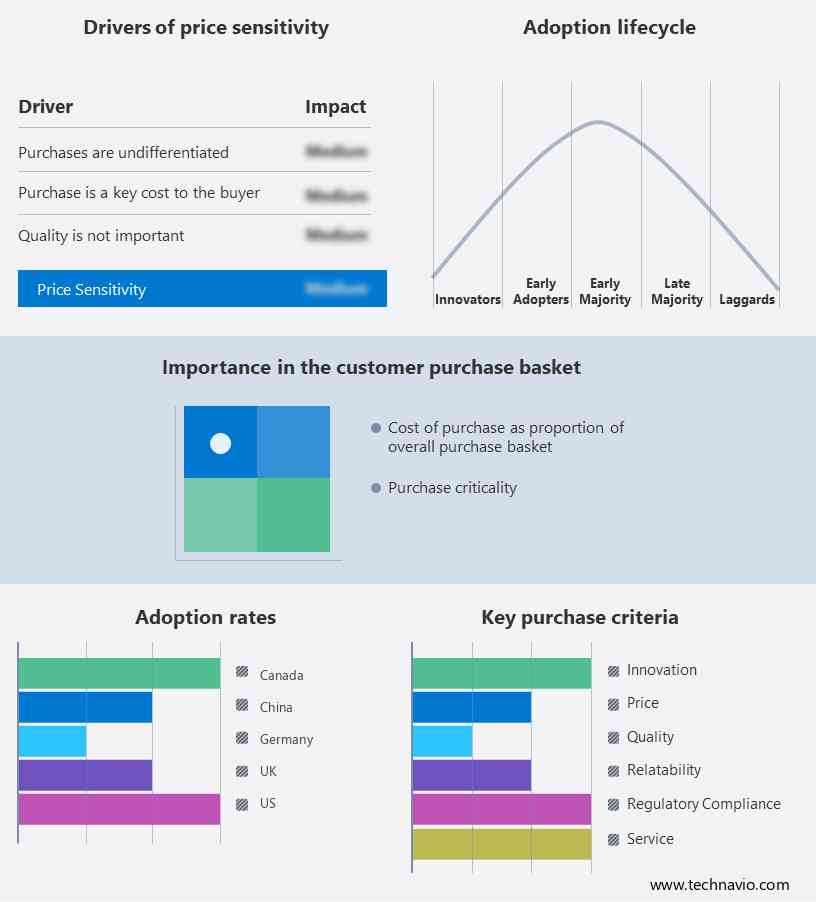
Global Market Customer Landscape

Who are the Major Market Companies?

Companies are implementing various strategies, such as strategic alliances, partnerships, mergers and acquisitions, geographical expansion, and product/service launches, to enhance their presence in the market.

American Greetings Corp.- The company offers non-photo personalized gifts such as birthday ecards, smashUps, anniversary ecards, and gift cards.

The research report also includes detailed analyses of the competitive landscape of the market and information about 20 market companies, including:

  • American Stationery Co. Inc.
  • Bed Bath and Beyond Inc.
  • Card Factory Plc
  • Chococraft Creations Pvt. Ltd.
  • Cimpress Plc
  • Etsy Inc.
  • Ferns N Petals Pvt. Ltd.
  • funkypigeon.com Ltd.
  • Hallmark Card Inc.
  • manuBIMsoft Ltd.
  • Redbubble Ltd.
  • Shutterfly Inc.
  • Signature Gifts Ltd.
  • Sixty Stores Ltd.

Qualitative and quantitative analysis of companies has been conducted to help clients understand the wider business environment as well as the strengths and weaknesses of key market players. Data is qualitatively analyzed to categorize companies as pure play, category-focused, industry-focused, and diversified; it is quantitatively analyzed to categorize companies as dominant, leading, strong, tentative, and weak.

Market Segmentation

The online segment is estimated to witness significant growth during the forecast period. The online distribution channel, also known as e-commerce, has been significantly fueling the growth of the market over the last decade. E-commerce opens the door to customers accessing national and global brands of non-photo personalized gifts.

Non-Photo Personalized Gifts Market Size

Get a glance at the market contribution of various segments View the PDF Sample

The online segment was the largest and was valued at USD 7.76 billion in 2018E-commerce platforms offer personalized shopping assistance, along with suggestions on different types of non-photo personalized gifts to customers, based on aspects such as the type, customization, and designs of non-photo personalized gifts. Certain new online stores that entered the worldwide market have been encouraged to do so by increasing demand for personalized gifts.

By Region

Non-Photo Personalized Gifts Market Share by Geography

For more insights on the market share of various regions Download PDF Sample now!

North America is estimated to contribute 41% to the growth of the global market during the forecast period. Technavio’s analysts have elaborately explained the regional trends and drivers that shape the market during the forecast period. The market in North America is expected to grow at a moderate rate during the forecast period. There is a near maturity in the region's traditional gifts market, and so it is now receiving an influx of exciting new products. Increased sales of non-photo personalized gifts, such as greeting cards, souvenirs, and decorative products, fuel market growth because of the high penetration of these products in occasional giftings.

Moreover, home furnishings and home decor are popular as high-end gifts. Early adoption of the Internet and the high penetration of social media have also propelled the growth of the market in focus in the region. The key contributing countries in the region are the US, Canada, and Mexico. The growing inclination for e-cards may affect the sales of non-photo personalized greeting cards in the region and thereby hinder the potential growth of the market in North America during the forecast period.

Segment Overview

The market research report provides comprehensive data (region-wise segment analysis), with forecasts and estimates in "USD Billion" for the period 2024 to 2028, as well as historical data from 2018 to 2022 for the following segments.

  • Distribution Channel Outlook 
    • Online
    • Offline
  • Type Outlook 
    • Wearables and accessories
    • Decoration
    • Kitchenware and tableware
    • Stationery and greeting cards
    • Others
  • Region Outlook 
    • North America
      • The U.S.
      • Canada
    • Europe
      • The U.K.
      • Germany
      • France
      • Rest of Europe
    • APAC
      • China
      • India
    • Middle East & Africa
      • Saudi Arabia
      • South Africa
      • Rest of the Middle East & Africa
    • South America
      • Chile
      • Argentina 
      • Brazil

Market Analyst Overview

The market is witnessing a surge in demand for custom clothing and original and considerate gifts, reflecting a shift from traditional gift-giving to more customizable products. Consumers are increasingly drawn to monogrammed homeware and engraved jewelry, seeking sustainability and environmental responsibility in their purchases. The market is embracing experiential, tech-enabled, and sustainable personalization, leveraging ethically sourced and upcycled materials. Social and political factors, along with regulations, influence companies' regional and industry footprints, with innovators like Ace Matrix leading the way. Hand-crafted gifts and personalized gift companies cater to a diverse client base, driving expansions amidst rapid urbanization and rising disposable incomes.

As smartphone usage and digitization fuel e-commerce infrastructure, consumer spending emphasizes individuality through personalized offerings from Personalization Mall and beyond. Further, the market is rapidly expanding, driven by market expansion and tech-enabled personalization. Key trends include experiential personalization, with 3D printed personalized gifts leading the way. Engraved jewelry, upcycled goods, and ethically sourced materials reflect social factors and environmental issues, such as environmental impact. Organic and natural materials appeal to consumers seeking cutting-edge, innovator products. Smartphone usage boosts active private-label brands for women, men, and kids, enhancing the gifting culture with unisex options.

Market Scope

Report Coverage

Details

Page number

179

Base year

2023

Historic period

2018-2022

Forecast period

2024-2028

Growth momentum & CAGR

Accelerate at a CAGR of 10.44%

Market Growth 2024-2028

USD 12.02 billion

Market structure

Fragmented

YoY growth 2023-2024(%)

8.64

Regional analysis

North America, Europe, APAC, South America, and Middle East and Africa

Performing market contribution

North America at 41%

Key countries

US, Germany, China, UK, and Canada

Competitive landscape

Leading Companies, Market Positioning of Companies, Competitive Strategies, and Industry Risks

Key companies profiled

American Greetings Corp., American Stationery Co. Inc., Bed Bath and Beyond Inc., Card Factory Plc, Chococraft Creations Pvt. Ltd., Cimpress Plc, Etsy Inc., Ferns N Petals Pvt. Ltd., funkypigeon.com Ltd., Hallmark Card Inc., manuBIMsoft Ltd., Redbubble Ltd., Shutterfly Inc., Signature Gifts Ltd., Sixty Stores Ltd., Takara Tomy Co. Ltd., UncommonGoods LLC, Walmart Inc., Yildiz Holding AS, and Zazzle Inc.

Market dynamics

Parent market growth analysis, Market Forecasting, Market growth inducers and obstacles, Fast-growing and slow-growing segment analysis, COVID-19 impact and recovery analysis and future consumer dynamics, and Market condition analysis for the market forecast period.

Customization purview

If our report has not included the data that you are looking for, you can reach out to our analysts and get segments customized.

View PDF Sample

What are the Key Data Covered in this Market Report?

  • CAGR of the market during the forecast period
  • Detailed information on factors that will drive the market growth and forecasting of the market between 2024 and 2028
  • Precise estimation of the size of the market size and its contribution to the parent market
  • Accurate predictions about upcoming market trends and analysis and changes in consumer behavior
  • Growth of the market across Europe, North America, APAC, South America, and Middle East and Africa
  • Thorough market growth analysis of the market’s competitive landscape and detailed information about companies
  • Comprehensive market analysis and report on the factors that will challenge the market research and growth of market companies

We can help! Our analysts can customize this market research report to meet your requirements. 

Get in touch

1 Executive Summary

  • 1.1 Market overview
    • Executive Summary - Chart on Market Overview
    • Executive Summary - Data Table on Market Overview
    • Executive Summary - Chart on Global Market Characteristics
    • Executive Summary - Chart on Market by Geography
    • Executive Summary - Chart on Market Segmentation by Distribution Channel
    • Executive Summary - Chart on Market Segmentation by Type
    • Executive Summary - Chart on Incremental Growth
    • Executive Summary - Data Table on Incremental Growth
    • Executive Summary - Chart on Company Market Positioning

2 Market Landscape

  • 2.1 Market ecosystem
    • Parent Market
    • Data Table on - Parent Market
  • 2.2 Market characteristics
    • Market characteristics analysis
  • 2.3 Value chain analysis
    • Value Chain Analysis

3 Market Sizing

  • 3.1 Market definition
    • Offerings of companies included in the market definition
  • 3.2 Market segment analysis
    • Market segments
  • 3.3 Market size 2023
    • 3.4 Market outlook: Forecast for 2023-2028
      • Chart on Global - Market size and forecast 2023-2028 ($ million)
      • Data Table on Global - Market size and forecast 2023-2028 ($ million)
      • Chart on Global Market: Year-over-year growth 2023-2028 (%)
      • Data Table on Global Market: Year-over-year growth 2023-2028 (%)

    4 Historic Market Size

    • 4.1 Global Non-Photo Personalized Gifts Market 2018 - 2022
      • Historic Market Size - Data Table on Global Non-Photo Personalized Gifts Market 2018 - 2022 ($ million)
    • 4.2 Distribution Channel segment analysis 2018 - 2022
      • Historic Market Size - Distribution Channel Segment 2018 - 2022 ($ million)
    • 4.3 Type segment analysis 2018 - 2022
      • Historic Market Size - Type Segment 2018 - 2022 ($ million)
    • 4.4 Geography segment analysis 2018 - 2022
      • Historic Market Size - Geography Segment 2018 - 2022 ($ million)
    • 4.5 Country segment analysis 2018 - 2022
      • Historic Market Size - Country Segment 2018 - 2022 ($ million)

    5 Five Forces Analysis

    • 5.1 Five forces summary
      • Five forces analysis - Comparison between 2023 and 2028
    • 5.2 Bargaining power of buyers
      • Bargaining power of buyers - Impact of key factors 2023 and 2028
    • 5.3 Bargaining power of suppliers
      • Bargaining power of suppliers - Impact of key factors in 2023 and 2028
    • 5.4 Threat of new entrants
      • Threat of new entrants - Impact of key factors in 2023 and 2028
    • 5.5 Threat of substitutes
      • Threat of substitutes - Impact of key factors in 2023 and 2028
    • 5.6 Threat of rivalry
      • Threat of rivalry - Impact of key factors in 2023 and 2028
    • 5.7 Market condition
      • Chart on Market condition - Five forces 2023 and 2028

    6 Market Segmentation by Distribution Channel

    • 6.1 Market segments
      • Chart on Distribution Channel - Market share 2023-2028 (%)
      • Data Table on Distribution Channel - Market share 2023-2028 (%)
    • 6.2 Comparison by Distribution Channel
      • Chart on Comparison by Distribution Channel
      • Data Table on Comparison by Distribution Channel
    • 6.3 Online - Market size and forecast 2023-2028
      • Chart on Online - Market size and forecast 2023-2028 ($ million)
      • Data Table on Online - Market size and forecast 2023-2028 ($ million)
      • Chart on Online - Year-over-year growth 2023-2028 (%)
      • Data Table on Online - Year-over-year growth 2023-2028 (%)
    • 6.4 Offline - Market size and forecast 2023-2028
      • Chart on Offline - Market size and forecast 2023-2028 ($ million)
      • Data Table on Offline - Market size and forecast 2023-2028 ($ million)
      • Chart on Offline - Year-over-year growth 2023-2028 (%)
      • Data Table on Offline - Year-over-year growth 2023-2028 (%)
    • 6.5 Market opportunity by Distribution Channel
      • Market opportunity by Distribution Channel ($ million)
      • Data Table on Market opportunity by Distribution Channel ($ million)

    7 Market Segmentation by Type

    • 7.1 Market segments
      • Chart on Type - Market share 2023-2028 (%)
      • Data Table on Type - Market share 2023-2028 (%)
    • 7.2 Comparison by Type
      • Chart on Comparison by Type
      • Data Table on Comparison by Type
    • 7.3 Wearables and accessories - Market size and forecast 2023-2028
      • Chart on Wearables and accessories - Market size and forecast 2023-2028 ($ million)
      • Data Table on Wearables and accessories - Market size and forecast 2023-2028 ($ million)
      • Chart on Wearables and accessories - Year-over-year growth 2023-2028 (%)
      • Data Table on Wearables and accessories - Year-over-year growth 2023-2028 (%)
    • 7.4 Decoration - Market size and forecast 2023-2028
      • Chart on Decoration - Market size and forecast 2023-2028 ($ million)
      • Data Table on Decoration - Market size and forecast 2023-2028 ($ million)
      • Chart on Decoration - Year-over-year growth 2023-2028 (%)
      • Data Table on Decoration - Year-over-year growth 2023-2028 (%)
    • 7.5 Kitchenware and tableware - Market size and forecast 2023-2028
      • Chart on Kitchenware and tableware - Market size and forecast 2023-2028 ($ million)
      • Data Table on Kitchenware and tableware - Market size and forecast 2023-2028 ($ million)
      • Chart on Kitchenware and tableware - Year-over-year growth 2023-2028 (%)
      • Data Table on Kitchenware and tableware - Year-over-year growth 2023-2028 (%)
    • 7.6 Stationery and greeting cards - Market size and forecast 2023-2028
      • Chart on Stationery and greeting cards - Market size and forecast 2023-2028 ($ million)
      • Data Table on Stationery and greeting cards - Market size and forecast 2023-2028 ($ million)
      • Chart on Stationery and greeting cards - Year-over-year growth 2023-2028 (%)
      • Data Table on Stationery and greeting cards - Year-over-year growth 2023-2028 (%)
    • 7.7 Others - Market size and forecast 2023-2028
      • Chart on Others - Market size and forecast 2023-2028 ($ million)
      • Data Table on Others - Market size and forecast 2023-2028 ($ million)
      • Chart on Others - Year-over-year growth 2023-2028 (%)
      • Data Table on Others - Year-over-year growth 2023-2028 (%)
    • 7.8 Market opportunity by Type
      • Market opportunity by Type ($ million)
      • Data Table on Market opportunity by Type ($ million)

    8 Customer Landscape

    • 8.1 Customer landscape overview
      • Analysis of price sensitivity, lifecycle, customer purchase basket, adoption rates, and purchase criteria

    9 Geographic Landscape

    • 9.1 Geographic segmentation
      • Chart on Market share by geography 2023-2028 (%)
      • Data Table on Market share by geography 2023-2028 (%)
    • 9.2 Geographic comparison
      • Chart on Geographic comparison
      • Data Table on Geographic comparison
    • 9.3 North America - Market size and forecast 2023-2028
      • Chart on North America - Market size and forecast 2023-2028 ($ million)
      • Data Table on North America - Market size and forecast 2023-2028 ($ million)
      • Chart on North America - Year-over-year growth 2023-2028 (%)
      • Data Table on North America - Year-over-year growth 2023-2028 (%)
    • 9.4 Europe - Market size and forecast 2023-2028
      • Chart on Europe - Market size and forecast 2023-2028 ($ million)
      • Data Table on Europe - Market size and forecast 2023-2028 ($ million)
      • Chart on Europe - Year-over-year growth 2023-2028 (%)
      • Data Table on Europe - Year-over-year growth 2023-2028 (%)
    • 9.5 APAC - Market size and forecast 2023-2028
      • Chart on APAC - Market size and forecast 2023-2028 ($ million)
      • Data Table on APAC - Market size and forecast 2023-2028 ($ million)
      • Chart on APAC - Year-over-year growth 2023-2028 (%)
      • Data Table on APAC - Year-over-year growth 2023-2028 (%)
    • 9.6 South America - Market size and forecast 2023-2028
      • Chart on South America - Market size and forecast 2023-2028 ($ million)
      • Data Table on South America - Market size and forecast 2023-2028 ($ million)
      • Chart on South America - Year-over-year growth 2023-2028 (%)
      • Data Table on South America - Year-over-year growth 2023-2028 (%)
    • 9.7 Middle East and Africa - Market size and forecast 2023-2028
      • Chart on Middle East and Africa - Market size and forecast 2023-2028 ($ million)
      • Data Table on Middle East and Africa - Market size and forecast 2023-2028 ($ million)
      • Chart on Middle East and Africa - Year-over-year growth 2023-2028 (%)
      • Data Table on Middle East and Africa - Year-over-year growth 2023-2028 (%)
    • 9.8 US - Market size and forecast 2023-2028
      • Chart on US - Market size and forecast 2023-2028 ($ million)
      • Data Table on US - Market size and forecast 2023-2028 ($ million)
      • Chart on US - Year-over-year growth 2023-2028 (%)
      • Data Table on US - Year-over-year growth 2023-2028 (%)
    • 9.9 Germany - Market size and forecast 2023-2028
      • Chart on Germany - Market size and forecast 2023-2028 ($ million)
      • Data Table on Germany - Market size and forecast 2023-2028 ($ million)
      • Chart on Germany - Year-over-year growth 2023-2028 (%)
      • Data Table on Germany - Year-over-year growth 2023-2028 (%)
    • 9.10 China - Market size and forecast 2023-2028
      • Chart on China - Market size and forecast 2023-2028 ($ million)
      • Data Table on China - Market size and forecast 2023-2028 ($ million)
      • Chart on China - Year-over-year growth 2023-2028 (%)
      • Data Table on China - Year-over-year growth 2023-2028 (%)
    • 9.11 UK - Market size and forecast 2023-2028
      • Chart on UK - Market size and forecast 2023-2028 ($ million)
      • Data Table on UK - Market size and forecast 2023-2028 ($ million)
      • Chart on UK - Year-over-year growth 2023-2028 (%)
      • Data Table on UK - Year-over-year growth 2023-2028 (%)
    • 9.12 Canada - Market size and forecast 2023-2028
      • Chart on Canada - Market size and forecast 2023-2028 ($ million)
      • Data Table on Canada - Market size and forecast 2023-2028 ($ million)
      • Chart on Canada - Year-over-year growth 2023-2028 (%)
      • Data Table on Canada - Year-over-year growth 2023-2028 (%)
    • 9.13 Market opportunity by geography
      • Market opportunity by geography ($ million)
      • Data Tables on Market opportunity by geography ($ million)

    10 Drivers, Challenges, and Opportunity/Restraints

    • 10.1 Market drivers
      • 10.2 Market challenges
        • 10.3 Impact of drivers and challenges
          • Impact of drivers and challenges in 2023 and 2028
        • 10.4 Market opportunities/restraints

          11 Competitive Landscape

          • 11.1 Overview
            • 11.2 Competitive Landscape
              • Overview on criticality of inputs and factors of differentiation
            • 11.3 Landscape disruption
              • Overview on factors of disruption
            • 11.4 Industry risks
              • Impact of key risks on business

            12 Competitive Analysis

            • 12.1 Companies profiled
              • Companies covered
            • 12.2 Market positioning of companies
              • Matrix on companies position and classification
            • 12.3 American Greetings Corp.
              • American Greetings Corp. - Overview
              • American Greetings Corp. - Product / Service
              • American Greetings Corp. - Key offerings
            • 12.4 American Stationery Co. Inc.
              • American Stationery Co. Inc. - Overview
              • American Stationery Co. Inc. - Product / Service
              • American Stationery Co. Inc. - Key offerings
            • 12.5 Bed Bath and Beyond Inc.
              • Bed Bath and Beyond Inc. - Overview
              • Bed Bath and Beyond Inc. - Product / Service
              • Bed Bath and Beyond Inc. - Key news
              • Bed Bath and Beyond Inc. - Key offerings
            • 12.6 Card Factory Plc
              • Card Factory Plc - Overview
              • Card Factory Plc - Business segments
              • Card Factory Plc - Key offerings
              • Card Factory Plc - Segment focus
            • 12.7 Chococraft Creations Pvt. Ltd.
              • Chococraft Creations Pvt. Ltd. - Overview
              • Chococraft Creations Pvt. Ltd. - Product / Service
              • Chococraft Creations Pvt. Ltd. - Key offerings
            • 12.8 Cimpress Plc
              • Cimpress Plc - Overview
              • Cimpress Plc - Business segments
              • Cimpress Plc - Key offerings
              • Cimpress Plc - Segment focus
            • 12.9 Etsy Inc.
              • Etsy Inc. - Overview
              • Etsy Inc. - Product / Service
              • Etsy Inc. - Key news
              • Etsy Inc. - Key offerings
            • 12.10 Ferns N Petals Pvt. Ltd.
              • Ferns N Petals Pvt. Ltd. - Overview
              • Ferns N Petals Pvt. Ltd. - Product / Service
              • Ferns N Petals Pvt. Ltd. - Key offerings
            • 12.11 funkypigeon.com Ltd.
              • funkypigeon.com Ltd. - Overview
              • funkypigeon.com Ltd. - Product / Service
              • funkypigeon.com Ltd. - Key offerings
            • 12.12 Hallmark Card Inc.
              • Hallmark Card Inc. - Overview
              • Hallmark Card Inc. - Product / Service
              • Hallmark Card Inc. - Key offerings
            • 12.13 Shutterfly Inc.
              • Shutterfly Inc. - Overview
              • Shutterfly Inc. - Product / Service
              • Shutterfly Inc. - Key offerings
            • 12.14 Takara Tomy Co. Ltd.
              • Takara Tomy Co. Ltd. - Overview
              • Takara Tomy Co. Ltd. - Product / Service
              • Takara Tomy Co. Ltd. - Key offerings
            • 12.15 Walmart Inc.
              • Walmart Inc. - Overview
              • Walmart Inc. - Business segments
              • Walmart Inc. - Key news
              • Walmart Inc. - Key offerings
              • Walmart Inc. - Segment focus
            • 12.16 Yildiz Holding AS
              • Yildiz Holding AS - Overview
              • Yildiz Holding AS - Product / Service
              • Yildiz Holding AS - Key news
              • Yildiz Holding AS - Key offerings
            • 12.17 Zazzle Inc.
              • Zazzle Inc. - Overview
              • Zazzle Inc. - Product / Service
              • Zazzle Inc. - Key offerings

            13 Appendix

            • 13.1 Scope of the report
              • 13.2 Inclusions and exclusions checklist
                • Inclusions checklist
                • Exclusions checklist
              • 13.3 Currency conversion rates for US$
                • Currency conversion rates for US$
              • 13.4 Research methodology
                • Research methodology
              • 13.5 Data procurement
                • Information sources
              • 13.6 Data validation
                • Data validation
              • 13.7 Validation techniques employed for market sizing
                • Validation techniques employed for market sizing
              • 13.8 Data synthesis
                • Data synthesis
              • 13.9 360 degree market analysis
                • 360 degree market analysis
              • 13.10 List of abbreviations
                • List of abbreviations

              Research Methodology

              Technavio presents a detailed picture of the market by way of study, synthesis, and summation of data from multiple sources. The analysts have presented the various facets of the market with a particular focus on identifying the key industry influencers. The data thus presented is comprehensive, reliable, and the result of extensive research, both primary and secondary.

              INFORMATION SOURCES

              Primary sources

              • Manufacturers and suppliers
              • Channel partners
              • Industry experts
              • Strategic decision makers

              Secondary sources

              • Industry journals and periodicals
              • Government data
              • Financial reports of key industry players
              • Historical data
              • Press releases

              DATA ANALYSIS

              Data Synthesis

              • Collation of data
              • Estimation of key figures
              • Analysis of derived insights

              Data Validation

              • Triangulation with data models
              • Reference against proprietary databases
              • Corroboration with industry experts

              REPORT WRITING

              Qualitative

              • Market drivers
              • Market challenges
              • Market trends
              • Five forces analysis

              Quantitative

              • Market size and forecast
              • Market segmentation
              • Geographical insights
              • Competitive landscape

              Interested in this report?

              Get your sample now to see our research methodology and insights!

              Download Now

              Frequently Asked Questions

              Non-Photo Personalized Gifts market growth will increase by $ 12017.1 mn during 2024-2028.

              The Non-Photo Personalized Gifts market is expected to grow at a CAGR of 10.44% during 2024-2028.

              Non-Photo Personalized Gifts market is segmented by Distribution Channel( Online, Offline, kitchenware and tableware, stationery and greeting cards, others) Type( Wearables and accessories, Decoration, Kitchenware and tableware, Stationery and greeting cards, Others)

              American Greetings Corp., American Stationery Co. Inc., Bed Bath and Beyond Inc., Card Factory Plc, Chococraft Creations Pvt. Ltd., Cimpress Plc, Etsy Inc., Ferns N Petals Pvt. Ltd., funkypigeon.com Ltd., Hallmark Card Inc., manuBIMsoft Ltd., Redbubble Ltd., Shutterfly Inc., Signature Gifts Ltd., Sixty Stores Ltd., Takara Tomy Co. Ltd., UncommonGoods LLC, Walmart Inc., Yildiz Holding AS, Zazzle Inc. are a few of the key vendors in the Non-Photo Personalized Gifts market.

              North America will register the highest growth rate of 41% among the other regions. Therefore, the Non-Photo Personalized Gifts market in North America is expected to garner significant business opportunities for the vendors during the forecast period.

              US, Germany, China, UK, Canada

              • Growing gifting culture and increasing demand for seasonal decorationsThe sales of seasonal decorations is the driving factor this market.
              • which also include personalized decorative mugs is the driving factor this market.
              • plates is the driving factor this market.
              • and handkerchiefs is the driving factor this market.
              • account for a major portion of the total revenue generated in the global non-photo personalized gifts market. The sales of these products increase is the driving factor this market.
              • particularly during holidays such as New Year is the driving factor this market.
              • Christmas is the driving factor this market.
              • Halloween is the driving factor this market.
              • Easter is the driving factor this market.
              • and Hanukkah. Although the demand for seasonal decorations and other seasonal gifts has been high in the US is the driving factor this market.
              • the UK is the driving factor this market.
              • and France is the driving factor this market.
              • consumers in APAC and Central and South America have started using personalized products. The advent of the gift-giving culture is impacted by streamlining designs and building efficient ordering processes is the driving factor this market.
              • enhancing gift customization capabilities is the driving factor this market.
              • and brainstorming new ideas to make gifting operations smooth and quick. Such measures have facilitated the retention of customers is the driving factor this market.
              • up-selling is the driving factor this market.
              • and cross-selling among retailers.Consumers offer various types of gifts is the driving factor this market.
              • such as personalized novelty and souvenirs is the driving factor this market.
              • as a social expression is the driving factor this market.
              • particularly during festivals is the driving factor this market.
              • to celebrate and cherish special moments and memories. To address the growing culture of occasional and seasonal gifting is the driving factor this market.
              • vendors also offer products that address the demand for region-specific festivals and occasions. For instance is the driving factor this market.
              • Hallmark Licensing offers gifts is the driving factor this market.
              • cards is the driving factor this market.
              • and ornaments for anniversaries is the driving factor this market.
              • birthdays is the driving factor this market.
              • graduation days is the driving factor this market.
              • military appreciation is the driving factor this market.
              • religious events is the driving factor this market.
              • and retirement. The culture of self-gifting and personalized gifts is also evolving significantly and is fueling the growth of the market. Thus is the driving factor this market.
              • the advent of gift-giving culture and the increasing demand for seasonal decorations will contribute to the demand for personalized gifts during the forecast period. is the driving factor this market.

              The Non-Photo Personalized Gifts market vendors should focus on grabbing business opportunities from the Online segment as it accounted for the largest market share in the base year.
              RIA - Research AI Assistant
              Ask RIA