North America Directional Drilling Market Analysis North America - Size and Forecast 2024-2028

North America Directional Drilling Market Analysis North America - Size and Forecast 2024-2028

Published: Feb 2024 136 Pages SKU: IRTNTR77514

Market Overview at a Glance

$1.99 B
Market Opportunity
8.04%
CAGR
7.32
YoY growth 2023-2024(%)

North America Directional Drilling Market Size 2024-2028 

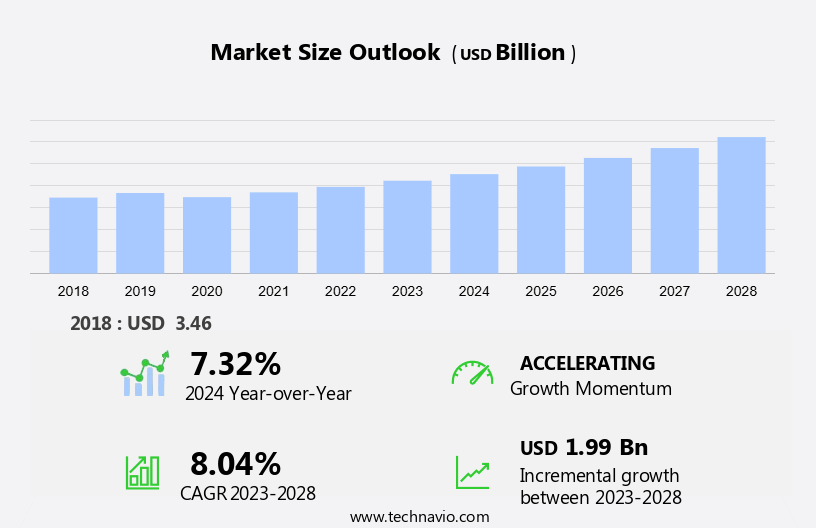
The North America directional drilling market size is forecast to increase by USD 1.99 billion at a CAGR of 8.04% between 2023 and 2028.

  • In North America, the directional drilling market is experiencing significant growth due to increased investments in the upstream oil and gas sector. The emergence of automation in directional drilling is a major trend, leading to increased efficiency and accuracy in drilling operations. Additionally, the adoption of alternative energy sources is driving the market, as directional drilling is used to access hard-to-reach reserves of natural gas and oil. Construction equipment, such as drilling rigs, is being upgraded to accommodate maximum length and diameter specifications to tackle challenging soil conditions. Crypto-asset exchanges and trading fees have not significantly impacted the market at this time.

What will be the size of the market during the forecast period?

Directional Drilling Market in North America Size

 Request Free Sample

  • The market is witnessing significant advancements driven by the increasing demand for hydrocarbon extraction and the adoption of modern techniques in drilling operations. This market caters to the exploration and production sectors of the oil and gas industry, focusing on minimizing surface disturbance and enhancing drilling efficiency. Environmental regulations are a crucial factor influencing the market. Stringent regulations aimed at reducing the environmental impact of drilling operations have led to the widespread adoption of directional drilling techniques. By drilling horizontally or at non-vertical angles, companies can minimize the number of wells required, thereby reducing the overall surface disturbance.
  • The market is characterized by the use of advanced technologies such as hydraulic jets and drill bits. These technologies enable efficient and reliable drilling in various formations, including shale, sandstone, and coal seams. The market is also witnessing the integration of real-time adjustment systems, which allow drill operators to optimize drilling parameters based on real-time data from GPS signals. The oil and gas industry's reliance on directional drilling is increasing due to the potential for exploring geothermal energy and renewable energy production. In the case of geothermal energy exploration, directional drilling enables the tapping of deep reservoirs that were previously inaccessible.

How is this market segmented and which is the largest segment?

The market research report provides comprehensive data (region-wise segment analysis), with forecasts and estimates in "USD billion" for the period 2024-2028, as well as historical data from 2018-2022 for the following segments.
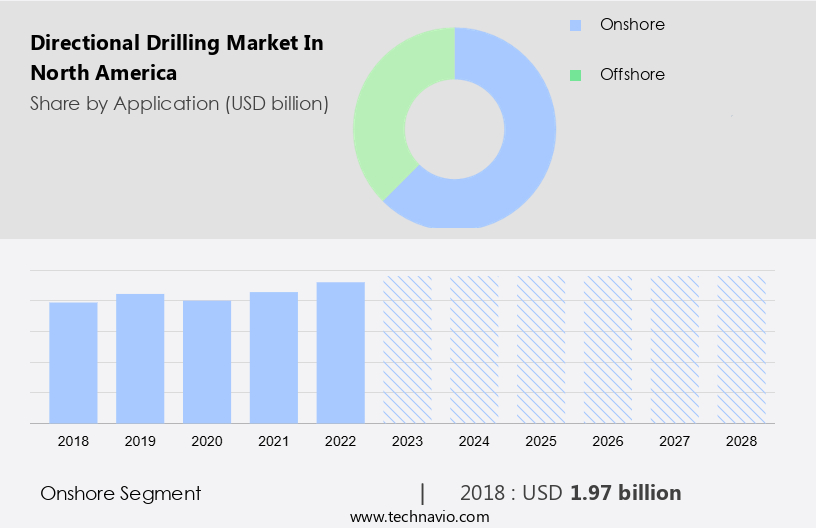
  • Application
    • Onshore
    • Offshore
  • Technique
    • Rotary steerable system
    • Conventional methods
  • Geography
    • North America
      • Canada
      • Mexico
      • US

By Application Insights

  • The onshore segment is estimated to witness significant growth during the forecast period.

The market is experiencing notable expansion, with onshore drilling projects being a key driver. On-land drilling involves the drilling of wells on property or land. This technique's affordability and accessibility make it an allure for oil and gas firms. The United States is a significant contributor to the growth of the North American onshore directional drilling market. The shale revolution has instigated an increase in onshore drilling activities, primarily in regions like the Permian Basin and the Bakken Formation. Major corporations have made substantial investments in onshore drilling projects to capitalize on the extensive shale reserves in these areas.

Furthermore, the cost-effective nature of onshore drilling, coupled with the abundance of resources, makes it a strategic choice for energy production in North America. The market's growth is influenced by the price trends of renewable energy, crude oil, and natural gas, as well as the exploitation of marine resources. 

Directional Drilling Market in North America Size

Get a glance at the market share of various segments Request Free Sample

The onshore segment was valued at  USD 1.97 billion in 2018 and showed a gradual increase during the forecast period.

Market Dynamics

Our researchers analyzed the data with 2023 as the base year, along with the key drivers, trends, and challenges. A holistic analysis of drivers will help companies refine their marketing strategies to gain a competitive advantage.

What are the key market drivers leading to the rise in the adoption of the North American directional Drilling Market?

Rising investments in the upstream oil and gas sector is the key driver of the market.

  • In response to the growing energy demands and the depletion of conventional oil and gas resources, there is a heightened focus on extracting reserves from underground reservoirs in North America. This approach is essential for securing energy supplies and increasing revenue for oil and gas operators. The drilling industry is evolving to meet these needs through the adoption of directional drilling technology. Directional drilling is a technique that enables the drilling of boreholes at precise angles, enabling access to previously inaccessible reservoirs. This method reduces the need for multiple well sites and minimizes the impact on groundwater and ecosystems.
  • It also enhances site safety by reducing the risk of gas ruptures and operational complications. The North American directional drilling market is witnessing significant growth due to the increasing investment in upstream oil and gas projects. In 2021, global upstream oil and gas investment increased by 9-10%, with three new drilling rigs added. This trend is expected to continue as companies prioritize the optimization of existing oilfields and the exploration of new resources. As the industry advances, it is crucial to prioritize environmental concerns and ensure the protection of groundwater and ecosystems. The use of directional drilling technology contributes to these efforts by reducing the number of well sites and minimizing the impact on the environment.

What are the market trends shaping the North America Directional Drilling Market?

The emergence of automation in directional drilling is the upcoming trend in the market.

  • In the oil and gas sector, directional drilling is transforming automation. Advanced technologies are increasingly being adopted by drilling companies to enhance efficiency, precision, and safety. One significant aspect of this automation is the implementation of robotic drilling systems. These systems incorporate sensors, cameras, and artificial intelligence algorithms, enabling them to make real-time adjustments during drilling processes.
  • For instance, Precision Drilling Corporation's RigSense system can identify downhole conditions and modify drilling parameters accordingly, eliminating the need for manual intervention. This results in quicker and more precise drilling. Automation in directional drilling is a game-changer in the industry, streamlining operations and improving overall productivity.

What challenges does the North American directional Drilling Market face during its growth?

Adoption of alternative energy sources is a key challenge affecting the market growth.

  • In North America, the directional drilling market is experiencing significant growth due to various factors. The increasing demand for energy and the implementation of clean energy initiatives are key drivers. Renewable energy sources, such as solar, wind, and hydropower, are becoming increasingly popular due to their clean and inexhaustible nature. Governments are taking steps to reduce greenhouse gas emissions by shifting focus from conventional fuels to renewables. The use of drilling rigs and construction equipment in the energy sector is essential for extracting resources. However, the soil conditions in North America can be challenging, requiring specialized drilling techniques. Directional drilling is a cost-effective solution for drilling in complex geological formations.
  • Moreover, the rise of crypto-asset exchanges and the associated trading fees have led to an increased focus on reducing operational costs in the energy sector. Directional drilling offers cost savings by minimizing the number of drilling sites required to extract resources. In conclusion, the market is expected to continue growing due to the increasing energy demand, the shift towards renewable energy sources, and the need to reduce operational costs. The use of drilling rigs and construction equipment in this sector will remain crucial for extracting resources efficiently, especially in challenging soil conditions.

Exclusive North America Directional Drilling Market Customer Landscape

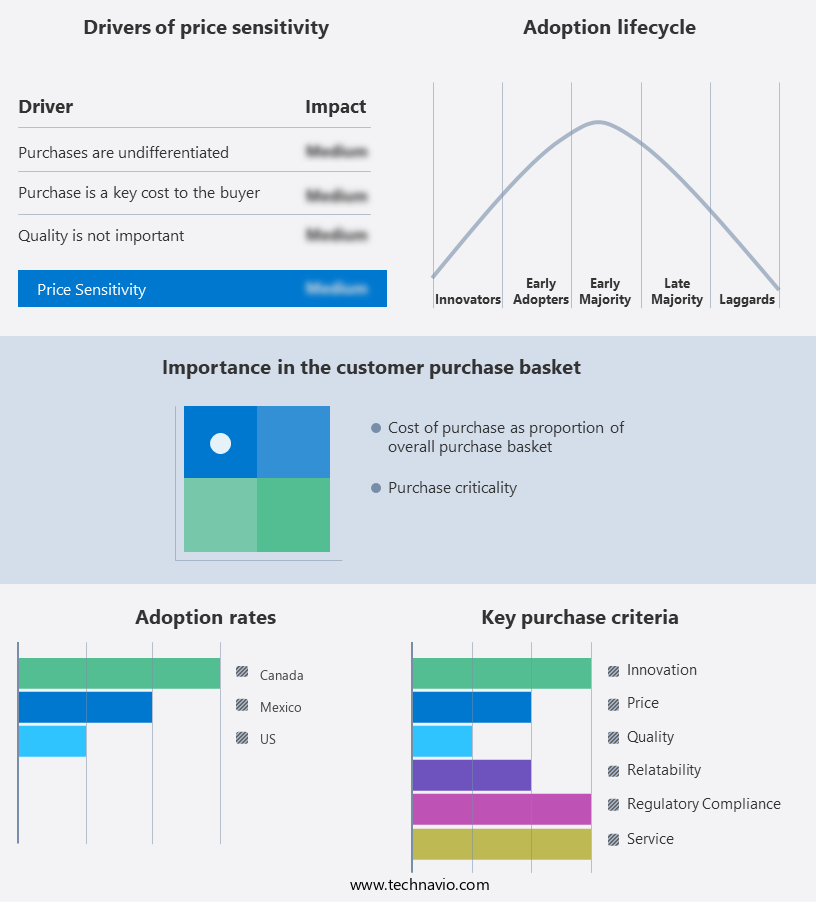
The market forecasting report includes the adoption lifecycle of the market, covering from the innovator's stage to the laggard's stage. It focuses on adoption rates in different regions based on penetration. Furthermore, the report also includes key purchase criteria and drivers of price sensitivity to help companies evaluate and develop their market growth analysis strategies.

Directional Drilling Market in North America Share by Geography

 Customer Landscape

Key Companies & Market Insights

Companies are implementing various strategies, such as strategic alliances, market forecast partnerships, mergers and acquisitions, geographical expansion, and product/service launches, to enhance their presence in the market. The market research and growth report includes detailed analyses of the competitive landscape of the market and information about key companies, including:

  • APA Corp.
  • Baker Hughes Co.
  • Cathedral Energy Services
  • Chevron Corp.
  • Direct Horizontal Drilling
  • Granite Construction Inc.
  • Halliburton Co.
  • Intrepid
  • Laney Drilling
  • LEAM Drilling Services
  • Nabors Industries Ltd.
  • NOV Inc.
  • RPB Industries Group
  • Scientific Drilling International
  • Stryker Directional
  • Terra Contracting
  • Texas Directional Boring
  • Texas Roc Contracting
  • Vermeer Corp.
  • Weatherford International Plc

Qualitative and quantitative analysis of companies has been conducted to help clients understand the wider business environment as well as the strengths and weaknesses of key market players. Data is qualitatively analyzed to categorize companies as pure play, category-focused, industry-focused, and diversified; it is quantitatively analyzed to categorize companies as dominant, leading, strong, tentative, and weak.

Research Analyst Overview

The market is witnessing significant growth due to the increasing demand for hydrocarbons, particularly oil and natural gas. This modern drilling technique allows for the efficient and cost-effective extraction of resources from oil fields and underground reservoirs, with minimal surface disturbance. The horizontal digging method, which is a popular directional drilling technique, enables drilling operations to reach oil and gas deposits located in complex formations and hard-to-reach areas. Environmental regulations are a crucial factor influencing the market. The use of modern techniques, such as real-time adjustment through GPS signals, ensures the protection of marine resources and ecosystems during offshore drilling.

Furthermore, the industry is also focusing on the exploration of geothermal energy and renewable energy production to reduce reliance on hydrocarbons. Drill operators rely on advanced drill bits and hydraulic jets to drill through various soil conditions and rock formations, ensuring maximum efficiency and reliability. Crude oil prices and natural gas prices significantly impact heating costs, electricity generation, and the construction of underground works, including vertical wells and utility pipelines. The market is also witnessing the adoption of non-vertical angle drilling, which reduces the risk of groundwater pollution and site safety concerns. The cost-effective nature of directional drilling, coupled with the ability to operate wells in various locations, makes it a preferred choice for oil and gas companies and utility pipeline construction.

Market Scope

Report Coverage

Details

Page number

136

Base year

2023

Historic period

2018-2022

Forecast period

2024-2028

Growth momentum & CAGR

Accelerate at a CAGR of 8.04%

Market Growth 2024-2028

USD 1.99 billion

Market structure

Fragmented

YoY growth 2023-2024(%)

7.32

Competitive landscape

Leading Companies, Market Positioning of Companies, Competitive Strategies, and Industry Risks

Request Free Sample

What are the Key Data Covered in this Market Report?

  • CAGR of the market during the forecast period
  • Detailed information on factors that will drive the market growth and forecasting between 2024 and 2028
  • Precise estimation of the size of the market  and its contribution of the market in focus to the parent market
  • Accurate predictions about upcoming market growth and trends and changes in consumer behaviour
  • Growth of the market across North America
  • Thorough analysis of the market's competitive landscape and detailed information about companies
  • Comprehensive analysis of factors that will challenge the growth of market companies

We can help! Our analysts can customize this market research report to meet your requirements Get in touch

1 Executive Summary

  • 1.1 Market overview
    • Exhibit 01: Executive Summary – Chart on Market Overview
    • Exhibit 02: Executive Summary – Data Table on Market Overview
    • Exhibit 03: Executive Summary – Chart on Country Market Characteristics
    • Exhibit 04: Executive Summary – Chart on Market by Geography
    • Exhibit 05: Executive Summary – Chart on Market Segmentation by Application
    • Exhibit 06: Executive Summary – Chart on Market Segmentation by Technique
    • Exhibit 07: Executive Summary – Chart on Incremental Growth
    • Exhibit 08: Executive Summary – Data Table on Incremental Growth
    • Exhibit 09: Executive Summary – Chart on Vendor Market Positioning

2 Market Landscape

  • 2.1 Market ecosystem
    • Exhibit 10: Parent market
    • Exhibit 11: Market Characteristics

3 Market Sizing

  • 3.1 Market definition
    • Exhibit 12: Offerings of vendors included in the market definition
  • 3.2 Market segment analysis
    • Exhibit 13: Market segments
  • 3.3 Market size 2023
    • 3.4 Market outlook: Forecast for 2023-2028
      • Exhibit 14: Chart on North America - Market size and forecast 2023-2028 ($ billion)
      • Exhibit 15: Data Table on Regional - Market size and forecast 2023-2028 ($ billion)
      • Exhibit 16: Chart on North America: Year-over-year growth 2023-2028 (%)
      • Exhibit 17: Data Table on Regional - Market size and forecast 2023-2028 ($ billion)

    4 Historic Market Size

    • 4.1 Directional drilling market in North America 2018 - 2022
      • Exhibit 18: Historic Market Size – Data Table on directional drilling market in north America 2018 - 2022 ($ billion)
    • 4.2 Application Segment Analysis 2018 - 2022
      • Exhibit 19: Historic Market Size – Application Segment 2018 - 2022 ($ billion)
    • 4.3 Technique Segment Analysis 2018 - 2022
      • Exhibit 20: Historic Market Size – Technique Segment 2018 - 2022 ($ billion)
    • 4.4 Geography Segment Analysis 2018 - 2022
      • Exhibit 21: Historic Market Size – Geography Segment 2018 - 2022 ($ billion)

    5 Five Forces Analysis

    • 5.1 Five forces summary
      • Exhibit 22: Five forces analysis - Comparison between 2023 and 2028
    • 5.2 Bargaining power of buyers
      • Exhibit 23: Chart on Bargaining power of buyers – Impact of key factors 2023 and 2028
    • 5.3 Bargaining power of suppliers
      • Exhibit 24: Bargaining power of suppliers – Impact of key factors in 2023 and 2028
    • 5.4 Threat of new entrants
      • Exhibit 25: Threat of new entrants – Impact of key factors in 2023 and 2028
    • 5.5 Threat of substitutes
      • Exhibit 26: Threat of substitutes – Impact of key factors in 2023 and 2028
    • 5.6 Threat of rivalry
      • Exhibit 27: Threat of rivalry – Impact of key factors in 2023 and 2028
    • 5.7 Market condition
      • Exhibit 28: Chart on Market condition - Five forces 2023 and 2028

    6 Market Segmentation by Application

    • 6.1 Market segments
      • Exhibit 29: Chart on Application - Market share 2023-2028 (%)
      • Exhibit 30: Data Table on Application - Market share 2023-2028 (%)
    • 6.2 Comparison by Application
      • Exhibit 31: Chart on Comparison by Application
      • Exhibit 32: Data Table on Comparison by Application
    • 6.3 Onshore - Market size and forecast 2023-2028
      • Exhibit 33: Chart on Onshore - Market size and forecast 2023-2028 ($ billion)
      • Exhibit 34: Data Table on Onshore - Market size and forecast 2023-2028 ($ billion)
      • Exhibit 35: Chart on Onshore - Year-over-year growth 2023-2028 (%)
      • Exhibit 36: Data Table on Onshore - Year-over-year growth 2023-2028 (%)
    • 6.4 Offshore - Market size and forecast 2023-2028
      • Exhibit 37: Chart on Offshore - Market size and forecast 2023-2028 ($ billion)
      • Exhibit 38: Data Table on Offshore - Market size and forecast 2023-2028 ($ billion)
      • Exhibit 39: Chart on Offshore - Year-over-year growth 2023-2028 (%)
      • Exhibit 40: Data Table on Offshore - Year-over-year growth 2023-2028 (%)
    • 6.5 Market opportunity by Application
      • Exhibit 41: Market opportunity by Application ($ billion)
      • Exhibit 42: Data Table on Market opportunity by Application ($ billion)

    7 Market Segmentation by Technique

    • 7.1 Market segments
      • Exhibit 43: Chart on Technique - Market share 2023-2028 (%)
      • Exhibit 44: Data Table on Technique - Market share 2023-2028 (%)
    • 7.2 Comparison by Technique
      • Exhibit 45: Chart on Comparison by Technique
      • Exhibit 46: Data Table on Comparison by Technique
    • 7.3 Rotary steerable system - Market size and forecast 2023-2028
      • Exhibit 47: Chart on Rotary steerable system - Market size and forecast 2023-2028 ($ billion)
      • Exhibit 48: Data Table on Rotary steerable system - Market size and forecast 2023-2028 ($ billion)
      • Exhibit 49: Chart on Rotary steerable system - Year-over-year growth 2023-2028 (%)
      • Exhibit 50: Data Table on Rotary steerable system - Year-over-year growth 2023-2028 (%)
    • 7.4 Conventional methods - Market size and forecast 2023-2028
      • Exhibit 51: Chart on Conventional methods - Market size and forecast 2023-2028 ($ billion)
      • Exhibit 52: Data Table on Conventional methods - Market size and forecast 2023-2028 ($ billion)
      • Exhibit 53: Chart on Conventional methods - Year-over-year growth 2023-2028 (%)
      • Exhibit 54: Data Table on Conventional methods - Year-over-year growth 2023-2028 (%)
    • 7.5 Market opportunity by Technique
      • Exhibit 55: Market opportunity by Technique ($ billion)
      • Exhibit 56: Data Table on Market opportunity by Technique ($ billion)

    8 Customer Landscape

    • 8.1 Customer landscape overview
      • Exhibit 57: Analysis of price sensitivity, lifecycle, customer purchase basket, adoption rates, and purchase criteria

    9 Geographic Landscape

    • 9.1 Geographic segmentation
      • Exhibit 58: Chart on Market share by geography - 2023-2028 (%)
      • Exhibit 59: Data Table on Market share by geography - 2023-2028 (%)
    • 9.2 Geographic comparison
      • Exhibit 60: Chart on Geographic comparison
      • Exhibit 61: Data Table on Geographic comparison
    • 9.3 US - Market size and forecast 2023-2028
      • Exhibit 62: Chart on US - Market size and forecast 2023-2028 ($ billion)
      • Exhibit 63: Data Table on US - Market size and forecast 2023-2028 ($ billion)
      • Exhibit 64: Chart on US - Year-over-year growth 2023-2028 (%)
      • Exhibit 65: Data Table on US - Year-over-year growth 2023-2028 (%)
    • 9.4 Canada - Market size and forecast 2023-2028
      • Exhibit 66: Chart on Canada - Market size and forecast 2023-2028 ($ billion)
      • Exhibit 67: Data Table on Canada - Market size and forecast 2023-2028 ($ billion)
      • Exhibit 68: Chart on Canada - Year-over-year growth 2023-2028 (%)
      • Exhibit 69: Data Table on Canada - Year-over-year growth 2023-2028 (%)
    • 9.5 Mexico - Market size and forecast 2023-2028
      • Exhibit 70: Chart on Mexico - Market size and forecast 2023-2028 ($ billion)
      • Exhibit 71: Data Table on Mexico - Market size and forecast 2023-2028 ($ billion)
      • Exhibit 72: Chart on Mexico - Year-over-year growth 2023-2028 (%)
      • Exhibit 73: Data Table on Mexico - Year-over-year growth 2023-2028 (%)
    • 9.6 Market opportunity by geography
      • Exhibit 74: Market opportunity by geography ($ billion)
      • Exhibit 75: Data Table on Market opportunity by geography ($ billion)

    10 Drivers, Challenges, and Trends

    • 10.1 Market drivers
      • 10.2 Market challenges
        • 10.3 Impact of drivers and challenges
          • Exhibit 76: Impact of drivers and challenges in 2023 and 2028
        • 10.4 Market trends

          11 Vendor Landscape

          • 11.1 Overview
            • 11.2 Vendor landscape
              • Exhibit 77: Overview on Criticality of inputs and Factors of differentiation
            • 11.3 Landscape disruption
              • Exhibit 78: Overview on factors of disruption
            • 11.4 Industry risks
              • Exhibit 79: Impact of key risks on business

            12 Vendor Analysis

            • 12.1 Vendors covered
              • Exhibit 80: Vendors covered
            • 12.2 Market positioning of vendors
              • Exhibit 81: Matrix on vendor position and classification
            • 12.3 APA Corp.
              • Exhibit 82: APA Corp. - Overview
              • Exhibit 83: APA Corp. - Product / Service
              • Exhibit 84: APA Corp. - Key offerings
            • 12.4 Baker Hughes Co.
              • Exhibit 85: Baker Hughes Co. - Overview
              • Exhibit 86: Baker Hughes Co. - Business segments
              • Exhibit 87: Baker Hughes Co. - Key news
              • Exhibit 88: Baker Hughes Co. - Key offerings
              • Exhibit 89: Baker Hughes Co. - Segment focus
            • 12.5 Cathedral Energy Services
              • Exhibit 90: Cathedral Energy Services - Overview
              • Exhibit 91: Cathedral Energy Services - Business segments
              • Exhibit 92: Cathedral Energy Services - Key offerings
              • Exhibit 93: Cathedral Energy Services - Segment focus
            • 12.6 Chevron Corp.
              • Exhibit 94: Chevron Corp. - Overview
              • Exhibit 95: Chevron Corp. - Business segments
              • Exhibit 96: Chevron Corp. - Key news
              • Exhibit 97: Chevron Corp. - Key offerings
              • Exhibit 98: Chevron Corp. - Segment focus
            • 12.7 Halliburton Co.
              • Exhibit 99: Halliburton Co. - Overview
              • Exhibit 100: Halliburton Co. - Business segments
              • Exhibit 101: Halliburton Co. - Key news
              • Exhibit 102: Halliburton Co. - Key offerings
              • Exhibit 103: Halliburton Co. - Segment focus
            • 12.8 Intrepid
              • Exhibit 104: Intrepid - Overview
              • Exhibit 105: Intrepid - Product / Service
              • Exhibit 106: Intrepid - Key offerings
            • 12.9 LEAM Drilling Services
              • Exhibit 107: LEAM Drilling Services - Overview
              • Exhibit 108: LEAM Drilling Services - Product / Service
              • Exhibit 109: LEAM Drilling Services - Key offerings
            • 12.10 Nabors Industries Ltd.
              • Exhibit 110: Nabors Industries Ltd. - Overview
              • Exhibit 111: Nabors Industries Ltd. - Business segments
              • Exhibit 112: Nabors Industries Ltd. - Key news
              • Exhibit 113: Nabors Industries Ltd. - Key offerings
              • Exhibit 114: Nabors Industries Ltd. - Segment focus
            • 12.11 NOV Inc.
              • Exhibit 115: NOV Inc. - Overview
              • Exhibit 116: NOV Inc. - Business segments
              • Exhibit 117: NOV Inc. - Key news
              • Exhibit 118: NOV Inc. - Key offerings
              • Exhibit 119: NOV Inc. - Segment focus
            • 12.12 RPB Industries Group
              • Exhibit 120: RPB Industries Group - Overview
              • Exhibit 121: RPB Industries Group - Product / Service
              • Exhibit 122: RPB Industries Group - Key offerings
            • 12.13 Scientific Drilling International
              • Exhibit 123: Scientific Drilling International - Overview
              • Exhibit 124: Scientific Drilling International - Product / Service
              • Exhibit 125: Scientific Drilling International - Key offerings
            • 12.14 Terra Contracting
              • Exhibit 126: Terra Contracting - Overview
              • Exhibit 127: Terra Contracting - Product / Service
              • Exhibit 128: Terra Contracting - Key offerings
            • 12.15 Texas Directional Boring
              • Exhibit 129: Texas Directional Boring - Overview
              • Exhibit 130: Texas Directional Boring - Product / Service
              • Exhibit 131: Texas Directional Boring - Key offerings
            • 12.16 Vermeer Corp.
              • Exhibit 132: Vermeer Corp. - Overview
              • Exhibit 133: Vermeer Corp. - Product / Service
              • Exhibit 134: Vermeer Corp. - Key offerings
            • 12.17 Weatherford International Plc
              • Exhibit 135: Weatherford International Plc - Overview
              • Exhibit 136: Weatherford International Plc - Business segments
              • Exhibit 137: Weatherford International Plc - Key news
              • Exhibit 138: Weatherford International Plc - Key offerings
              • Exhibit 139: Weatherford International Plc - Segment focus

            13 Appendix

            • 13.1 Scope of the report
              • 13.2 Inclusions and exclusions checklist
                • Exhibit 140: Inclusions checklist
                • Exhibit 141: Exclusions checklist
              • 13.3 Currency conversion rates for US$
                • Exhibit 142: Currency conversion rates for US$
              • 13.4 Research methodology
                • Exhibit 143: Research methodology
                • Exhibit 144: Validation techniques employed for market sizing
                • Exhibit 145: Information sources
              • 13.5 List of abbreviations
                • Exhibit 146: List of abbreviations

              Research Methodology

              Technavio presents a detailed picture of the market by way of study, synthesis, and summation of data from multiple sources. The analysts have presented the various facets of the market with a particular focus on identifying the key industry influencers. The data thus presented is comprehensive, reliable, and the result of extensive research, both primary and secondary.

              INFORMATION SOURCES

              Primary sources

              • Manufacturers and suppliers
              • Channel partners
              • Industry experts
              • Strategic decision makers

              Secondary sources

              • Industry journals and periodicals
              • Government data
              • Financial reports of key industry players
              • Historical data
              • Press releases

              DATA ANALYSIS

              Data Synthesis

              • Collation of data
              • Estimation of key figures
              • Analysis of derived insights

              Data Validation

              • Triangulation with data models
              • Reference against proprietary databases
              • Corroboration with industry experts

              REPORT WRITING

              Qualitative

              • Market drivers
              • Market challenges
              • Market trends
              • Five forces analysis

              Quantitative

              • Market size and forecast
              • Market segmentation
              • Geographical insights
              • Competitive landscape

              Interested in this report?

              Get your sample now to see our research methodology and insights!

              Download Now

              Frequently Asked Questions

              Directional Drillingin North America market growth will increase by $ 1.99 bn during 2024-2028.

              The Directional Drillingin North America market is expected to grow at a CAGR of 8.04% during 2024-2028.

              Directional Drillingin North America market is segmented by Application( Onshore, Offshore) Technique( Rotary steerable system, Conventional methods)

              APA Corp., Baker Hughes Co., Cathedral Energy Services, Chevron Corp., Direct Horizontal Drilling, Granite Construction Inc., Halliburton Co., Intrepid, Laney Drilling, LEAM Drilling Services, Nabors Industries Ltd., NOV Inc., RPB Industries Group, Scientific Drilling International, Stryker Directional, Terra Contracting, Texas Directional Boring, Texas Roc Contracting, Vermeer Corp., Weatherford International Plc are a few of the key vendors in the Directional Drillingin North America market.

              North America will register the highest growth rate of 100% among the other regions. Therefore, the Directional Drillingin North America market in North America is expected to garner significant business opportunities for the vendors during the forecast period.

              US, Canada, Mexico

              • Rising investments in upstream oil and gas sectorEnergy security is becoming a critical factor in most countries owing to population growth and rapid industrialization. Therefore is the driving factor this market.
              • many countries are exploring untapped oil and gas resources using advanced technologies. Moreover is the driving factor this market.
              • the production of oil and natural gas from conventional oilfields is declining. To address this issue and maximize the revenue from oilfields is the driving factor this market.
              • oil and gas operators are increasing their investments in mature oil and gas fields. Oil and gas E and P companies are also increasing their upstream investments to boost their production. In addition is the driving factor this market.
              • global upstream oil and gas investment increased by 9-10% in 2021. The investment also includes the addition of three new drilling rigs. For instance is the driving factor this market.
              • in Canada is the driving factor this market.
              • upstream oil and gas investments in British Columbia increased by around $1 billion in 2021 compared with 2020. Thus is the driving factor this market.
              • the increasing investments in the upstream oil and gas sector are likely to boost oil and gas E and P activities is the driving factor this market.
              • which is the driving factor this market.
              • in turn is the driving factor this market.
              • will drive the demand for directional drilling is the driving factor this market.
              • which will propel the growth of the directional drilling market in North America during the forecast period. is the driving factor this market.

              The Directional Drillingin North America market vendors should focus on grabbing business opportunities from the Onshore segment as it accounted for the largest market share in the base year.
              RIA - Research AI Assistant
              Ask RIA