North America Seasoning And Spices Market Size 2025-2029
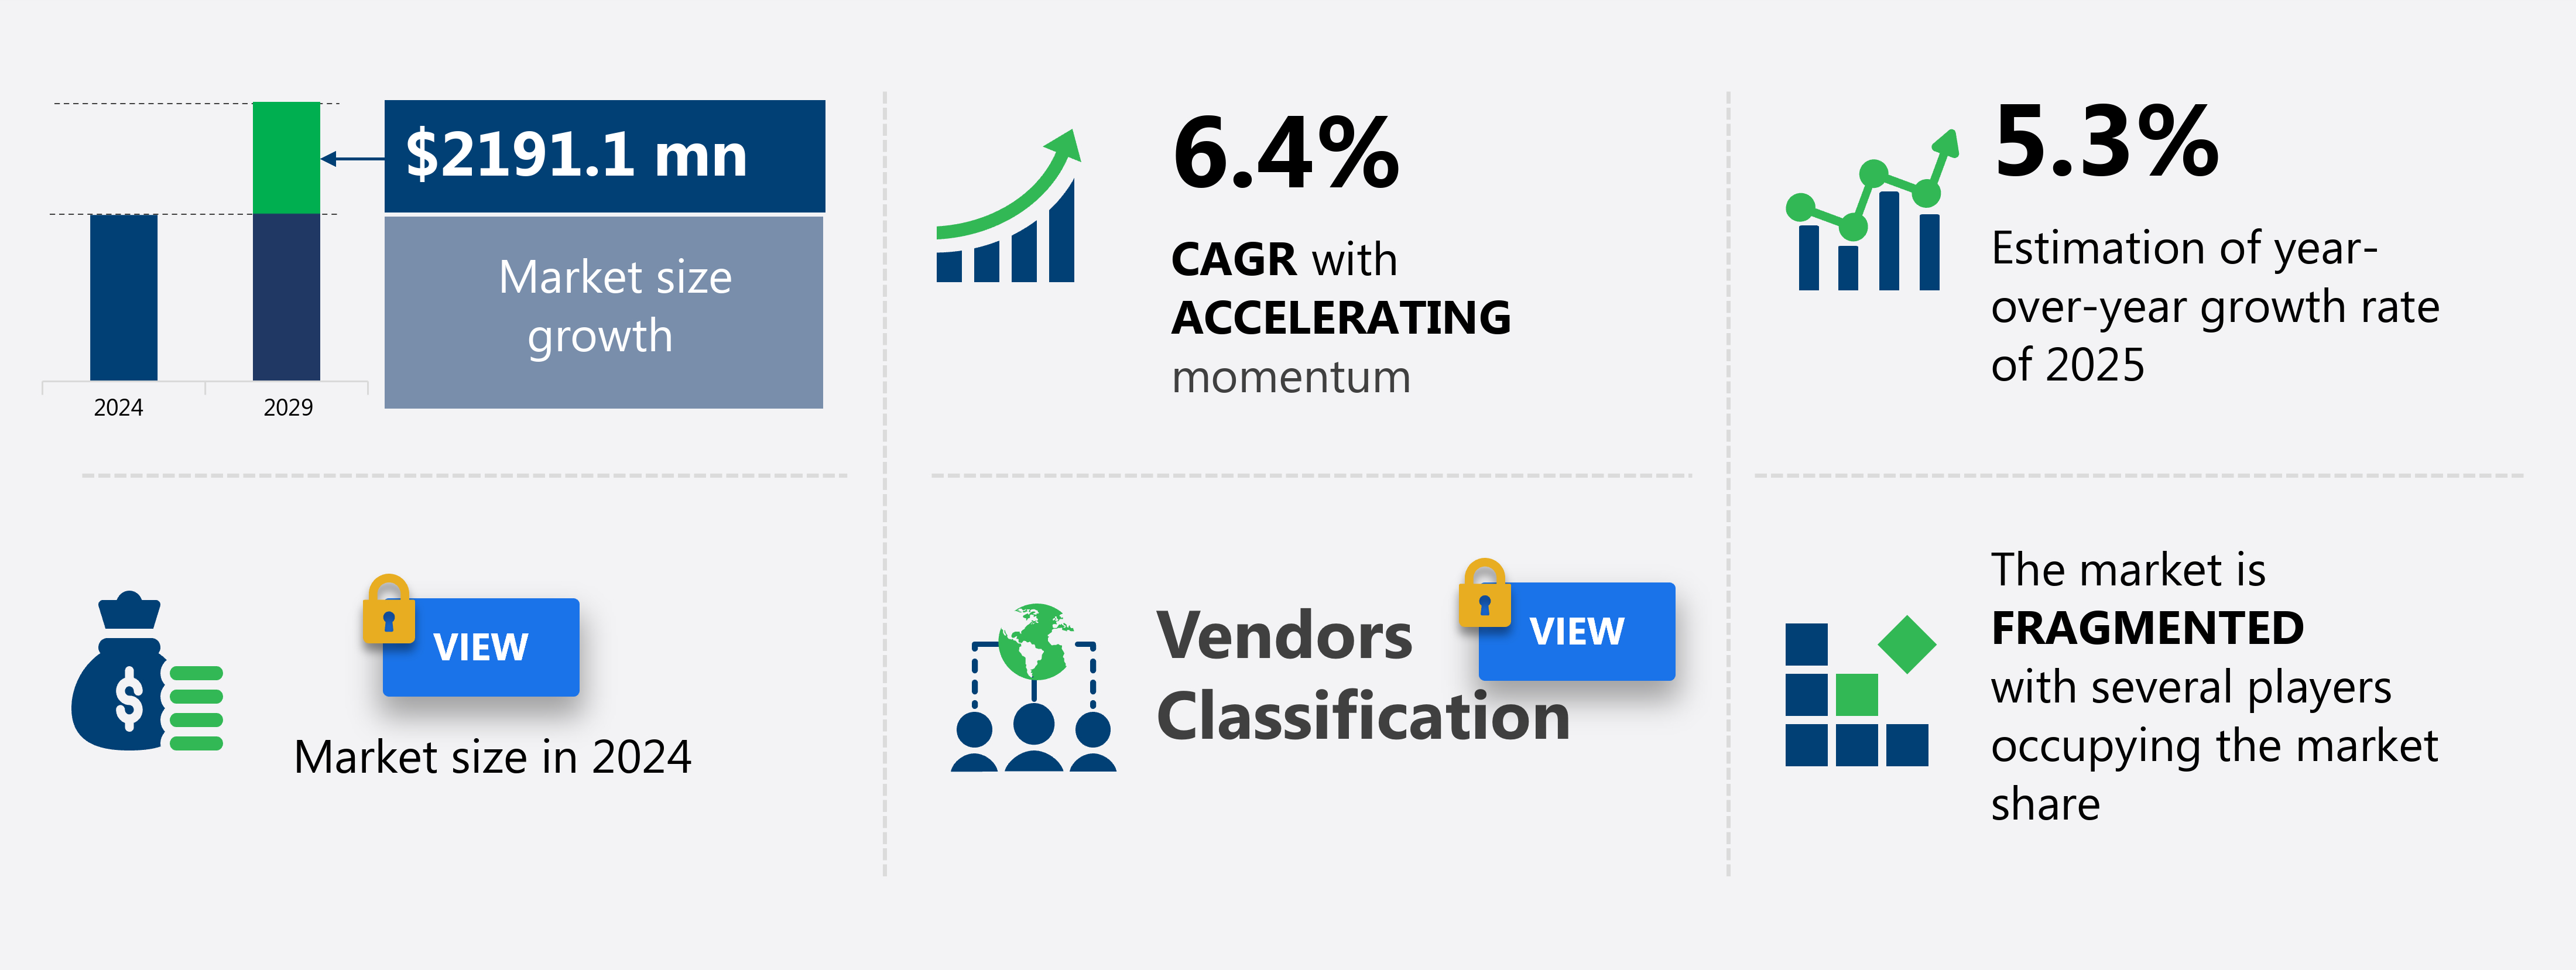
The North America seasoning and spices market size is forecast to increase by USD 2.19 billion at a CAGR of 6.4% between 2024 and 2029.
- The Seasoning and Spices market is experiencing significant growth, driven by the increasing popularity of ethnic cuisines and the rising demand for organic seasoning and spices. Consumers' expanding palates and cultural diversity are fueling the demand for a wide range of seasonings and spices, particularly those used in traditional ethnic dishes. Additionally, the health-conscious consumer trend is pushing the market towards organic offerings, as consumers seek to avoid food artificial additives and preservatives. However, the market faces challenges that may impact its growth potential. Uncertain climatic conditions in various spice-producing countries pose a significant risk to supply chain consistency and stability.
- Regulatory hurdles, including stringent food safety regulations and import/export restrictions, also impact adoption and add complexity to the market landscape. Companies seeking to capitalize on market opportunities must navigate these challenges effectively by implementing robust supply chain strategies, investing in research and development for organic offerings, and staying informed of regulatory changes to maintain compliance. By addressing these challenges and leveraging market trends, companies can position themselves for long-term success in the Seasoning and Spices market.
What will be the size of the North America Seasoning And Spices Market during the forecast period?
Explore in-depth regional segment analysis with market size data - historical 2019-2023 and forecasts 2025-2029 - in the full report.
Request Free Sample
- The seasoning and spices market is characterized by a growing emphasis on food safety certifications, as consumers demand assurance of the health and quality of their culinary ingredients. Medicinal properties and antioxidant benefits are driving the demand for specific spices, such as turmeric and ginger. Food labeling regulations are becoming more stringent, necessitating clear identification of natural colorants, flavor enhancers, and food additives. Heat units and food preservation techniques are crucial in maintaining the quality of spices throughout the supply chain. Sustainable agriculture practices, ethical sourcing, fair trade, and transparency are becoming essential considerations for businesses seeking to differentiate themselves in the market.
- Natural flavors and flavor compounds are increasingly being used for flavor enhancement and masking, while functional foods and spice trade continue to evolve, integrating the latest flavor enhancement technologies and anti-inflammatory properties. Quality control standards and adherence to food safety regulations are key to ensuring consumer trust and loyalty.
How is this market segmented?
The market research report provides comprehensive data (region-wise segment analysis), with forecasts and estimates in "USD million" for the period 2025-2029, as well as historical data from 2019-2023 for the following segments.
- End-user
- Food
- Beverages
- Industrial
- Product
- Salt and salt substitutes
- Pepper
- Dried herbs
- Individual spices
- Distribution Channel
- Supermarkets and Hypermarkets
- Online Retail
- Convenience Stores
- Specialty Stores
- Application
- Household
- Foodservice
- Food Processing
- Retail
- Form
- Whole
- Ground
- Blended
- Liquid
- Geography
- North America
- US
- Canada
- Mexico
- Europe
- France
- Germany
- UK
- Middle East and Africa
- UAE
- APAC
- Indonesia
- Malaysia
- South Korea
- Thailand
- South America
- Brazil
- North America
By End-user Insights
The food segment is estimated to witness significant growth during the forecast period.
The North American seasoning and spices market is witnessing continuous growth, driven by consumer preferences for diverse flavors and dietary trends. Culinary innovation is a significant factor influencing market dynamics, leading to the development of new product formulations, packaging, and distribution strategies. Flavor enhancement remains a priority in food preparation, resulting in increased demand for natural food coloring, essential oils, ground spices, and dried herbs. Ethnic cuisines and regional specialties are gaining popularity, fueling the demand for ethnic spices and spice blends. Food safety and regulatory compliance are crucial considerations in the market. Companies must adhere to strict labeling practices and source ingredients sustainably to meet consumer expectations and regulatory requirements.
Food technology and quality control are essential for maintaining shelf life and ensuring consistent product quality. Home cooks and food manufacturers alike seek organic and dietary restriction-compliant options, leading to increased demand for organic spices and specialized seasoning mixes. The supply chain plays a vital role in the market, with companies focusing on optimizing procurement and distribution networks to ensure consistent availability and reduce costs. Food preservation techniques, such as spice milling and spice grinding, are essential for maintaining the freshness and quality of whole spices and powdered seasonings. Gourmet spices and flavor enhancers are increasingly popular among consumers, offering unique and intense flavors to elevate culinary creations.

The Food segment was valued at USD million in 2019 and showed a gradual increase during the forecast period.
Market Dynamics
Our researchers analyzed the data with 2024 as the base year, along with the key drivers, trends, and challenges. A holistic analysis of drivers will help companies refine their marketing strategies to gain a competitive advantage.
North America seasoning and spices market size and forecast projects growth, driven by seasoning and spices market trends 2025-2029. B2B spice supply solutions leverage organic spice production technologies for quality. Seasoning and spices market growth opportunities 2025 include spices for foodservice and natural seasoning blends, meeting demand. Spice supply chain software optimizes operations, while seasoning and spices market competitive analysis highlights key suppliers. Sustainable spice production practices align with eco-friendly food trends. Seasoning and spices regulations 2025-2029 shapes spice demand in North America 2025. Premium spice solutions and seasoning and spices market insights boost adoption. Spices for retail and customized spice blends target niches. Seasoning and spices market challenges and solutions address sourcing, with direct procurement strategies for spices and spice pricing optimization enhancing profitability. Data-driven spice market analytics and organic spice trends drive innovation.
What are the North America Seasoning And Spices Market market drivers leading to the rise in adoption of the Industry?
- The surging demand for ethnic cuisines serves as the primary catalyst for market growth.
- The market is experiencing growth due to consumers' increasing experimentation with new flavors and a rising demand for authentic ethnic ingredients. Japanese restaurants, known for their light seasoning and natural flavors, have seen significant expansion in developed countries such as the US and Canada. Additionally, the popularity of Mexican, Italian, Indian, and Chinese cuisines, which offer unique ethnic tastes, has led to an increase in their availability. Flavor profiles are a key focus in the food processing industry, and advancements in spice extraction techniques have enabled the creation of more complex and nuanced flavors.
- Health trends, such as the use of natural food coloring and the reduction of artificial additives, are also influencing the market. To ensure product quality and consistency, companies employ flavor analysis, sensory evaluation, and shelf life testing. The global market for seasonings and spices encompasses a wide range of flavors, including those derived from various regions and cultures. Overall, the seasoning and spices market is expected to continue its growth trajectory due to these factors and the ongoing interest in diverse culinary experiences.
What are the North America Seasoning And Spices Market market trends shaping the Industry?
- The increasing preference for organic seasonings and spices represents a significant market trend. This demand is driven by consumers seeking healthier and more natural food options.
- The market is experiencing a notable trend towards organic options. Since the onset of 2020, the organic seasoning and spices sector has experienced significant growth due to increasing consumer awareness and preference for healthier, organic alternatives. Consumers recognize the health benefits of organic spices and herbs, leading to their growing popularity. However, the higher cost of organic spices compared to conventional ones poses a slight hindrance to market expansion. Despite this, the health-conscious consumer demographic continues to drive the adoption of organic seasoning and spices, notwithstanding their premium pricing. Essential oils, ground spices, and spice blends derived from organic sources are increasingly sought after for their perceived safety and harmonious flavors.
- Ethnic cuisines, too, are fueling the demand for ethnic spices, adding immersive layers of flavor and authenticity to dishes. Dried herbs, too, are gaining traction as consumers seek out natural, additive-free ingredients for their culinary creations. Food safety remains a top priority, with the industry focusing on rigorous sourcing and quality control measures to ensure the highest standards.
How does North America Seasoning And Spices Market market faces challenges face during its growth?
- The uncertain climatic conditions in various countries that produce spices pose a significant challenge to the industry's growth. Climatic uncertainty can lead to crop failures, reduced yields, and increased production costs, making it a critical issue that industry stakeholders must address to ensure long-term sustainability and profitability.
- The seasoning and spices market is subject to various external factors that can impact its production and supply chain. Natural disasters and adverse weather conditions pose significant risks to the quality and availability of raw materials. Drought, flood, earthquakes, frosts, and pestilence can reduce crop yield or damage ingredients, leading to increased manufacturing and processing costs for companies. Furthermore, reliance on overseas suppliers for raw materials exposes North American businesses to potential losses if their suppliers experience unfavorable climatic conditions or natural disasters. Food preservation techniques and food technology play crucial roles in mitigating these risks and ensuring the consistent quality of seasoning and spice products.
- Food science and quality control measures are essential for maintaining the integrity of these ingredients, especially for home cooks seeking authentic regional specialties and specialty spices. Despite these challenges, the seasoning and spices market continues to thrive, offering a rich and diverse range of flavors and aromas to consumers.
Exclusive North America Seasoning And Spices Market Customer Landscape
The market forecasting report includes the adoption lifecycle of the market, covering from the innovator's stage to the laggard's stage. It focuses on adoption rates in different regions based on penetration. Furthermore, the report also includes key purchase criteria and drivers of price sensitivity to help companies evaluate and develop their market growth analysis strategies.
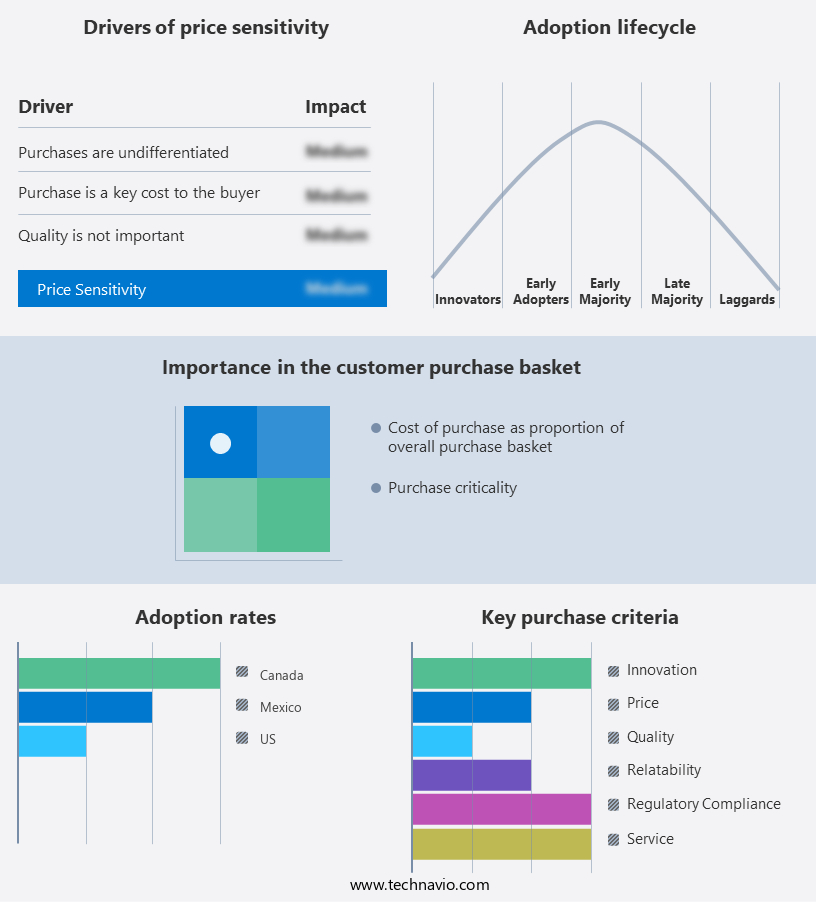
Customer Landscape
Key Companies & Market Insights
Companies are implementing various strategies, such as strategic alliances, market forecast partnerships, mergers and acquisitions, geographical expansion, and product/service launches, to enhance their presence in the market.
The market research and growth report includes detailed analyses of the competitive landscape of the market and information about key companies, including:
- Ajinomoto Co. Inc.
- All Seasonings Ingredients Inc.
- C.H. Guenther and Son Inc.
- Cargill Inc.
- De Silva Brothers and Co.
- Dohler GmbH
- Frontier Co op.
- Fuchs North America
- Horton Spice Mills Ltd.
- Kerry Group Plc
- McCormick and Co. Inc.
- Olam Group Ltd.
- Organic Spices Inc.
- Spicy Organic LLC
- SR Spices LLC
- The Kraft Heinz Co.
- Unilever PLC
- Woodland Foods Ltd.
Qualitative and quantitative analysis of companies has been conducted to help clients understand the wider business environment as well as the strengths and weaknesses of key market players. Data is qualitatively analyzed to categorize companies as pure play, category-focused, industry-focused, and diversified; it is quantitatively analyzed to categorize companies as dominant, leading, strong, tentative, and weak.
Recent Development and News in Seasoning And Spices Market In North America
- In February 2023, McCormick & Company, a leading global spice and seasoning manufacturer, introduced a new line of organic and non-GMO certified spice blends under its popular brand, Schwartz. This expansion catered to the growing consumer demand for natural and organic food products (McCormick & Company Press Release).
- In May 2024, Dohler, a global ingredient solutions provider, announced a strategic partnership with Spice Bridge, a U.S.-based spice company. This collaboration aimed to develop and commercialize innovative spice and seasoning solutions for the food and beverage industry (Dohler Press Release).
- In September 2024, Kerry Group, a global taste and nutrition company, completed the acquisition of Bio-Techne Corporation's food business. This acquisition significantly expanded Kerry's spice and seasoning capabilities, strengthening its position in the market (Kerry Group Press Release).
- In January 2025, the European Union (EU) approved new regulations for the labeling of spices and herbs. These regulations mandated the listing of individual spices and herbs in the ingredient list, instead of using generic terms like "spice blend" (European Commission Press Release). This change was expected to increase transparency and provide consumers with more accurate information about the products they were purchasing.
Research Analyst Overview
The seasoning and spices market continues to evolve, driven by shifting consumer preferences and advancements in food technology. Flavor profiles are a key focus, with spice extraction techniques enabling deeper, more complex flavors. Health trends influence the market, as consumers seek natural food coloring and organic options. Food processing innovations facilitate the use of ground spices, dried herbs, and ethnic spices in various sectors, from food manufacturing to home cooking. Food safety remains a critical concern, driving demand for stringent quality control measures and sensory evaluation. Global flavors inspire new product development, with regional specialties and specialty spices gaining popularity.
Spice blends and flavor enhancers enhance taste and extend shelf life, while ingredient sourcing becomes increasingly important for transparency and sustainability. Ethnic cuisines fuel innovation, with natural food coloring and organic spices catering to dietary restrictions. Food preservation techniques ensure the freshness of whole spices and powdered seasonings. The supply chain is optimized through food technology and logistics advancements, enabling efficient ingredient sourcing and timely delivery. Food science continues to uncover new applications for essential oils and dried herbs, while gourmet spices and spice milling techniques cater to the growing demand for high-end culinary experiences. Spice grinding and seasoning mixes add convenience for home cooks and food manufacturers alike.
The market's continuous dynamism reflects the ongoing unfolding of market activities and evolving patterns.
Dive into Technavio's robust research methodology, blending expert interviews, extensive data synthesis, and validated models for unparalleled Seasoning And Spices Market in North America insights. See full methodology.
|
Market Scope |
|
|
Report Coverage |
Details |
|
Page number |
181 |
|
Base year |
2024 |
|
Historic period |
2019-2023 |
|
Forecast period |
2025-2029 |
|
Growth momentum & CAGR |
Accelerate at a CAGR of 6.4% |
|
Market growth 2025-2029 |
USD 2191.1 million |
|
Market structure |
Fragmented |
|
YoY growth 2024-2025(%) |
5.3 |
|
Competitive landscape |
Leading Companies, Market Positioning of Companies, Competitive Strategies, and Industry Risks |
What are the Key Data Covered in this Market Research Report?
- CAGR of the market during the forecast period
- Detailed information on factors that will drive the market growth and forecasting between 2025 and 2029
- Precise estimation of the size of the market and its contribution of the market in focus to the parent market
- Accurate predictions about upcoming market growth and trends and changes in consumer behaviour
- Growth of the market across North America
- Thorough analysis of the market's competitive landscape and detailed information about companies
- Comprehensive analysis of factors that will challenge the growth of market companies
We can help! Our analysts can customize this market research report to meet your requirements Get in touch
 RIA -
RIA - 
