Oilfield Casing Spools Market Size 2026-2030
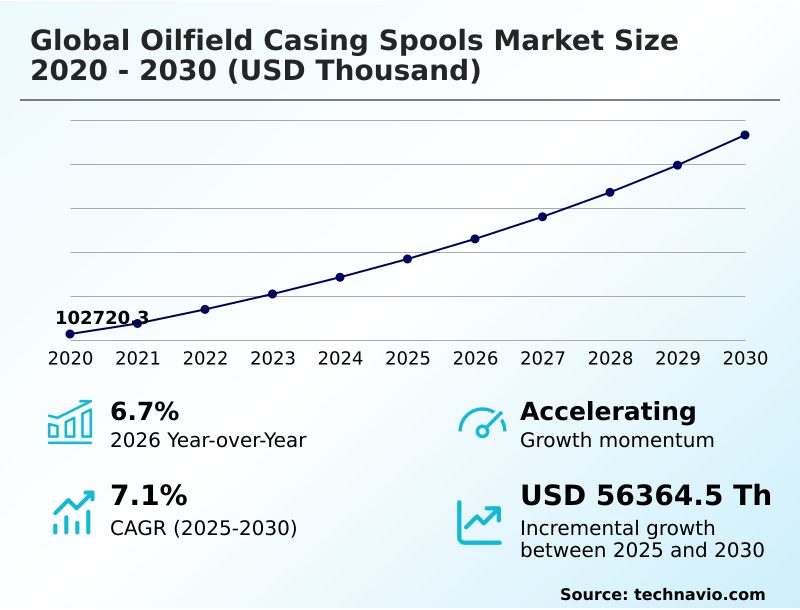
The oilfield casing spools market size is valued to increase by USD 56.36 million, at a CAGR of 7.1% from 2025 to 2030. Increasing investments in upstream oil and gas operations will drive the oilfield casing spools market.
Major Market Trends & Insights
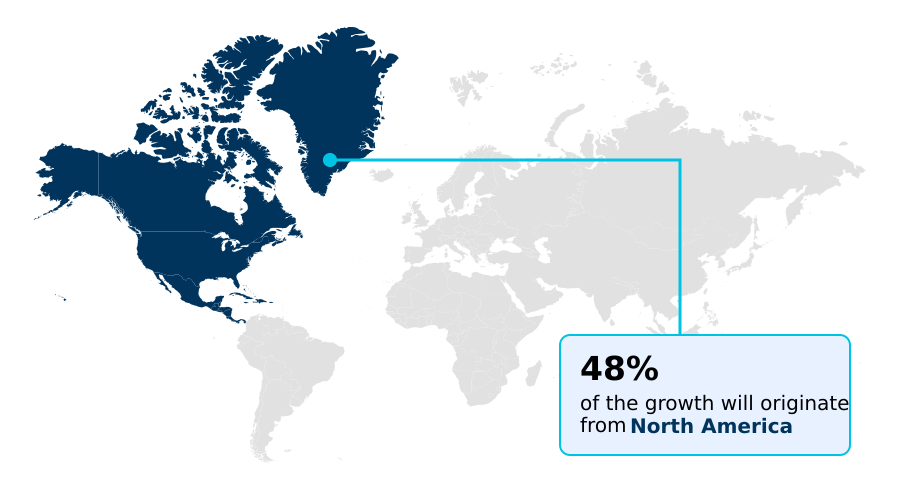
- North America dominated the market and accounted for a 48.4% growth during the forecast period.
- By Type - Stainless steel segment was valued at USD 87.80 million in 2024
- By Application - Onshore segment accounted for the largest market revenue share in 2024
Market Size & Forecast
- Market Opportunities:
- Market Future Opportunities: USD 56.36 million
- CAGR from 2025 to 2030 : 7.1%
Market Summary
- The oilfield casing spools market is defined by its critical role in ensuring safety and efficiency in energy exploration and production. Demand is fundamentally tied to drilling activities, with rising global energy needs and increased investment in upstream operations acting as primary drivers.
- A significant trend is the development of innovative spool technologies, including the use of advanced corrosion resistant alloys and integrated sensors for real-time monitoring, particularly for high-pressure high-temperature (HPHT) and sour gas service applications. For instance, operators deploying modular wellhead systems featuring advanced metal-to-metal seals in unconventional shale plays have managed to reduce installation times, directly impacting operational costs.
- However, the industry grapples with challenges such as the high operational risks associated with deepwater drilling and price volatility in the oil and gas sector, which can lead to delayed or canceled projects. The market is also adapting to the energy transition, with wellhead technologies being repurposed for geothermal energy and carbon capture, and storage (CCS) applications, ensuring continued relevance.
What will be the Size of the Oilfield Casing Spools Market during the forecast period?
Get Key Insights on Market Forecast (PDF) Get Free Sample
How is the Oilfield Casing Spools Market Segmented?
The oilfield casing spools industry research report provides comprehensive data (region-wise segment analysis), with forecasts and estimates in "USD thousand" for the period 2026-2030, as well as historical data from 2020-2024 for the following segments.
- Type
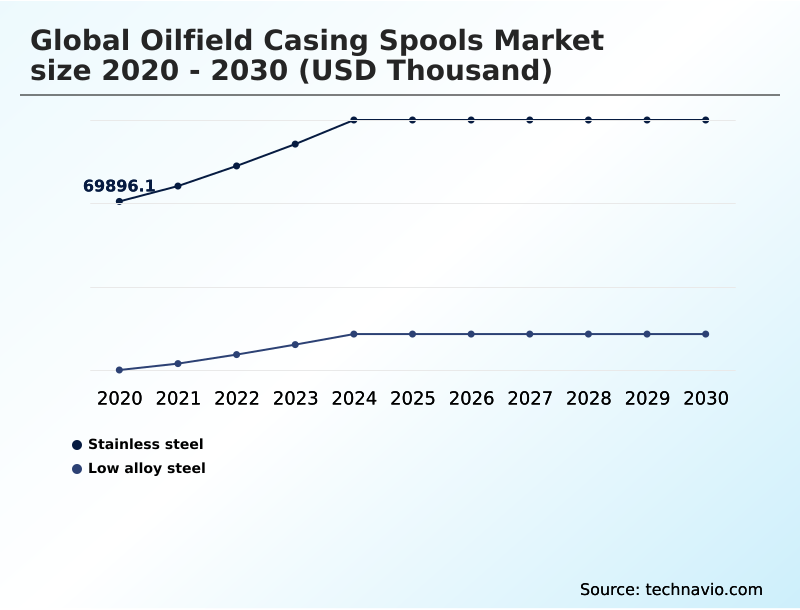
- Stainless steel
- Low alloy steel
- Application
- Onshore
- Offshore
- Product
- Range 1
- Range 2
- Range 3
- Geography
- North America
- US
- Canada
- Mexico
- APAC
- China
- India
- Indonesia
- Europe
- UK
- Germany
- France
- Middle East and Africa
- Saudi Arabia
- UAE
- Turkey
- South America
- Brazil
- Argentina
- Rest of World (ROW)
- North America
By Type Insights
The stainless steel segment is estimated to witness significant growth during the forecast period.
The stainless steel segment is crucial for demanding applications in the upstream oil and gas sector. These specialized corrosion resistant alloys are essential for sour gas service and deepwater drilling operations, where material failure is not an option.
Petroleum exploration projects in harsh environments rely on stainless steel components to maintain wellbore integrity over the well's lifespan. Advanced metal-to-metal seal technologies are often integrated into these systems, providing superior containment compared to standard options.
In offshore production platforms, using stainless steel spools for well intervention services can reduce maintenance cycles by over 20%, ensuring long-term operational reliability and safety in high-stakes environments.
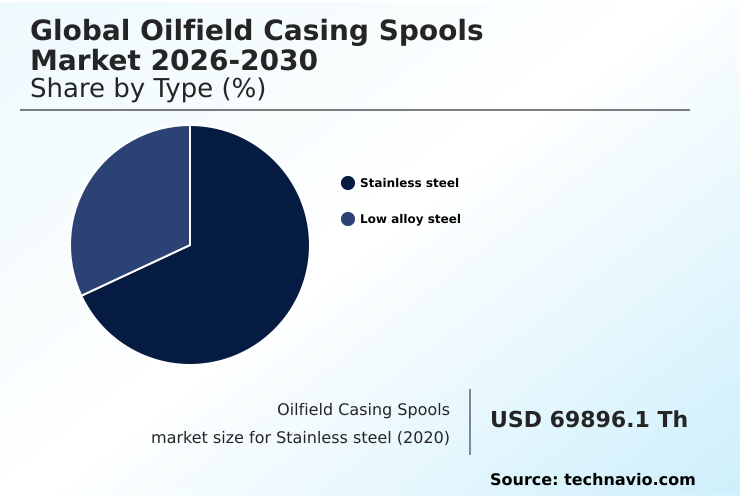
The Stainless steel segment was valued at USD 87.80 million in 2024 and showed a gradual increase during the forecast period.
Regional Analysis
North America is estimated to contribute 48.4% to the growth of the global market during the forecast period.Technavio’s analysts have elaborately explained the regional trends and drivers that shape the market during the forecast period.
See How Oilfield Casing Spools Market Demand is Rising in North America Get Free Sample
North America leads the market, contributing 48.4% of the incremental growth, driven by extensive activity on onshore drilling rigs and new petroleum exploration projects. The region's focus is on advanced surface wellhead integration and efficient wellhead pressure management.
APAC is the fastest-growing region, with a strong focus on expanding downhole tool manufacturing capabilities to support both conventional and unconventional plays.
Europe is concentrating on high-tech subsea wellhead applications and adapting tubular suspension unit designs for geothermal energy drilling and carbon capture and storage (CCS) well projects.
In contrast, South America’s growth is fueled by deepwater projects requiring specialized well intervention services and robust hardware.
Market Dynamics
Our researchers analyzed the data with 2025 as the base year, along with the key drivers, trends, and challenges. A holistic analysis of drivers will help companies refine their marketing strategies to gain a competitive advantage.
- Strategic decision-making in the global oilfield casing spools market 2026-2030 requires a deep understanding of specific applications and environmental conditions. For instance, selecting the right casing spool for sour gas service is critical to prevent catastrophic failures, while high pressure subsea wellhead design demands advanced engineering to handle extreme depths.
- The industry is focused on managing hydraulic fracturing well pressure in unconventional shale plays, often necessitating a choice between stainless steel vs low alloy materials. Operational challenges, such as wellhead maintenance in North Sea environments, drive innovation in both materials and processes. Adherence to API 6A casing spool requirements is non-negotiable for ensuring safety and interoperability.
- The spool selection for deepwater wells is a complex process involving casing hanger load capacity calculation and analysis of corrosion resistance in marine environments. Onshore, multi-well pad configuration has become standard, promoting solutions that focus on reducing rig time with modular wellheads. This can lead to operational cost savings of up to 15% compared to single-well setups.
- Furthermore, the market is adapting to new frontiers, including developing wellhead components for geothermal wells and casing spool for carbon sequestration projects, ensuring long-term relevance.
What are the key market drivers leading to the rise in the adoption of Oilfield Casing Spools Industry?
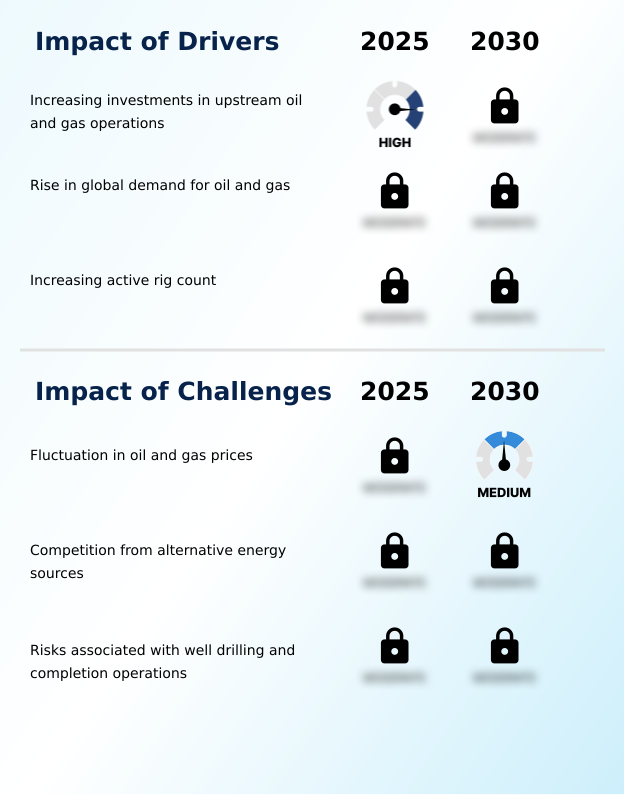
- Increasing investments in upstream oil and gas operations are a key driver for market growth.
- Rising upstream capital expenditure is a primary driver, directly fueling demand for new pressure control equipment. As the active rig count metric increases, particularly for enhanced oil recovery (EOR) projects, the need for robust hardware grows.
- Oilfield service providers are seeing increased orders for components that meet the stringent API 6A standard, especially for high-pressure high-temperature (HPHT) applications. Forged steel body spools with advanced casing hanger designs are critical for reservoir performance optimization.
- Investment in these technologies allows operators to achieve a 5% improvement in production uptime in mature fields, justifying the initial capital outlay and driving market expansion.
What are the market trends shaping the Oilfield Casing Spools Industry?
- The development of innovative spool technologies for oil drilling is a prominent market trend. Manufacturers are focused on enhancing wellhead safety and operational efficiency.
- A key trend is the development of innovative technologies to enhance efficiency in shale gas exploration and the extraction of other unconventional resources. The adoption of multi-bowl wellhead systems on onshore drilling rigs reduces installation steps, improving rig-up times by 15%. For subsea production systems, advancements focus on improving the reliability of the flanged connection and side outlet valve configurations.
- The integration of improved lock screw mechanism designs simplifies drilling and evaluation processes. As fields mature, demand for advanced hardware for well plugging and abandonment is also increasing, with new designs streamlining decommissioning operations by up to 10%, ensuring long-term environmental compliance.
What challenges does the Oilfield Casing Spools Industry face during its growth?
- Fluctuations in oil and gas prices represent a key challenge, creating fiscal uncertainty that impacts industry growth.
- Operational risks present a significant challenge, particularly in complex well completion operations. Failures in annular sealing can compromise safety, necessitating advanced subsea engineering solutions and thermally stable elastomers that perform under pressure. The integration of a blowout preventer (BOP) with the wellhead is a critical step managed by well construction services, where any misalignment increases drilling riser stress.
- While production automation software and managed pressure drilling techniques mitigate some risks, the complexity of tubular running services in deepwater environments remains a concern. These operational hurdles can increase project costs by as much as 25% due to non-productive time, constraining investment in new technologies.
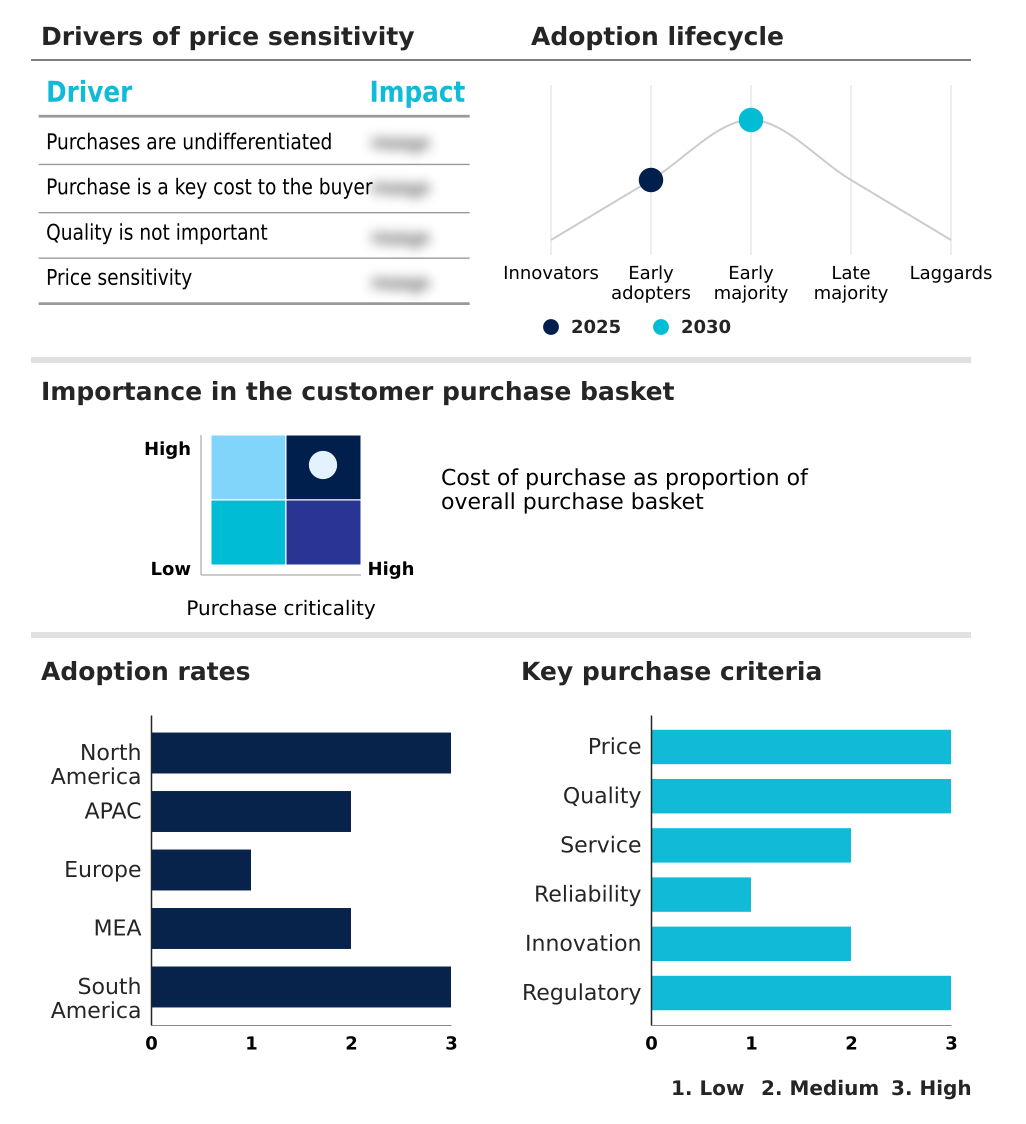
Exclusive Technavio Analysis on Customer Landscape
The oilfield casing spools market forecasting report includes the adoption lifecycle of the market, covering from the innovator’s stage to the laggard’s stage. It focuses on adoption rates in different regions based on penetration. Furthermore, the oilfield casing spools market report also includes key purchase criteria and drivers of price sensitivity to help companies evaluate and develop their market growth analysis strategies.
Customer Landscape of Oilfield Casing Spools Industry
Competitive Landscape
Companies are implementing various strategies, such as strategic alliances, oilfield casing spools market forecast, partnerships, mergers and acquisitions, geographical expansion, and product/service launches, to enhance their presence in the industry.
Baker Hughes Co. - Offerings include specialized oilfield casing spools for reliable wellhead pressure control, securing downhole instrumentation in diverse drilling and production operations.
The industry research and growth report includes detailed analyses of the competitive landscape of the market and information about key companies, including:
- Baker Hughes Co.
- CCSC Petroleum Equipment Co.
- Control Flow Inc.
- Delta Corp.
- Integrated Equipment Inc.
- Jereh Group
- Jiangsu Hongfei Petroleum
- Lake Petro.
- NOV Inc.
- Parveen Industries Pvt. Ltd.
- Sakward Oilfield Manufacturing
- Schlumberger Ltd.
- Sentry Wellhead Systems LLC
- Shaanxi FYPE Rigid Machinery Co
- SPM Oil and Gas
- Stream Flo Industries Ltd.
- TechnipFMC plc
- Tiger Valve Co.
- Weatherford International Plc
- Worldwide Oilfield Machine Inc
Qualitative and quantitative analysis of companies has been conducted to help clients understand the wider business environment as well as the strengths and weaknesses of key industry players. Data is qualitatively analyzed to categorize companies as pure play, category-focused, industry-focused, and diversified; it is quantitatively analyzed to categorize companies as dominant, leading, strong, tentative, and weak.
Recent Development and News in Oilfield casing spools market
- In August 2025, Tenaris announced a new supply chain initiative aimed at reducing the cost of its wellhead components by utilizing a more localized network of steel mills and adopting advanced lean manufacturing principles.
- In September 2025, Eni successfully commenced production from its deepwater project in the Mediterranean utilizing a new generation of high fatigue resistant casing spools designed for extreme depths.
- In January 2025, SLB reported a strategic adjustment to its drilling equipment division in response to a sudden shift in North American gas pricing benchmarks.
- In March 2025, Baker Hughes introduced a new series of real time wellbore monitoring tools designed specifically to mitigate the risks of pressure imbalances during the casing process.
Dive into Technavio’s robust research methodology, blending expert interviews, extensive data synthesis, and validated models for unparalleled Oilfield Casing Spools Market insights. See full methodology.
| Market Scope | |
|---|---|
| Page number | 290 |
| Base year | 2025 |
| Historic period | 2020-2024 |
| Forecast period | 2026-2030 |
| Growth momentum & CAGR | Accelerate at a CAGR of 7.1% |
| Market growth 2026-2030 | USD 56364.5 thousand |
| Market structure | Fragmented |
| YoY growth 2025-2026(%) | 6.7% |
| Key countries | US, Canada, Mexico, China, India, Indonesia, Australia, Japan, South Korea, UK, Germany, France, Italy, The Netherlands, Spain, Saudi Arabia, UAE, Turkey, Israel, South Africa, Brazil, Argentina and Chile |
| Competitive landscape | Leading Companies, Market Positioning of Companies, Competitive Strategies, and Industry Risks |
Research Analyst Overview
- The oilfield casing spools market is integral to upstream operations, with its trajectory tied to the technical demands of modern drilling. The emphasis is on enhancing wellbore integrity through advanced components like the casing hanger and robust wellhead assembly units. The integration of the blowout preventer (BOP) remains a critical safety procedure, necessitating precise engineering of all interfacing hardware.
- Key innovations include advanced metal-to-metal seal technology and multi-bowl wellhead systems, which improve efficiency in well completion operations. For high-pressure high-temperature (HPHT) and sour gas service environments, the use of specialized corrosion resistant alloys in the forged steel body is standard. Components must adhere to the API 6A standard to ensure reliability.
- The shift toward subsea wellhead and complex subsea production systems is driving demand for more sophisticated pressure control equipment and tubular suspension units. Innovations in annular sealing and thermally stable elastomers are critical, as they enable operators to reduce downtime associated with seal failure by over 30% in deepwater applications, directly impacting project viability.
What are the Key Data Covered in this Oilfield Casing Spools Market Research and Growth Report?
-
What is the expected growth of the Oilfield Casing Spools Market between 2026 and 2030?
-
USD 56.36 million, at a CAGR of 7.1%
-
-
What segmentation does the market report cover?
-
The report is segmented by Type (Stainless steel, and Low alloy steel), Application (Onshore, and Offshore), Product (Range 1, Range 2, and Range 3) and Geography (North America, APAC, Europe, Middle East and Africa, South America)
-
-
Which regions are analyzed in the report?
-
North America, APAC, Europe, Middle East and Africa and South America
-
-
What are the key growth drivers and market challenges?
-
Increasing investments in upstream oil and gas operations, Fluctuation in oil and gas prices
-
-
Who are the major players in the Oilfield Casing Spools Market?
-
Baker Hughes Co., CCSC Petroleum Equipment Co., Control Flow Inc., Delta Corp., Integrated Equipment Inc., Jereh Group, Jiangsu Hongfei Petroleum, Lake Petro., NOV Inc., Parveen Industries Pvt. Ltd., Sakward Oilfield Manufacturing, Schlumberger Ltd., Sentry Wellhead Systems LLC, Shaanxi FYPE Rigid Machinery Co, SPM Oil and Gas, Stream Flo Industries Ltd., TechnipFMC plc, Tiger Valve Co., Weatherford International Plc and Worldwide Oilfield Machine Inc
-
Market Research Insights
- The market is shaped by a dynamic interplay of operational demands and strategic investments. Growth in unconventional resources and deepwater drilling projects is expanding the need for advanced equipment. Oilfield service providers are instrumental in deploying technologies for reservoir performance optimization and managed pressure drilling.
- For instance, the adoption of integrated systems for well construction services has been shown to improve project efficiency by over 12% compared to traditional component-based approaches. Furthermore, a focus on upstream capital expenditure is driving demand, with companies that invest in high-spec production automation software reporting a 15% faster return on investment in new wells.
- This underscores a market where technological adoption is directly linked to measurable financial and operational gains.
We can help! Our analysts can customize this oilfield casing spools market research report to meet your requirements.
 RIA -
RIA - 
