
Oncology Information Systems Market Analysis, Size, and Forecast 2026-2030: North America (US, Canada, and Mexico), APAC (China, Japan, and India), Europe (Germany, UK, and France), South America (Brazil, Argentina, and Chile), Middle East and Africa (Saudi Arabia, UAE, and South Africa), and Rest of World (ROW)

Oncology Information Systems Market Analysis, Size, and Forecast 2026-2030:
North America (US, Canada, and Mexico), APAC (China, Japan, and India), Europe (Germany, UK, and France), South America (Brazil, Argentina, and Chile), Middle East and Africa (Saudi Arabia, UAE, and South Africa), and Rest of World (ROW)

Published: Oct 2026 299 Pages SKU: IRTNTR71648

Market Overview at a Glance

$1.31 B
Market Opportunity
6.7%
CAGR 2025 - 2030
43.7%
North America Growth
$1.90 B
Software segment 2024

Oncology Information Systems Market Size 2026-2030

The oncology information systems market size is valued to increase by USD 1.31 billion, at a CAGR of 6.7% from 2025 to 2030. Increasing global prevalence of cancer will drive the oncology information systems market.

Major Market Trends & Insights

  • North America dominated the market and accounted for a 43.7% growth during the forecast period.
  • By Product - Software segment was valued at USD 1.90 billion in 2024
  • By Application - Medical oncology segment accounted for the largest market revenue share in 2024

Market Size & Forecast

  • Market Opportunities: USD 2.19 billion
  • Market Future Opportunities: USD 1.31 billion
  • CAGR from 2025 to 2030 : 6.7%

Market Summary

  • The Oncology Information Systems Market functions as the critical digital infrastructure centralizing complex clinical and administrative data for comprehensive cancer care. Driven by the escalating incidence of malignancies, healthcare networks are compelled to adopt sophisticated electronic medical records that facilitate seamless data integration across disparate hospital departments.
  • This rising patient volume directly increases the demand for specialized platforms capable of handling intricate medication protocols and targeted therapy regimens. However, the substantial capital required for legacy architecture migration and ongoing cybersecurity maintenance creates a significant barrier to entry, particularly for smaller community clinics operating under strict budget constraints.
  • In a practical business scenario, regional hospital networks deploying these advanced systems achieved a 25% improvement in patient scheduling efficiency and reduced medication administration errors. By utilizing automated organ mapping and predictive response modeling, clinical teams optimize resource allocation across busy radiation vaults.
  • Ultimately, the transition toward interoperable clinical networks ensures that multidisciplinary medical teams can synchronize treatment strategies efficiently, though integration complexities continue to challenge IT modernization efforts.

What will be the Size of the Oncology Information Systems Market during the forecast period?
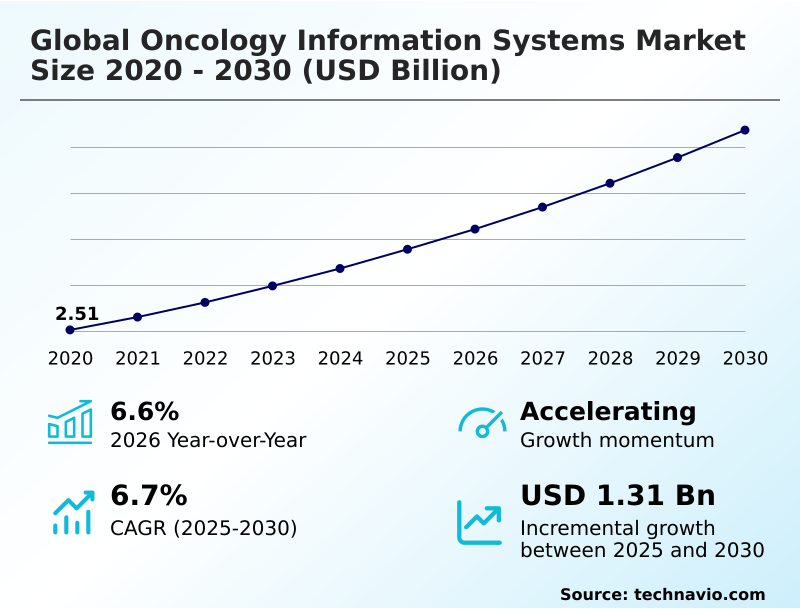
Get Key Insights on Market Forecast (PDF) Get Free Sample

How is the Oncology Information Systems Market Segmented?

The oncology information systems industry research report provides comprehensive data (region-wise segment analysis), with forecasts and estimates in "USD million" for the period 2026-2030, as well as historical data from 2020-2024 for the following segments.

  • Product
    • Software
    • Services
  • Application
    • Medical oncology
    • Radiation oncology
    • Surgical oncology
  • Deployment
    • On-premises
    • Cloud-based
    • Hybrid
  • Geography
    • North America
      • US
      • Canada
      • Mexico
    • APAC
      • China
      • Japan
      • India
      • South Korea
      • Australia
      • Singapore
    • Europe
      • Germany
      • UK
      • France
      • Italy
      • Spain
      • The Netherlands
    • South America
      • Brazil
      • Argentina
      • Chile
    • Middle East and Africa
      • Saudi Arabia
      • UAE
      • South Africa
      • Israel
      • Egypt

By Product Insights

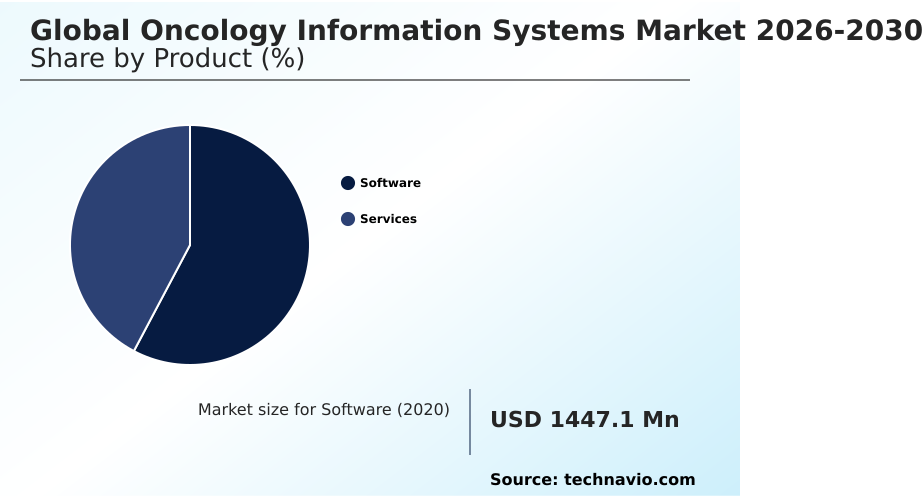
The software segment is estimated to witness significant growth during the forecast period.

Software platforms act as the operational core for complex radiation therapy workflows across modern cancer care facilities. By centralizing multi-modality data aggregation and health level seven standards, these digital architectures streamline stereotactic body radiation and automate treatment fractionation scheduling.

Institutions deploying advanced software modules report that integrating magnetic resonance planning improves treatment accuracy by 15%, reducing manual documentation errors significantly. The transition toward unified software enables seamless robotic-assisted surgery integration, linking surgical suites with treatment cycle tracking data.

Consequently, enterprise software deployments drive operational precision, allowing healthcare systems to optimize resource utilization while managing intricate proton beam therapy protocols effectively without disrupting daily clinical operations.
Get Free Sample

The Software segment was valued at USD 1.90 billion in 2024 and showed a gradual increase during the forecast period.
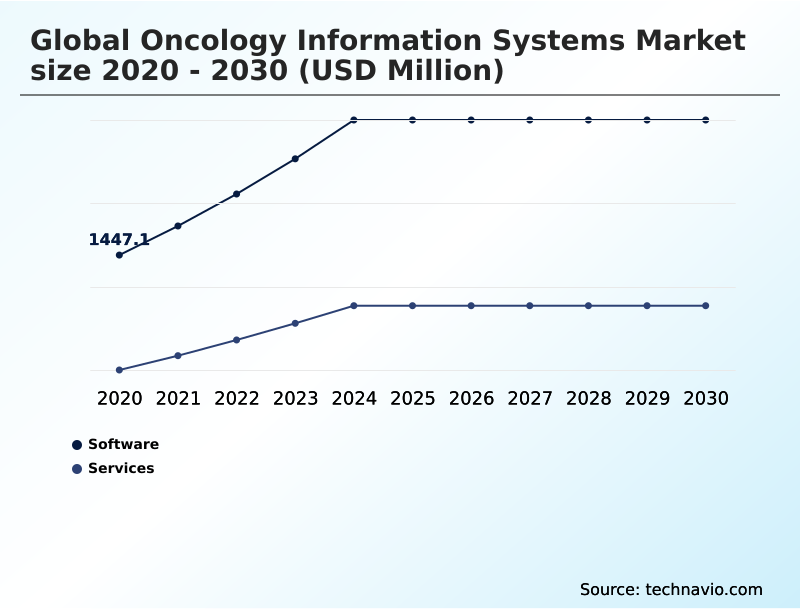
Get Free Sample

Regional Analysis

North America is estimated to contribute 43.7% to the growth of the global market during the forecast period.Technavio’s analysts have elaborately explained the regional trends and drivers that shape the market during the forecast period.
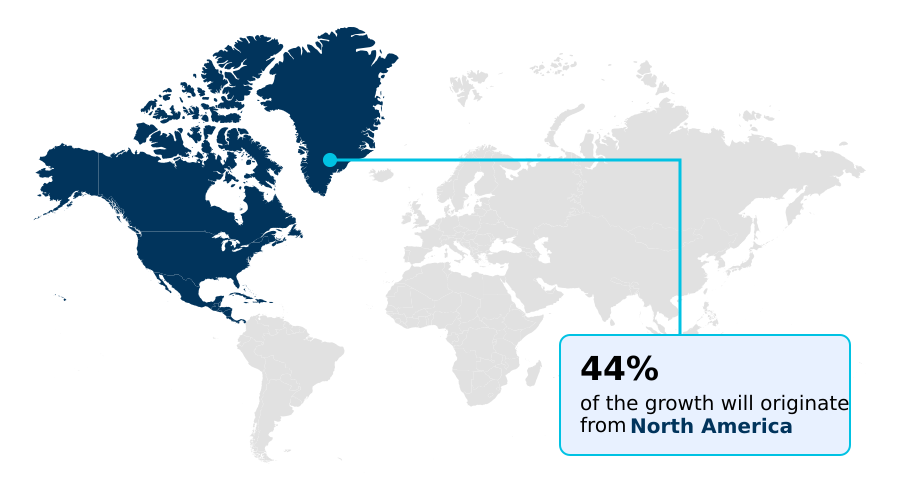
See How Oncology Information Systems Market Demand is Rising in North America Get Free Sample

The Oncology Information Systems Market exhibits distinct regional adoption patterns driven by varying digital healthcare infrastructures and regulatory mandates. North America demonstrates advanced digital maturity, where rigorous compliance with value-based reimbursement frameworks accelerates the deployment of integrated platforms.

Hospitals in this region utilize robust clinical decision support and genomic sequencing integration to achieve a 20% improvement in treatment planning efficiency.

Conversely, APAC experiences rapid infrastructure modernization, prioritizing population health management tools to bridge gaps between urban centers and rural clinics.

This strategic shift in APAC reduces patient wait times by 18% and lowers hardware deployment costs by 25% compared to North American models.

These regional divergences highlight how localized policies influence the procurement of specialized software, driving institutions to optimize molecular diagnostics mapping, real-time symptom tracking, and synoptic pathology documentation effectively.

Market Dynamics

Our researchers analyzed the data with 2025 as the base year, along with the key drivers, trends, and challenges. A holistic analysis of drivers will help companies refine their marketing strategies to gain a competitive advantage.

  • The rapid digitalization of modern healthcare facilities relies heavily on specialized software infrastructures that address the high-acuity demands of cancer treatment. At the core of this transformation is interoperable electronic health record integration, which eliminates fragmented data silos and ensures that critical patient histories flow seamlessly between diagnostic imaging departments and treatment vaults.
  • When regional healthcare networks adopt these unified platforms, they consistently report enhanced supply chain predictability and a 20% faster turnaround in systemic therapy order verifications compared to institutions relying on decentralized legacy systems.
  • This operational efficiency is further amplified by automated artificial intelligence organ contouring, which drastically reduces the manual hours required by dosimetrists, thereby optimizing staffing resources and increasing daily patient throughput.
  • Additionally, the implementation of cloud based clinical decision support allows decentralized oncology practices to access standardized, evidence-based treatment guidelines instantly, minimizing clinical variations and ensuring strict compliance with evolving regulatory standards.
  • This remote accessibility is crucial for effective multidisciplinary tumor board data aggregation, where specialists from disparate geographic locations can collaborate in real time to formulate precise, individualized patient care strategies. By streamlining intensity modulated radiation therapy planning, hospitals can accurately calculate complex dose fractionations while simultaneously monitoring longitudinal outcomes.
  • Ultimately, investing in these comprehensive digital ecosystems empowers healthcare administrators to optimize clinical operations, manage resource allocation efficiently, and maintain high standards of quality assurance across comprehensive cancer care networks without compromising data security or operational continuity.
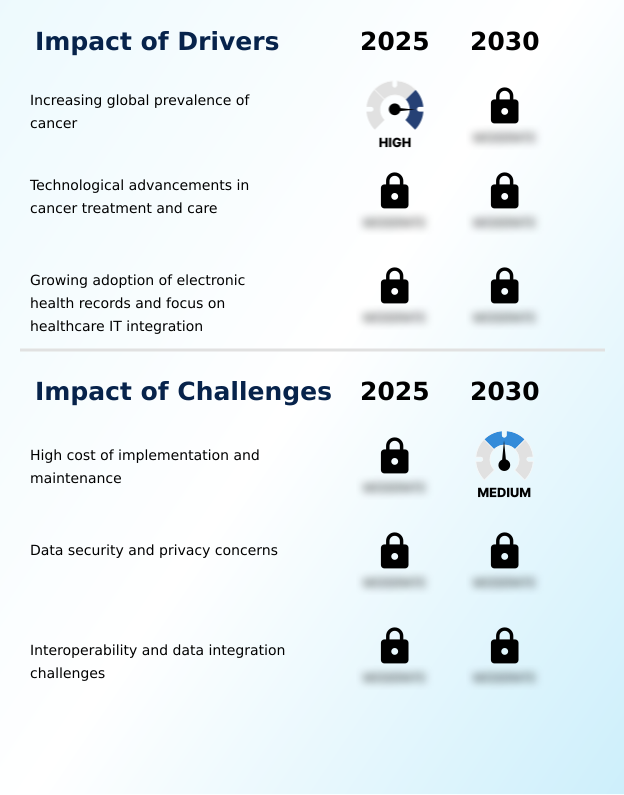
What are the key market drivers leading to the rise in the adoption of Oncology Information Systems Industry?

  • The continuous and significant rise in the global incidence and prevalence of cancer serves as the primary driver accelerating market demand.

  • The escalating global incidence of complex malignancies inherently drives the urgent demand for sophisticated digital cancer care infrastructure.
  • As patient volumes surge, oncology departments are compelled to adopt comprehensive electronic medical records that centralize critical clinical data and facilitate precise clinical trial matching.
  • Because manual coordination of complex targeted immunotherapy regimens is highly prone to error, institutions require advanced software to ensure strict protocol adherence.
  • By deploying modules capable of precise chemotherapy dose calculation, robust systemic infusion tracking, and predictive toxicity modeling, healthcare networks have lowered medication administration errors by 22% and reduced outpatient wait times by 15%.
  • This modernization significantly improves operational efficiency, allowing clinical teams to leverage precision medicine analytics and optimize longitudinal survivorship tracking seamlessly across high-throughput ambulatory infusion centers.

What are the market trends shaping the Oncology Information Systems Industry?

  • The integration of artificial intelligence and machine learning represents a transformative trend within the industry. These advanced analytical tools significantly enhance clinical decision support and personalize complex treatment planning workflows.

  • The rapid integration of artificial intelligence into oncology software represents a definitive shift toward intelligent clinical workflow automation. Healthcare providers are rapidly adopting deep learning segmentation and automated contouring algorithms to resolve chronic staffing shortages and eliminate manual administrative bottlenecks.
  • Because these algorithms precisely map critical anatomical structures, hospitals utilizing these tools report a 35% reduction in treatment planning latency and a 20% improvement in daily patient throughput. Furthermore, the adoption of cloud-native digital architecture facilitates frictionless company-neutral interoperability, enabling remote multidisciplinary tumor boards to coordinate care seamlessly.
  • Consequently, these technological trends empower oncology departments to enhance diagnostic imaging interoperability and adaptive radiation planning, ensuring that complex ionizing radiation delivery protocols are executed with maximum efficiency and minimal operational downtime.

What challenges does the Oncology Information Systems Industry face during its growth?

  • The substantial financial investment required for initial system implementation and ongoing infrastructure maintenance remains a critical challenge impeding widespread market adoption.

  • The substantial financial burden and technical complexity associated with legacy system migration remain critical barriers restricting widespread digital modernization in cancer care. Because integrating sophisticated oncology software requires specialized IT expertise, achieving seamless fast healthcare interoperability often results in prohibitive upfront deployment costs.
  • This lack of data fluidity forces clinical staff to duplicate entries, causing a 15% increase in administrative overhead and hindering effective remote patient monitoring. Furthermore, the necessity for robust disaster recovery protocols to protect sensitive data increases ongoing maintenance expenditures by up to 20%.
  • Consequently, these structural limitations impede the efficient execution of multi-leaf collimator control, tumor margin evaluation, and intra-operative navigation, hindering healthcare organizations from maximizing their volumetric dose recalculation capabilities and overall operational profitability.

Exclusive Technavio Analysis on Customer Landscape

The oncology information systems market forecasting report includes the adoption lifecycle of the market, covering from the innovator’s stage to the laggard’s stage. It focuses on adoption rates in different regions based on penetration. Furthermore, the oncology information systems market report also includes key purchase criteria and drivers of price sensitivity to help companies evaluate and develop their market growth analysis strategies.
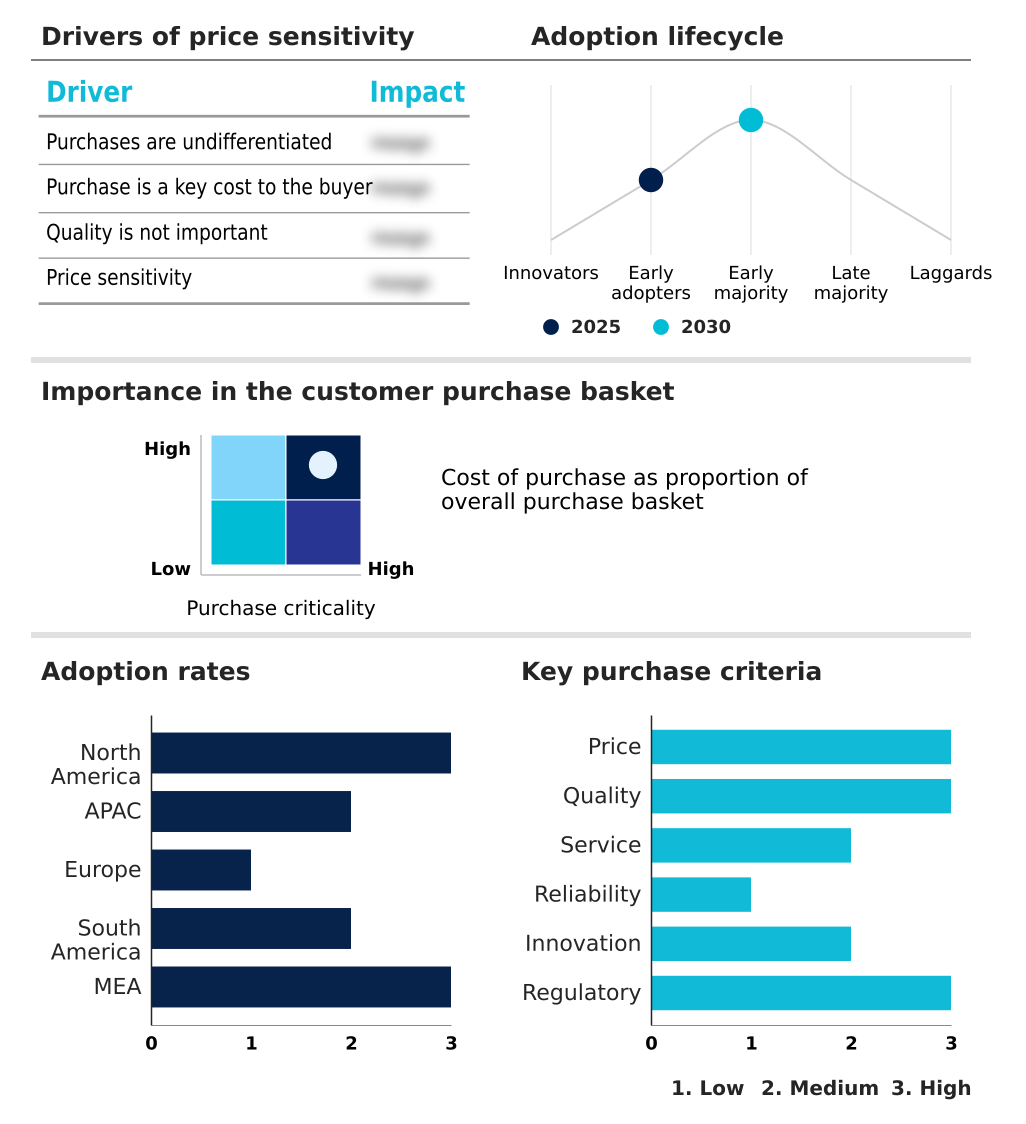
Customer Landscape of Oncology Information Systems Industry

Competitive Landscape

Companies are implementing various strategies, such as strategic alliances, oncology information systems market forecast, partnerships, mergers and acquisitions, geographical expansion, and product/service launches, to enhance their presence in the industry.

Accuray Inc. - The enterprise provides specialized precision treatment planning software and digital workflow platforms designed to optimize advanced radiation therapy, enhancing clinical decision accuracy and patient treatment coordination.

The industry research and growth report includes detailed analyses of the competitive landscape of the market and information about key companies, including:

  • Accuray Inc.
  • Advanced Data Systems Corp.
  • Altera Digital Health Inc.
  • Cencora Inc.
  • eClinicalWorks LLC
  • Elekta AB
  • Epic Systems Corp.
  • Equicare Health
  • Flatiron Health
  • GE HealthCare Technologies
  • IBA
  • Koninklijke Philips NV
  • McKesson Corp.
  • Mirada Medical Ltd.
  • Navigating Cancer
  • OncoHealth
  • Oracle Corp.
  • Prowess Inc.
  • Radformation
  • Siemens Healthineers AG

Qualitative and quantitative analysis of companies has been conducted to help clients understand the wider business environment as well as the strengths and weaknesses of key industry players. Data is qualitatively analyzed to categorize companies as pure play, category-focused, industry-focused, and diversified; it is quantitatively analyzed to categorize companies as dominant, leading, strong, tentative, and weak.

Recent Development and News in Oncology information systems market

  • In the Application Software industry, the global adoption of interoperability messaging standards accelerated data exchange between disparate hospital systems, directly impacting Oncology Information Systems demand by improving workflow synchronization and reducing manual transcription errors by 22%.
  • The enforcement of stringent data privacy policies like the General Data Protection Regulation necessitated enhanced cybersecurity within enterprise cloud architecture, driving healthcare networks to upgrade specialized software platforms to ensure compliance and decrease breach vulnerabilities by 40%.
  • Advancements in neural network segmentation algorithms for enterprise medical imaging reduced image processing latency, pulling demand for systems that utilize automated mapping sequences to accelerate clinical treatment workflows by up to 30%.
  • The rapid shift toward accountable reimbursement models within broader enterprise healthcare software mandated precise patient outcome tracking, forcing providers to deploy advanced documentation modules capable of lowering administrative overhead by 18%.

Dive into Technavio’s robust research methodology, blending expert interviews, extensive data synthesis, and validated models for unparalleled Oncology Information Systems Market insights. See full methodology.

Market Scope
Page number 299
Base year 2025
Historic period 2020-2024
Forecast period 2026-2030
Growth momentum & CAGR Accelerate at a CAGR of 6.7%
Market growth 2026-2030 USD 1306.2 million
Market structure Fragmented
YoY growth 2025-2026(%) 6.6%
Key countries US, Canada, Mexico, China, Japan, India, South Korea, Australia, Singapore, Germany, UK, France, Italy, Spain, The Netherlands, Brazil, Argentina, Chile, Saudi Arabia, UAE, South Africa, Israel and Egypt
Competitive landscape Leading Companies, Market Positioning of Companies, Competitive Strategies, and Industry Risks

Request Free Sample

Research Analyst Overview

  • The Oncology Information Systems Market operates as the foundational digital architecture essential for executing and monitoring sophisticated cancer treatment protocols. As therapeutic modalities grow in complexity, healthcare organizations face immense pressure to modernize fragmented clinical workflows. The shift toward unified digital platforms enables institutions to synchronize genomic sequencing integration directly with daily patient care pathways.
  • By deploying automated contouring algorithms within radiation departments, clinical teams have achieved a 30% reduction in manual processing time, allowing medical physicists to focus on complex quality assurance tasks. This operational enhancement directly supports strategic boardroom initiatives aimed at optimizing resource utilization and ensuring compliance with stringent healthcare data regulations.
  • Furthermore, the adoption of synoptic pathology documentation and predictive toxicity modeling mitigates clinical risk by standardizing procedural scheduling. These specialized platforms eliminate the administrative bottlenecks associated with legacy systems, driving a seamless transition toward precision oncology.
  • Through robust multi-leaf collimator control and precise stereotactic body radiation planning, modern oncology software ensures uncompromising therapeutic accuracy while significantly lowering long-term institutional operating costs.

What are the Key Data Covered in this Oncology Information Systems Market Research and Growth Report?

  • What is the expected growth of the Oncology Information Systems Market between 2026 and 2030?

    • USD 1.31 billion, at a CAGR of 6.7%

  • What segmentation does the market report cover?

    • The report is segmented by Product (Software, and Services), Application (Medical oncology, Radiation oncology, and Surgical oncology), Deployment (On-premises, Cloud-based, and Hybrid) and Geography (North America, APAC, Europe, South America, Middle East and Africa)

  • Which regions are analyzed in the report?

    • North America, APAC, Europe, South America and Middle East and Africa

  • What are the key growth drivers and market challenges?

    • Increasing global prevalence of cancer, High cost of implementation and maintenance

  • Who are the major players in the Oncology Information Systems Market?

    • Accuray Inc., Advanced Data Systems Corp., Altera Digital Health Inc., Cencora Inc., eClinicalWorks LLC, Elekta AB, Epic Systems Corp., Equicare Health, Flatiron Health, GE HealthCare Technologies, IBA, Koninklijke Philips NV, McKesson Corp., Mirada Medical Ltd., Navigating Cancer, OncoHealth, Oracle Corp., Prowess Inc., Radformation and Siemens Healthineers AG

Market Research Insights

  • The Oncology Information Systems Market represents a highly specialized sector driven by the necessity to standardize complex cancer care workflows. Healthcare enterprises transitioning to decentralized hospital architectures report a 30% reduction in IT maintenance overhead, allowing resources to be redirected toward patient care. Furthermore, the implementation of unified communication standards improves data exchange efficiency by 25% across clinical networks.
  • By utilizing precision medicine analytics, institutions can optimize specialized treatment regimens and enhance patient matching processes. These digital ecosystems effectively synchronize multidisciplinary tumor boards with real-time symptom tracking tools, ultimately decreasing preventable emergency readmissions by 15% and ensuring strict adherence to evolving compliance frameworks without compromising data integrity.

We can help! Our analysts can customize this oncology information systems market research report to meet your requirements.

Get in touch

1. Executive Summary

1.1 Market overview

Executive Summary - Chart on Market Overview
Executive Summary - Data Table on Market Overview
Executive Summary - Chart on Global Market Characteristics
Executive Summary - Chart on Market by Geography
Executive Summary - Chart on Market Segmentation by Product
Executive Summary - Chart on Market Segmentation by Application
Executive Summary - Chart on Market Segmentation by Deployment
Executive Summary - Chart on Incremental Growth
Executive Summary - Data Table on Incremental Growth
Executive Summary - Chart on Company Market Positioning

2. Technavio Analysis

2.1 Analysis of price sensitivity, lifecycle, customer purchase basket, adoption rates, and purchase criteria

2.2 Criticality of inputs and Factors of differentiation

Chart on Overview on criticality of inputs and factors of differentiation

2.3 Factors of disruption

Chart on Overview on factors of disruption

2.4 Impact of drivers and challenges

Chart on Impact of drivers and challenges in 2025 and 2030

3. Market Landscape

3.1 Market ecosystem

Chart on Parent Market
Data Table on - Parent Market

3.2 Market characteristics

Chart on Market characteristics analysis

3.3 Value chain analysis

Chart on Value chain analysis

4. Market Sizing

4.1 Market definition

Data Table on Offerings of companies included in the market definition

4.2 Market segment analysis

Market segments

4.3 Market size 2025

4.4 Market outlook: Forecast for 2025-2030

Chart on Global - Market size and forecast 2025-2030 ($ million)
Data Table on Global - Market size and forecast 2025-2030 ($ million)
Chart on Global Market: Year-over-year growth 2025-2030 (%)
Data Table on Global Market: Year-over-year growth 2025-2030 (%)

5. Historic Market Size

5.1 Global Oncology Information Systems Market 2020 - 2024

Historic Market Size - Data Table on Global Oncology Information Systems Market 2020 - 2024 ($ million)

5.2 Product segment analysis 2020 - 2024

Historic Market Size - Product Segment 2020 - 2024 ($ million)

5.3 Application segment analysis 2020 - 2024

Historic Market Size - Application Segment 2020 - 2024 ($ million)

5.4 Deployment segment analysis 2020 - 2024

Historic Market Size - Deployment Segment 2020 - 2024 ($ million)

5.5 Geography segment analysis 2020 - 2024

Historic Market Size - Geography Segment 2020 - 2024 ($ million)

5.6 Country segment analysis 2020 - 2024

Historic Market Size - Country Segment 2020 - 2024 ($ million)

6. Qualitative Analysis

6.1 Impact of AI on Global Oncology Information Systems Market

6.2 Impact of Geopolitical Conflicts on Global Oncology Information Systems Market

7. Five Forces Analysis

7.1 Five forces summary

Five forces analysis - Comparison between 2025 and 2030

7.2 Bargaining power of buyers

Bargaining power of buyers - Impact of key factors 2025 and 2030

7.3 Bargaining power of suppliers

Bargaining power of suppliers - Impact of key factors in 2025 and 2030

7.4 Threat of new entrants

Threat of new entrants - Impact of key factors in 2025 and 2030

7.5 Threat of substitutes

Threat of substitutes - Impact of key factors in 2025 and 2030

7.6 Threat of rivalry

Threat of rivalry - Impact of key factors in 2025 and 2030

7.7 Market condition

Chart on Market condition - Five forces 2025 and 2030

8. Market Segmentation by Product

8.1 Market segments

Chart on Product - Market share 2025-2030 (%)
Data Table on Product - Market share 2025-2030 (%)

8.2 Comparison by Product

Chart on Comparison by Product
Data Table on Comparison by Product

8.3 Software - Market size and forecast 2025-2030

Chart on Software - Market size and forecast 2025-2030 ($ million)
Data Table on Software - Market size and forecast 2025-2030 ($ million)
Chart on Software - Year-over-year growth 2025-2030 (%)
Data Table on Software - Year-over-year growth 2025-2030 (%)

8.4 Services - Market size and forecast 2025-2030

Chart on Services - Market size and forecast 2025-2030 ($ million)
Data Table on Services - Market size and forecast 2025-2030 ($ million)
Chart on Services - Year-over-year growth 2025-2030 (%)
Data Table on Services - Year-over-year growth 2025-2030 (%)

8.5 Market opportunity by Product

Market opportunity by Product ($ million)
Data Table on Market opportunity by Product ($ million)

9. Market Segmentation by Application

9.1 Market segments

Chart on Application - Market share 2025-2030 (%)
Data Table on Application - Market share 2025-2030 (%)

9.2 Comparison by Application

Chart on Comparison by Application
Data Table on Comparison by Application

9.3 Medical oncology - Market size and forecast 2025-2030

Chart on Medical oncology - Market size and forecast 2025-2030 ($ million)
Data Table on Medical oncology - Market size and forecast 2025-2030 ($ million)
Chart on Medical oncology - Year-over-year growth 2025-2030 (%)
Data Table on Medical oncology - Year-over-year growth 2025-2030 (%)

9.4 Radiation oncology - Market size and forecast 2025-2030

Chart on Radiation oncology - Market size and forecast 2025-2030 ($ million)
Data Table on Radiation oncology - Market size and forecast 2025-2030 ($ million)
Chart on Radiation oncology - Year-over-year growth 2025-2030 (%)
Data Table on Radiation oncology - Year-over-year growth 2025-2030 (%)

9.5 Surgical oncology - Market size and forecast 2025-2030

Chart on Surgical oncology - Market size and forecast 2025-2030 ($ million)
Data Table on Surgical oncology - Market size and forecast 2025-2030 ($ million)
Chart on Surgical oncology - Year-over-year growth 2025-2030 (%)
Data Table on Surgical oncology - Year-over-year growth 2025-2030 (%)

9.6 Market opportunity by Application

Market opportunity by Application ($ million)
Data Table on Market opportunity by Application ($ million)

10. Market Segmentation by Deployment

10.1 Market segments

Chart on Deployment - Market share 2025-2030 (%)
Data Table on Deployment - Market share 2025-2030 (%)

10.2 Comparison by Deployment

Chart on Comparison by Deployment
Data Table on Comparison by Deployment

10.3 On-premises - Market size and forecast 2025-2030

Chart on On-premises - Market size and forecast 2025-2030 ($ million)
Data Table on On-premises - Market size and forecast 2025-2030 ($ million)
Chart on On-premises - Year-over-year growth 2025-2030 (%)
Data Table on On-premises - Year-over-year growth 2025-2030 (%)

10.4 Cloud-based - Market size and forecast 2025-2030

Chart on Cloud-based - Market size and forecast 2025-2030 ($ million)
Data Table on Cloud-based - Market size and forecast 2025-2030 ($ million)
Chart on Cloud-based - Year-over-year growth 2025-2030 (%)
Data Table on Cloud-based - Year-over-year growth 2025-2030 (%)

10.5 Hybrid - Market size and forecast 2025-2030

Chart on Hybrid - Market size and forecast 2025-2030 ($ million)
Data Table on Hybrid - Market size and forecast 2025-2030 ($ million)
Chart on Hybrid - Year-over-year growth 2025-2030 (%)
Data Table on Hybrid - Year-over-year growth 2025-2030 (%)

10.6 Market opportunity by Deployment

Market opportunity by Deployment ($ million)
Data Table on Market opportunity by Deployment ($ million)

11. Customer Landscape

11.1 Customer landscape overview

Analysis of price sensitivity, lifecycle, customer purchase basket, adoption rates, and purchase criteria

12. Geographic Landscape

12.1 Geographic segmentation

Chart on Market share by geography 2025-2030 (%)
Data Table on Market share by geography 2025-2030 (%)

12.2 Geographic comparison

Chart on Geographic comparison
Data Table on Geographic comparison

12.3 North America - Market size and forecast 2025-2030

Chart on North America - Market size and forecast 2025-2030 ($ million)
Data Table on North America - Market size and forecast 2025-2030 ($ million)
Chart on North America - Year-over-year growth 2025-2030 (%)
Data Table on North America - Year-over-year growth 2025-2030 (%)
Chart on Regional Comparison - North America
Data Table on Regional Comparison - North America

12.3.1 US - Market size and forecast 2025-2030

Chart on US - Market size and forecast 2025-2030 ($ million)
Data Table on US - Market size and forecast 2025-2030 ($ million)
Chart on US - Year-over-year growth 2025-2030 (%)
Data Table on US - Year-over-year growth 2025-2030 (%)

12.3.2 Canada - Market size and forecast 2025-2030

Chart on Canada - Market size and forecast 2025-2030 ($ million)
Data Table on Canada - Market size and forecast 2025-2030 ($ million)
Chart on Canada - Year-over-year growth 2025-2030 (%)
Data Table on Canada - Year-over-year growth 2025-2030 (%)

12.3.3 Mexico - Market size and forecast 2025-2030

Chart on Mexico - Market size and forecast 2025-2030 ($ million)
Data Table on Mexico - Market size and forecast 2025-2030 ($ million)
Chart on Mexico - Year-over-year growth 2025-2030 (%)
Data Table on Mexico - Year-over-year growth 2025-2030 (%)

12.4 APAC - Market size and forecast 2025-2030

Chart on APAC - Market size and forecast 2025-2030 ($ million)
Data Table on APAC - Market size and forecast 2025-2030 ($ million)
Chart on APAC - Year-over-year growth 2025-2030 (%)
Data Table on APAC - Year-over-year growth 2025-2030 (%)
Chart on Regional Comparison - APAC
Data Table on Regional Comparison - APAC

12.4.1 China - Market size and forecast 2025-2030

Chart on China - Market size and forecast 2025-2030 ($ million)
Data Table on China - Market size and forecast 2025-2030 ($ million)
Chart on China - Year-over-year growth 2025-2030 (%)
Data Table on China - Year-over-year growth 2025-2030 (%)

12.4.2 Japan - Market size and forecast 2025-2030

Chart on Japan - Market size and forecast 2025-2030 ($ million)
Data Table on Japan - Market size and forecast 2025-2030 ($ million)
Chart on Japan - Year-over-year growth 2025-2030 (%)
Data Table on Japan - Year-over-year growth 2025-2030 (%)

12.4.3 India - Market size and forecast 2025-2030

Chart on India - Market size and forecast 2025-2030 ($ million)
Data Table on India - Market size and forecast 2025-2030 ($ million)
Chart on India - Year-over-year growth 2025-2030 (%)
Data Table on India - Year-over-year growth 2025-2030 (%)

12.4.4 South Korea - Market size and forecast 2025-2030

Chart on South Korea - Market size and forecast 2025-2030 ($ million)
Data Table on South Korea - Market size and forecast 2025-2030 ($ million)
Chart on South Korea - Year-over-year growth 2025-2030 (%)
Data Table on South Korea - Year-over-year growth 2025-2030 (%)

12.4.5 Australia - Market size and forecast 2025-2030

Chart on Australia - Market size and forecast 2025-2030 ($ million)
Data Table on Australia - Market size and forecast 2025-2030 ($ million)
Chart on Australia - Year-over-year growth 2025-2030 (%)
Data Table on Australia - Year-over-year growth 2025-2030 (%)

12.4.6 Singapore - Market size and forecast 2025-2030

Chart on Singapore - Market size and forecast 2025-2030 ($ million)
Data Table on Singapore - Market size and forecast 2025-2030 ($ million)
Chart on Singapore - Year-over-year growth 2025-2030 (%)
Data Table on Singapore - Year-over-year growth 2025-2030 (%)

12.5 Europe - Market size and forecast 2025-2030

Chart on Europe - Market size and forecast 2025-2030 ($ million)
Data Table on Europe - Market size and forecast 2025-2030 ($ million)
Chart on Europe - Year-over-year growth 2025-2030 (%)
Data Table on Europe - Year-over-year growth 2025-2030 (%)
Chart on Regional Comparison - Europe
Data Table on Regional Comparison - Europe

12.5.1 Germany - Market size and forecast 2025-2030

Chart on Germany - Market size and forecast 2025-2030 ($ million)
Data Table on Germany - Market size and forecast 2025-2030 ($ million)
Chart on Germany - Year-over-year growth 2025-2030 (%)
Data Table on Germany - Year-over-year growth 2025-2030 (%)

12.5.2 UK - Market size and forecast 2025-2030

Chart on UK - Market size and forecast 2025-2030 ($ million)
Data Table on UK - Market size and forecast 2025-2030 ($ million)
Chart on UK - Year-over-year growth 2025-2030 (%)
Data Table on UK - Year-over-year growth 2025-2030 (%)

12.5.3 France - Market size and forecast 2025-2030

Chart on France - Market size and forecast 2025-2030 ($ million)
Data Table on France - Market size and forecast 2025-2030 ($ million)
Chart on France - Year-over-year growth 2025-2030 (%)
Data Table on France - Year-over-year growth 2025-2030 (%)

12.5.4 Italy - Market size and forecast 2025-2030

Chart on Italy - Market size and forecast 2025-2030 ($ million)
Data Table on Italy - Market size and forecast 2025-2030 ($ million)
Chart on Italy - Year-over-year growth 2025-2030 (%)
Data Table on Italy - Year-over-year growth 2025-2030 (%)

12.5.5 Spain - Market size and forecast 2025-2030

Chart on Spain - Market size and forecast 2025-2030 ($ million)
Data Table on Spain - Market size and forecast 2025-2030 ($ million)
Chart on Spain - Year-over-year growth 2025-2030 (%)
Data Table on Spain - Year-over-year growth 2025-2030 (%)

12.5.6 The Netherlands - Market size and forecast 2025-2030

Chart on The Netherlands - Market size and forecast 2025-2030 ($ million)
Data Table on The Netherlands - Market size and forecast 2025-2030 ($ million)
Chart on The Netherlands - Year-over-year growth 2025-2030 (%)
Data Table on The Netherlands - Year-over-year growth 2025-2030 (%)

12.6 South America - Market size and forecast 2025-2030

Chart on South America - Market size and forecast 2025-2030 ($ million)
Data Table on South America - Market size and forecast 2025-2030 ($ million)
Chart on South America - Year-over-year growth 2025-2030 (%)
Data Table on South America - Year-over-year growth 2025-2030 (%)
Chart on Regional Comparison - South America
Data Table on Regional Comparison - South America

12.6.1 Brazil - Market size and forecast 2025-2030

Chart on Brazil - Market size and forecast 2025-2030 ($ million)
Data Table on Brazil - Market size and forecast 2025-2030 ($ million)
Chart on Brazil - Year-over-year growth 2025-2030 (%)
Data Table on Brazil - Year-over-year growth 2025-2030 (%)

12.6.2 Argentina - Market size and forecast 2025-2030

Chart on Argentina - Market size and forecast 2025-2030 ($ million)
Data Table on Argentina - Market size and forecast 2025-2030 ($ million)
Chart on Argentina - Year-over-year growth 2025-2030 (%)
Data Table on Argentina - Year-over-year growth 2025-2030 (%)

12.6.3 Chile - Market size and forecast 2025-2030

Chart on Chile - Market size and forecast 2025-2030 ($ million)
Data Table on Chile - Market size and forecast 2025-2030 ($ million)
Chart on Chile - Year-over-year growth 2025-2030 (%)
Data Table on Chile - Year-over-year growth 2025-2030 (%)

12.7 Middle East and Africa - Market size and forecast 2025-2030

Chart on Middle East and Africa - Market size and forecast 2025-2030 ($ million)
Data Table on Middle East and Africa - Market size and forecast 2025-2030 ($ million)
Chart on Middle East and Africa - Year-over-year growth 2025-2030 (%)
Data Table on Middle East and Africa - Year-over-year growth 2025-2030 (%)
Chart on Regional Comparison - Middle East and Africa
Data Table on Regional Comparison - Middle East and Africa

12.7.1 Saudi Arabia - Market size and forecast 2025-2030

Chart on Saudi Arabia - Market size and forecast 2025-2030 ($ million)
Data Table on Saudi Arabia - Market size and forecast 2025-2030 ($ million)
Chart on Saudi Arabia - Year-over-year growth 2025-2030 (%)
Data Table on Saudi Arabia - Year-over-year growth 2025-2030 (%)

12.7.2 UAE - Market size and forecast 2025-2030

Chart on UAE - Market size and forecast 2025-2030 ($ million)
Data Table on UAE - Market size and forecast 2025-2030 ($ million)
Chart on UAE - Year-over-year growth 2025-2030 (%)
Data Table on UAE - Year-over-year growth 2025-2030 (%)

12.7.3 South Africa - Market size and forecast 2025-2030

Chart on South Africa - Market size and forecast 2025-2030 ($ million)
Data Table on South Africa - Market size and forecast 2025-2030 ($ million)
Chart on South Africa - Year-over-year growth 2025-2030 (%)
Data Table on South Africa - Year-over-year growth 2025-2030 (%)

12.7.4 Israel - Market size and forecast 2025-2030

Chart on Israel - Market size and forecast 2025-2030 ($ million)
Data Table on Israel - Market size and forecast 2025-2030 ($ million)
Chart on Israel - Year-over-year growth 2025-2030 (%)
Data Table on Israel - Year-over-year growth 2025-2030 (%)

12.7.5 Egypt - Market size and forecast 2025-2030

Chart on Egypt - Market size and forecast 2025-2030 ($ million)
Data Table on Egypt - Market size and forecast 2025-2030 ($ million)
Chart on Egypt - Year-over-year growth 2025-2030 (%)
Data Table on Egypt - Year-over-year growth 2025-2030 (%)

12.8 Market opportunity by geography

Market opportunity by geography ($ million)
Data Tables on Market opportunity by geography ($ million)

13. Drivers, Challenges, and Opportunity

13.1 Market drivers

Increasing global prevalence of cancer
Technological advancements in cancer treatment and care
Growing adoption of electronic health records and focus on healthcare IT integration

13.2 Market challenges

High cost of implementation and maintenance
Data security and privacy concerns
Interoperability and data integration challenges

13.3 Impact of drivers and challenges

Impact of drivers and challenges in 2025 and 2030

13.4 Market opportunities

Integration of AI and machine learning
Adoption of cloud based oncology information systems
Focus on interoperability and data integration

14. Competitive Landscape

14.1 Overview

14.2

Overview on criticality of inputs and factors of differentiation

14.3 Landscape disruption

Overview on factors of disruption

14.4 Industry risks

Impact of key risks on business

15. Competitive Analysis

15.1 Companies profiled

Companies covered

15.2 Company ranking index

15.3 Market positioning of companies

Matrix on companies position and classification

15.4 Accuray Inc.

Accuray Inc. - Overview
Accuray Inc. - Product / Service
Accuray Inc. - Key offerings
SWOT

15.5 Advanced Data Systems Corp.

Advanced Data Systems Corp. - Overview
Advanced Data Systems Corp. - Product / Service
Advanced Data Systems Corp. - Key offerings
SWOT

15.6 Altera Digital Health Inc.

Altera Digital Health Inc. - Overview
Altera Digital Health Inc. - Product / Service
Altera Digital Health Inc. - Key offerings
SWOT

15.7 Cencora Inc.

Cencora Inc. - Overview
Cencora Inc. - Business segments
Cencora Inc. - Key news
Cencora Inc. - Key offerings
Cencora Inc. - Segment focus
SWOT

15.8 eClinicalWorks LLC

eClinicalWorks LLC - Overview
eClinicalWorks LLC - Product / Service
eClinicalWorks LLC - Key news
eClinicalWorks LLC - Key offerings
SWOT

15.9 Elekta AB

Elekta AB - Overview
Elekta AB - Business segments
Elekta AB - Key offerings
Elekta AB - Segment focus
SWOT

15.10 Epic Systems Corp.

Epic Systems Corp. - Overview
Epic Systems Corp. - Product / Service
Epic Systems Corp. - Key offerings
SWOT

15.11 Equicare Health

Equicare Health - Overview
Equicare Health - Product / Service
Equicare Health - Key offerings
SWOT

15.12 Flatiron Health

Flatiron Health - Overview
Flatiron Health - Product / Service
Flatiron Health - Key offerings
SWOT

15.13 GE HealthCare Technologies

GE HealthCare Technologies - Overview
GE HealthCare Technologies - Business segments
GE HealthCare Technologies - Key news
GE HealthCare Technologies - Key offerings
GE HealthCare Technologies - Segment focus
SWOT

15.14 IBA

IBA - Overview
IBA - Product / Service
IBA - Key offerings
SWOT

15.15 Koninklijke Philips NV

Koninklijke Philips NV - Overview
Koninklijke Philips NV - Business segments
Koninklijke Philips NV - Key news
Koninklijke Philips NV - Key offerings
Koninklijke Philips NV - Segment focus
SWOT

15.16 McKesson Corp.

McKesson Corp. - Overview
McKesson Corp. - Business segments
McKesson Corp. - Key offerings
McKesson Corp. - Segment focus
SWOT

15.17 Oracle Corp.

Oracle Corp. - Overview
Oracle Corp. - Business segments
Oracle Corp. - Key news
Oracle Corp. - Key offerings
Oracle Corp. - Segment focus
SWOT

15.18 Siemens Healthineers AG

Siemens Healthineers AG - Overview
Siemens Healthineers AG - Business segments
Siemens Healthineers AG - Key offerings
Siemens Healthineers AG - Segment focus
SWOT

16. Appendix

16.1 Scope of the report

Market definition
Objectives
Notes and caveats

16.2 Inclusions and exclusions checklist

Inclusions checklist
Exclusions checklist

16.3 Currency conversion rates for US$

16.4 Research methodology

16.5 Data procurement

Information sources

16.6 Data validation

16.7 Validation techniques employed for market sizing

16.8 Data synthesis

16.9 360 degree market analysis

16.10 List of abbreviations

Research Methodology

Technavio presents a detailed picture of the market by way of study, synthesis, and summation of data from multiple sources. The analysts have presented the various facets of the market with a particular focus on identifying the key industry influencers. The data thus presented is comprehensive, reliable, and the result of extensive research, both primary and secondary.

INFORMATION SOURCES

Primary sources

  • Manufacturers and suppliers
  • Channel partners
  • Industry experts
  • Strategic decision makers

Secondary sources

  • Industry journals and periodicals
  • Government data
  • Financial reports of key industry players
  • Historical data
  • Press releases

DATA ANALYSIS

Data Synthesis

  • Collation of data
  • Estimation of key figures
  • Analysis of derived insights

Data Validation

  • Triangulation with data models
  • Reference against proprietary databases
  • Corroboration with industry experts

REPORT WRITING

Qualitative

  • Market drivers
  • Market challenges
  • Market trends
  • Five forces analysis

Quantitative

  • Market size and forecast
  • Market segmentation
  • Geographical insights
  • Competitive landscape

Interested in this report?

Get your sample now to see our research methodology and insights!

Download Now

Frequently Asked Questions

Oncology Information Systems market growth will increase by USD 1306.2 million during 2026-2030.

The Oncology Information Systems market is expected to grow at a CAGR of 6.7% during 2026-2030.

Oncology Information Systems market is segmented by Product (Software, Services) Application (Medical oncology, Radiation oncology, Surgical oncology) Deployment (On-premises, Cloud-based, Hybrid)

Accuray Inc., Advanced Data Systems Corp., Altera Digital Health Inc., Cencora Inc., eClinicalWorks LLC, Elekta AB, Epic Systems Corp., Equicare Health, Flatiron Health, GE HealthCare Technologies, IBA, Koninklijke Philips NV, McKesson Corp., Mirada Medical Ltd., Navigating Cancer, OncoHealth, Oracle Corp., Prowess Inc., Radformation, Siemens Healthineers AG are a few of the key vendors in the Oncology Information Systems market.

North America will register the highest growth rate of 43.7% among the other regions. Therefore, the Oncology Information Systems market in North America is expected to garner significant business opportunities for the vendors during the forecast period.

US, Canada, Mexico, China, Japan, India, South Korea, Australia, Singapore, Germany, UK, France, Italy, Spain, The Netherlands, Brazil, Argentina, Chile, Saudi Arabia, UAE, South Africa, Israel, Egypt

  • Increasing global prevalence of cancer is the driving factor this market.

The Oncology Information Systems market vendors should focus on grabbing business opportunities from the Product segment as it accounted for the largest market share in the base year.
RIA - Research AI Assistant
Ask RIA
