
Online Clothing Rental Market Size 2025-2029
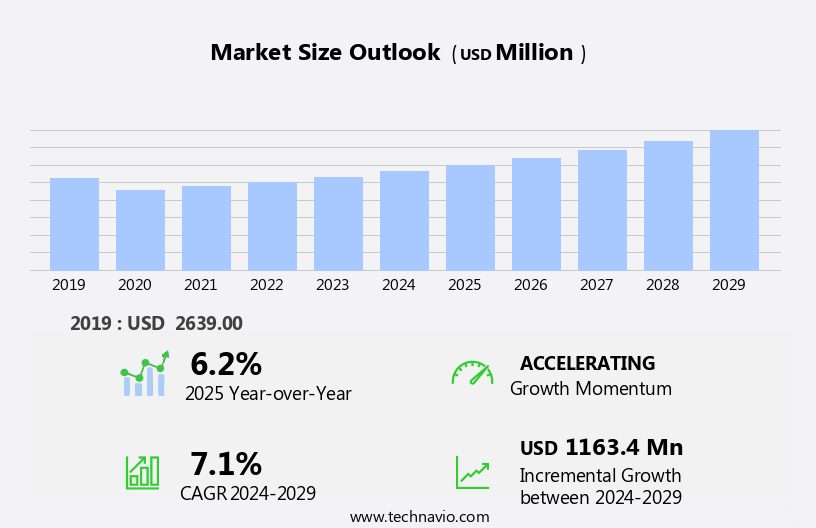
The online clothing rental market size is forecast to increase by USD 1.16 billion, at a CAGR of 7.1% between 2024 and 2029.
- The market is experiencing significant growth, driven by the expanding e-commerce in retails and fashion industry and the increasing trend towards experiential marketing. Consumers are increasingly turning to rental services for access to a wider variety of clothing options, reducing the need for excessive wardrobe investments. However, the market faces challenges in implementing effective inventory management systems to meet the demands of a growing customer base. Regulatory hurdles, such as licensing and taxation, also impact adoption in certain regions. Supply chain inconsistencies, including issues with product quality and delivery times, can temper growth potential.
- To capitalize on market opportunities and navigate these challenges, companies must invest in advanced technology solutions for inventory management and logistics, as well as establish strategic partnerships to overcome regulatory obstacles. By addressing these challenges and leveraging the growing demand for flexible and sustainable fashion solutions, players in the market can position themselves for long-term success.
What will be the Size of the Online Clothing Rental Market during the forecast period?
The market continues to evolve, with subscription services emerging as a popular trend. This business model allows consumers to rent occasion wear and apparel for various events and everyday use, offering flexibility and affordability. Sustainable fabric fashion is another key driver in the market, as consumers seek out rental platforms that prioritize ethical sourcing and the use of recycled materials. Styling services have also gained traction in the market, providing customers with personalized recommendations based on their preferences and body type. Customer support and inventory management are essential components of a successful rental experience, ensuring a seamless and enjoyable process for renters.
Fashion inspiration and virtual try-on features are becoming increasingly important in the market, as consumers seek out platforms that offer a more interactive and engaging rental experience. Event wear and formal wear are popular categories, with many platforms partnering with fast fashion influencers and bloggers to showcase their offerings. Customer loyalty programs and flexible rental periods are also key differentiators in the market, as fashion-conscious consumers look for value and convenience. Rental plans cater to various budgets and preferences, with options for seasonal collections, designer clothing, and eco-friendly fabrics. Security measures and cleanliness and hygiene are critical considerations for consumers, with many platforms implementing rigorous processes to ensure the quality and safety of their inventory.
Data analytics and social media marketing are essential tools for fashion rental platforms, allowing them to target specific customer segments and stay informed about fashion trends. Logistics and delivery, as well as returns policies and free shipping, are also important factors in the rental experience. Quality control and size inclusivity are essential for maintaining customer satisfaction and loyalty. The market for fashion rental services is diverse, with offerings ranging from casual wear to luxury fashion. AI-powered recommendations and style guides help customers navigate the vast selection of clothing and make informed choices. The circular economy is a growing trend in the industry, with many platforms prioritizing sustainability and reducing waste.
Data privacy and personal style are also important considerations for consumers, with many platforms offering customized recommendations and allowing users to curate their own wardrobes. Fashion trends and brand partnerships are key drivers in the market, with many platforms collaborating with designers and influencers to offer exclusive collections and experiences. In conclusion, the market is a dynamic and evolving industry, with a focus on sustainability, convenience, and personalization. From occasion wear to casual clothing, rental platforms are providing consumers with a wide range of options and features to meet their fashion needs. With a commitment to ethical sourcing, customer support, and data analytics, these platforms are poised to continue disrupting the traditional retail industry and shaping the future of fashion.
How is this Online Clothing Rental Industry segmented?
The online clothing rental industry research report provides comprehensive data (region-wise segment analysis), with forecasts and estimates in "USD million" for the period 2025-2029, as well as historical data from 2019-2023 for the following segments.
- End-user
- Women
- Men
- Children
- Type
- Formal
- Casual
- Traditional
- Business Model
- Subscription based
- Standalone
- Peer to Peer
- Subscription based
- Standalone
- Peer to Peer
- Target Audience
- Millennials
- Professionals
- Event Attendees
- Geography
- North America
- US
- Canada
- Europe
- France
- Germany
- Italy
- UK
- Middle East and Africa
- UAE
- APAC
- China
- India
- Japan
- South Korea
- South America
- Brazil
- Rest of World (ROW)
- North America
By End-user Insights
The women segment is estimated to witness significant growth during the forecast period.
The market is witnessing significant growth due to the increasing preference for sustainable fashion and the rising demand for occasion wear among women. This trend is driven by the growing consciousness among consumers about reducing clothing waste and the high cost of purchasing occasion-specific attire. Women's segment is expected to dominate the market during the forecast period, as they prioritize renting clothing for various occasions, including dates, formal meetings, parties, vacations, weddings, outdoor activities, and daily work. Online clothing rental platforms offer a wide range of services, including styling, customer support, inventory management, ethical sourcing, and flexible rental periods.
These platforms provide fashion inspiration, event wear, and wardrobe curation, making it easier for women to stay on-trend without the commitment of purchasing. The use of recycled materials, security measures, and cleanliness and hygiene standards ensure a positive rental experience. Moreover, fashion rental platforms offer customer loyalty programs, virtual try-on, size inclusivity, and data analytics to cater to the diverse needs of fashion-conscious consumers. Social media marketing and brand partnerships are also crucial elements of these platforms, allowing fashion influencers and bloggers to promote their offerings to a wider audience. The ecommerce platform's ease of use, fast fashion sharing, and eco-friendly fabrics further contribute to the market's growth.
Luxury fashion and designer clothing are also available for rent, making these platforms an attractive option for those seeking high-end attire without the high price tag. The use of AI-powered recommendations and style trends ensures a personalized shopping experience, while data privacy and seasonal collections cater to individual preferences. Logistics and delivery, returns policy, and quality control are essential aspects of the rental process, ensuring a seamless experience for customers. The market's evolution reflects the growing importance of the circular economy and the shift towards more sustainable and responsible fashion choices.
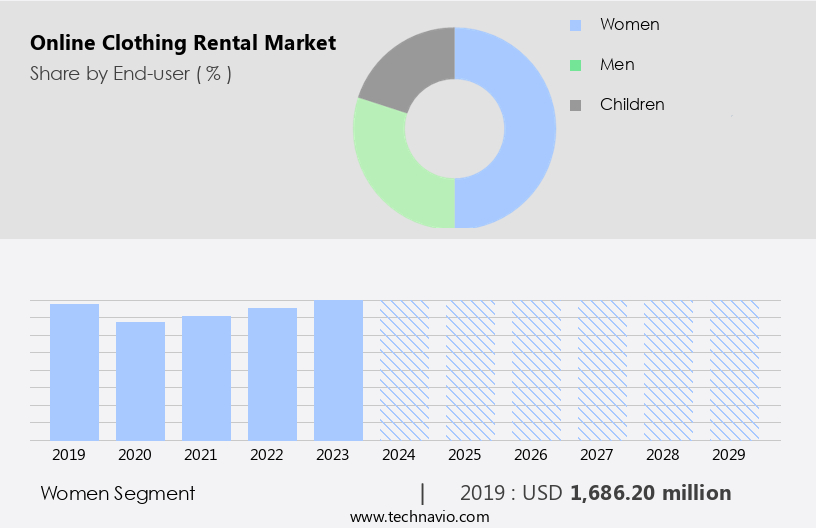
The Women segment was valued at USD 1.69 billion in 2019 and showed a gradual increase during the forecast period.
Regional Analysis
North America is estimated to contribute 51% to the growth of the global market during the forecast period.Technavio's analysts have elaborately explained the regional trends and drivers that shape the market during the forecast period.
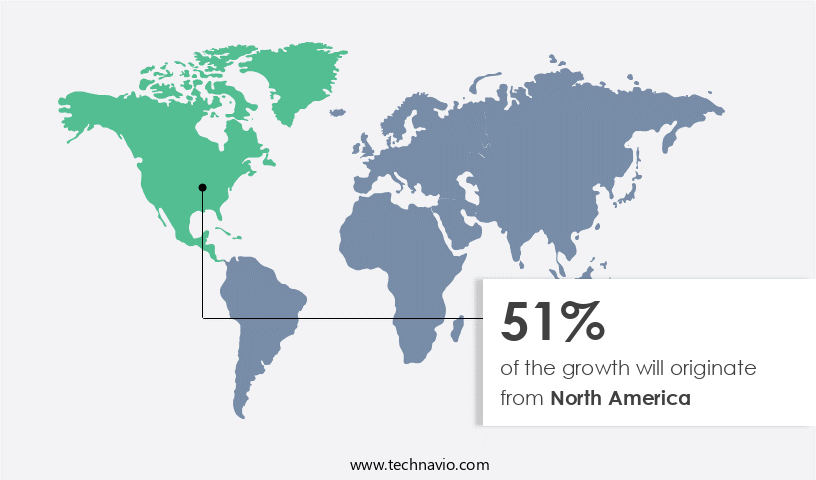
In the North American market, online clothing rental services have gained traction due to the region's well-established e-commerce industry and high Internet penetration, with approximately 92% of the US population online in 2023. The market is competitive, and companies employ various strategies to differentiate themselves. Key growth drivers include the demand for premium and luxury clothing, the concentration of fashion clusters, the shift toward sustainable fashion, and the increasing popularity of subscription services, styling services, and mobile apps. These platforms offer flexible rental periods, customer loyalty programs, and virtual try-on technology, catering to Gen Z's fashion-conscious consumers and their preference for seasonal collections, event wear, and casual wear.
Additionally, brands are partnering with fashion influencers, bloggers, and the fashion community to expand their reach and offer personalized style guides. The market also emphasizes ethical sourcing, inventory management, data analytics, and data privacy. companies prioritize cleanliness and hygiene, quality control, and logistics and delivery. Furthermore, the market is embracing circular economy principles, using recycled materials and eco-friendly fabrics, and implementing AI-powered recommendations to cater to diverse customer segments and fashion trends.
Market Dynamics
Our researchers analyzed the data with 2024 as the base year, along with the key drivers, trends, and challenges. A holistic analysis of drivers will help companies refine their marketing strategies to gain a competitive advantage.The online clothing rental market is rapidly evolving with innovations like an AI driven clothing recommendation system and seamless online rental platform integration enhancing customer convenience. Real-time operations are strengthened through real time inventory management for clothing rental and automated apparel condition assessment process. Businesses utilize customer lifecycle management in online clothing rental and implement dynamic pricing strategies for clothing rentals for revenue optimization. Operational efficiency is driven by effective logistics optimization for apparel rental, efficient returns processing automation system, and predictive maintenance model for rental clothing. Sustainability is addressed via sustainable textile sourcing for clothing rental business and garment lifecycle tracking in online rental business. Security and trust are ensured through advanced fraud detection in online clothing rental, a secure payment gateway for online clothing rental, and customer feedback mechanism for online clothing rental. Enhanced experiences are powered by personalized styling service via mobile app, AI powered size and fit algorithm for clothing rental, smart wardrobe technology for apparel management, and wearable sensor integration for clothing rental, supported by a scalable cloud infrastructure for clothing rental platform and an advanced data analytics dashboard for clothing rental business.
What are the key market drivers leading to the rise in the adoption of Online Clothing Rental Industry?
- The e-commerce fashion industry's robust growth serves as the primary catalyst for market expansion. Online clothing rental services have gained popularity among consumers due to the convenience and extensive product offerings they provide. Subscription-based apparel rental platforms, such as Nuuly, kangol, flyrobe, and Rent the Runway, cater to various fashion needs, including occasion wear. The growth of the online rental market is driven by expanding e-commerce in the fashion industry, increasing online access and smartphone penetration, and a rising trend of sustainable fashion. These services offer customers styling services, ethical sourcing, and inventory management, aligning with the demand for a more sustainable and convenient fashion experience.
- Customer support and flexible rental periods further enhance the appeal of these services. Cross-promotion and synergies between e-commerce fashion retailers and rental platforms add value to both parties, attracting a larger customer base.
What are the market trends shaping the Online Clothing Rental Industry?
- Experiential marketing is gaining increasing popularity, representing a significant market trend in the present day. This form of marketing immerses consumers in brand experiences, creating lasting impressions and fostering deeper engagement.
- The fashion industry, comprised of retailers, agents, distributors, and research agencies, relies on consumer insights to inform marketing strategies for the upcoming season. Fashion retailers serve as key intermediaries, shaping consumer preferences. To differentiate themselves from competitors, fashion brand owners employ various marketing tactics, including experiential marketing. This approach engages customers directly in the marketing process through interactive experiences. Online fashion platforms, offering both sales and rental services, are leveraging experiential marketing to attract consumers. One such offering is event wear rental, which allows consumers to experiment with unique and trendy outfits for special occasions without the commitment of purchasing.
- Additionally, these platforms prioritize sustainability by utilizing recycled materials and implementing rigorous security measures to ensure cleanliness and hygiene. Fashion influencers and bloggers contribute to the fashion community by promoting these rental plans, expanding their reach and impact. Customer segmentation enables fashion platforms to cater to diverse demographics, particularly Gen Z, who value experiences over ownership. Virtual try-on technology further enhances the customer experience, making the rental process more convenient and accessible.
What challenges does the Online Clothing Rental Industry face during its growth?
- A weak inventory management system poses a significant challenge to the industry's growth by impeding operational efficiency, increasing carrying costs, and limiting the ability to meet customer demand effectively.
- Online clothing rental businesses cater to fashion-conscious consumers by offering access to a diverse inventory of clothing for various occasions and price points. However, managing inventory in this sector presents challenges, including demand fluctuations, stock-outs, and inadequate padding time, which can negatively impact sales and customer satisfaction. The demand for rental services is influenced by seasonal trends, with increased demand for formal wear during holidays. companies may experience stock-outs when supply fails to meet the high demand for specific clothing types. To stay competitive, online clothing rental businesses are forming brand partnerships and offering style guides to enhance the shopping experience.
- The circular economy and eco-conscious clothing trends are driving the adoption of rental services as an alternative to fast fashion. Data analytics and social media marketing are essential tools for companies to understand consumer preferences and stay updated on fashion trends. Size inclusivity is another crucial factor that sets successful rental businesses apart. By addressing these challenges and leveraging technology, online clothing rental businesses can thrive in the evolving ecommerce landscape.
Exclusive Customer Landscape
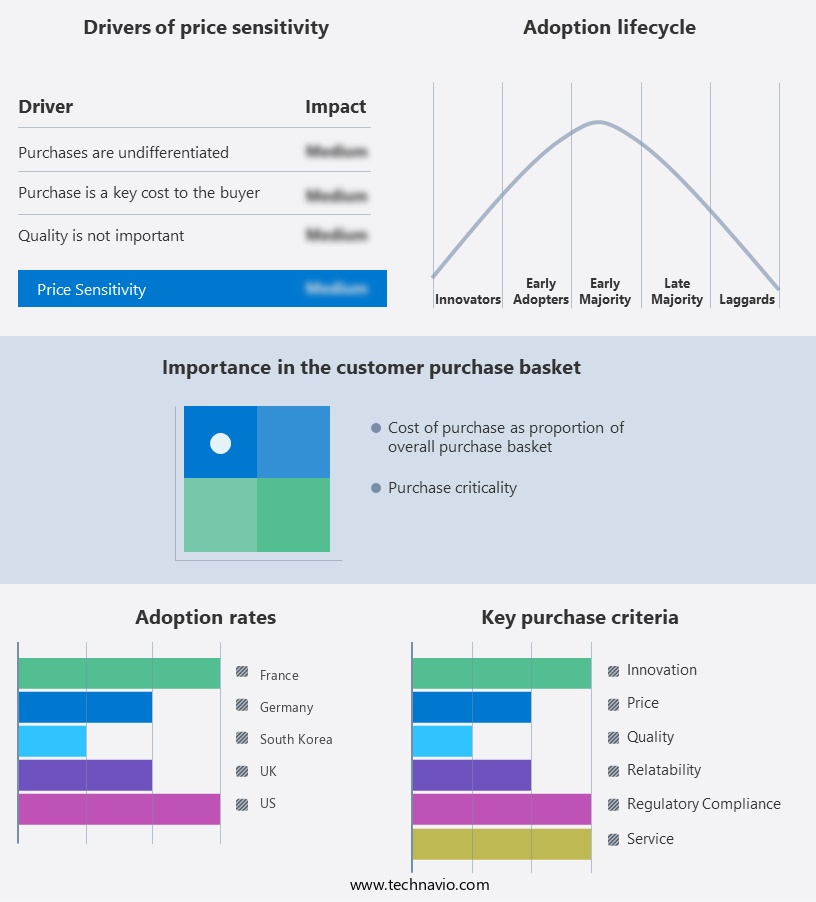
The online clothing rental market forecasting report includes the adoption lifecycle of the market, covering from the innovator's stage to the laggard's stage. It focuses on adoption rates in different regions based on penetration. Furthermore, the online clothing rental market report also includes key purchase criteria and drivers of price sensitivity to help companies evaluate and develop their market growth analysis strategies.
Customer Landscape
Key Companies & Market Insights
Companies are implementing various strategies, such as strategic alliances, online clothing rental market forecast, partnerships, mergers and acquisitions, geographical expansion, and product/service launches, to enhance their presence in the industry.
Rent the Runway - This company specializes in online rental services for authentic Indian ethnic wear, catering to a global clientele. Featuring an extensive collection of sarees, lehengas, sherwanis, and more for both men and women, this platform prioritizes originality and quality. By offering a diverse range of traditional Indian attire, it enables customers to explore and experiment with various styles, enhancing their wardrobe and cultural expression. The user-friendly website and seamless rental process ensure a convenient and enjoyable shopping experience.
The industry research and growth report includes detailed analyses of the competitive landscape of the market and information about key companies, including:
- Rent the Runway
- Le Tote
- Stitch Fix
- Haverdash
- Armoire
- Nuuly
- GlamCorner
- YCloset
- Rent Frock Repeat
- Girl Meets Dress
- Style Lend
- By Rotation
- The Volte
- FashionPass
- Vigmo
- Flyrobe
- Drexcode
- HURR Collective
- Wardrobe
- Share Wardrobe
Qualitative and quantitative analysis of companies has been conducted to help clients understand the wider business environment as well as the strengths and weaknesses of key industry players. Data is qualitatively analyzed to categorize companies as pure play, category-focused, industry-focused, and diversified; it is quantitatively analyzed to categorize companies as dominant, leading, strong, tentative, and weak.
Recent Development and News in Online Clothing Rental Market
- In February 2024, Rent the Runway, a leading player in the market, announced the launch of its new subscription service, "Update," offering customers unlimited rentals of trendy clothing items each month . This strategic move aimed to cater to the growing demand for affordable and sustainable fashion.
- In November 2024, The North Face, an outdoor clothing brand, partnered with Le Tote, a clothing rental service, to introduce an exclusive rental collection for outdoor enthusiasts.This collaboration marked a significant shift in the traditional retail industry, as more brands started exploring rental models to reach a wider audience and reduce inventory costs.
- In March 2025, Ann Inc., the parent company of Ann Taylor and Loft, raised USD125 million in a funding round to expand its rental business, Ann Taylor LOFT Style Pass. This investment would enable the company to accelerate its digital transformation and compete more effectively against other rental services.
- In June 2025, the European Union approved the Circular Economy Action Plan, which included provisions for promoting clothing rental services as a sustainable alternative to traditional retail. This regulatory approval marked a significant milestone for the market, as it provided a policy framework to support the growth of the sector and reduce textile waste.
Research Analyst Overview
- In the evolving world of business and fashion, the digital fashion industry is gaining significant traction, particularly in the realm of sustainable living. This market encompasses various sectors, including repairs and alterations, augmented reality, and fashion advocacy. One notable trend is the rise of AI-powered recommendations, enabling personalized style suggestions based on individual preferences and seasonal collections. Data privacy is a crucial aspect of this industry, ensuring customer trust. Brands offer virtual fitting rooms, style quizzes, and subscription management to enhance customer engagement. The trend towards conscious consumerism is driving the demand for eco-friendly fabrics and secondhand apparel, as well as fashion philanthropy and education.
- Logistics and delivery are streamlined with free shipping and efficient returns policies. Quality control is paramount, with tech-enabled fashion and wearable technology ensuring the best possible experience for consumers.
- Formal wear and designer clothing are popular categories, catering to various professional and social occasions. In the realm of fashion innovation, virtual reality and social commerce are transforming the way we shop and engage with brands. Community building and influencer marketing are essential tools for brand awareness and wardrobe management. The rental calendar offers flexibility and affordability, making fashion accessible to a broader audience. In summary, the digital fashion industry is a dynamic and innovative space, driven by trends such as AI-powered recommendations, sustainable living, and conscious consumerism. Brands focus on data privacy, personalized experiences, and efficient logistics to meet the evolving needs of consumers. The future of fashion is tech-enabled, socially conscious, and accessible to all.
Dive into Technavio's robust research methodology, blending expert interviews, extensive data synthesis, and validated models for unparalleled Online Clothing Rental Market insights. See full methodology.
|
Market Scope |
|
|
Report Coverage |
Details |
|
Page number |
201 |
|
Base year |
2024 |
|
Historic period |
2019-2023 |
|
Forecast period |
2025-2029 |
|
Growth momentum & CAGR |
Accelerate at a CAGR of 7.1% |
|
Market growth 2025-2029 |
USD 1163.4 million |
|
Market structure |
Fragmented |
|
YoY growth 2024-2025(%) |
6.2 |
|
Key countries |
US, China, Germany, Canada, India, South Korea, France, Japan, Italy, Brazil, UAE, UK, and SpainMexico |
|
Competitive landscape |
Leading Companies, Market Positioning of Companies, Competitive Strategies, and Industry Risks |
What are the Key Data Covered in this Online Clothing Rental Market Research and Growth Report?
- CAGR of the Online Clothing Rental industry during the forecast period
- Detailed information on factors that will drive the growth and forecasting between 2025 and 2029
- Precise estimation of the size of the market and its contribution of the industry in focus to the parent market
- Accurate predictions about upcoming growth and trends and changes in consumer behaviour
- Growth of the market across North America, Europe, APAC, South America, and Middle East and Africa
- Thorough analysis of the market's competitive landscape and detailed information about companies
- Comprehensive analysis of factors that will challenge the online clothing rental market growth of industry companies
We can help! Our analysts can customize this online clothing rental market research report to meet your requirements.
 RIA -
RIA - 
