Online Jewelry Market Analysis, Size, and Forecast 2026-2030: North America (US, Canada, and Mexico), Europe (Germany, UK, and France), APAC (China, India, and Japan), Middle East and Africa (UAE, Saudi Arabia, and South Africa), South America (Brazil and Argentina), and Rest of World (ROW)

Online Jewelry Market Analysis, Size, and Forecast 2026-2030:
North America (US, Canada, and Mexico), Europe (Germany, UK, and France), APAC (China, India, and Japan), Middle East and Africa (UAE, Saudi Arabia, and South Africa), South America (Brazil and Argentina), and Rest of World (ROW)

Published: Mar 2026 298 Pages SKU: IRTNTR43528

Market Overview at a Glance

$69.68 B
Market Opportunity
18.7%
CAGR 2025 - 2030
39.7%
North America Growth
$32.80 B
Fine jewelry segment 2024

Online Jewelry Market Size 2026-2030

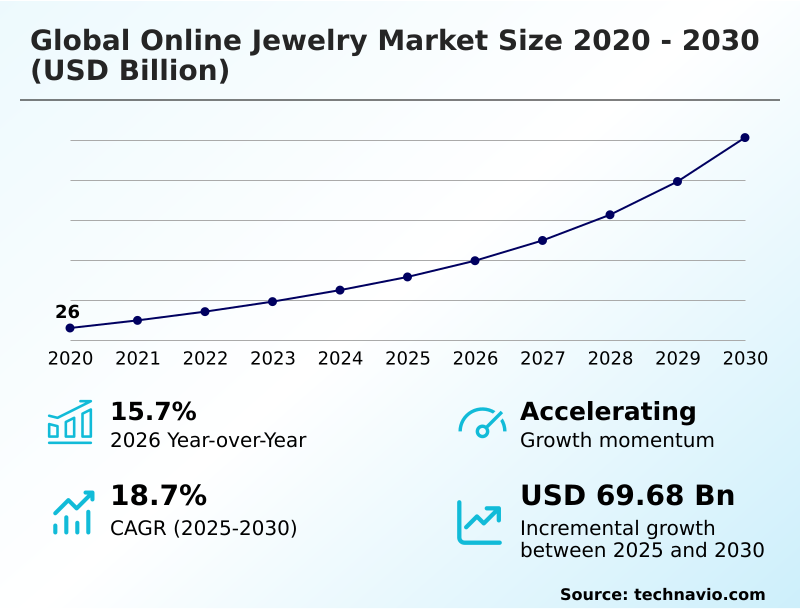
The online jewelry market size is valued to increase by USD 69.68 billion, at a CAGR of 18.7% from 2025 to 2030. Strong growth in digital payment adoption will drive the online jewelry market.

Major Market Trends & Insights

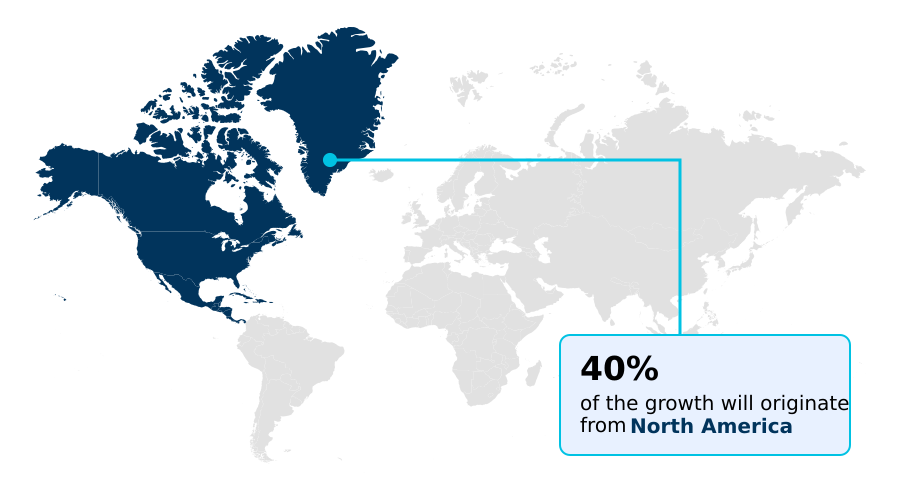
  • North America dominated the market and accounted for a 39.7% growth during the forecast period.
  • By Type - Fine jewelry segment was valued at USD 32.80 billion in 2024
  • By Product Type - Rings segment accounted for the largest market revenue share in 2024

Market Size & Forecast

  • Market Opportunities: USD 95.21 billion
  • Market Future Opportunities: USD 69.68 billion
  • CAGR from 2025 to 2030 : 18.7%

Market Summary

  • The online jewelry market continues its dynamic evolution, driven by technological advancements and shifting consumer behaviors. The integration of digital tools has become standard, moving beyond simple e-commerce to create immersive and trustworthy shopping experiences. Key trends include the widespread adoption of omnichannel strategies that blend online convenience with offline services and the increasing demand for personalized products.
  • This is facilitated by interactive design interfaces and on-demand manufacturing processes. A major driver is the growth of secure digital payment ecosystems, which reduce friction for high-value transactions. However, the industry grapples with challenges such as complex logistics for secure delivery and the persistent threat of counterfeit products, which erodes consumer confidence.
  • For instance, a direct-to-consumer brand must implement a sophisticated supply chain with real-time tracking and tamper-evident packaging to ensure a million-dollar necklace reaches its destination securely, a process that relies on both advanced logistics and digital verification to maintain brand integrity.

What will be the Size of the Online Jewelry Market during the forecast period?

Get Key Insights on Market Forecast (PDF) Request Free Sample

How is the Online Jewelry Market Segmented?

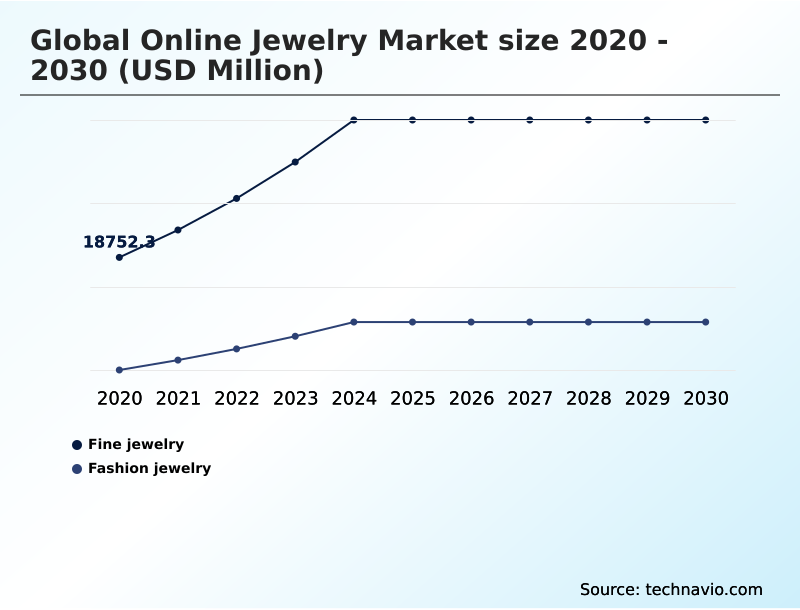
The online jewelry industry research report provides comprehensive data (region-wise segment analysis), with forecasts and estimates in "USD million" for the period 2026-2030, as well as historical data from 2020-2024 for the following segments.

  • Type
    • Fine jewelry
    • Fashion jewelry
  • Product type
    • Rings
    • Earrings
    • Necklaces
    • Bangles
    • Others
  • Price range
    • Luxury
    • Premium
    • Mid-range
    • Economical
  • Geography
    • North America
      • US
      • Canada
      • Mexico
    • Europe
      • Germany
      • UK
      • France
    • APAC
      • China
      • India
      • Japan
    • Middle East and Africa
      • UAE
      • Saudi Arabia
      • South Africa
    • South America
      • Brazil
      • Argentina
    • Rest of World (ROW)

By Type Insights

The fine jewelry segment is estimated to witness significant growth during the forecast period.

The fine jewelry segment is undergoing a significant transformation, with online platforms leveraging advanced technologies to build consumer trust.

The implementation of a digital verification protocol and blockchain-based tracing provides transparent histories for provenance, while tools like a smart-sizing tool address fit concerns.

The rise of on-demand manufacturing and 3D modeling enables deep personalization, further enhanced by innovations like a generative design platform. A growing focus on sustainability is evident through offerings like recycled gold jewelry and carbon-neutral mining partnerships.

Brands are refining the user experience design and conducting continuous A/B testing for conversion, with some achieving a 25% increase in repeat purchases through effective loyalty program management.

This focus on technology and sustainability is reshaping how high-value assets are sold online.

Request Free Sample

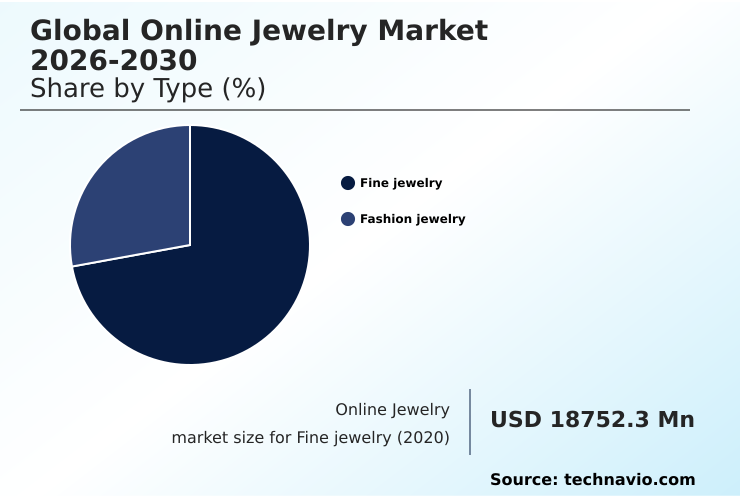
The Fine jewelry segment was valued at USD 32.80 billion in 2024 and showed a gradual increase during the forecast period.

Request Free Sample

Regional Analysis

North America is estimated to contribute 39.7% to the growth of the global market during the forecast period.Technavio’s analysts have elaborately explained the regional trends and drivers that shape the market during the forecast period.

See How Online Jewelry Market Demand is Rising in North America Request Free Sample

The geographic landscape of the online jewelry market is diverse, with North America expected to contribute nearly 39.7% of the total incremental growth.

This region's maturity is characterized by the rapid adoption of virtual try-on technology and mobile commerce optimization, with some retailers reporting a 30% uplift in engagement from mobile-first designs.

Europe is defined by a demand for precious metal traceability and heritage, while APAC is the most dynamic region, driven by mobile-first economies in China and India.

In the Middle East, a focus on luxury and bespoke services is transitioning online.

Across all regions, a successful approach requires localized strategies that consider cultural preferences, logistical infrastructure, and the growing demand for sustainable jewelry manufacturing and lab-grown diamond certification.

Market Dynamics

Our researchers analyzed the data with 2025 as the base year, along with the key drivers, trends, and challenges. A holistic analysis of drivers will help companies refine their marketing strategies to gain a competitive advantage.

  • The strategic focus in the online jewelry market is shifting toward sophisticated, niche applications of technology. For instance, the use of augmented reality try-on for engagement rings is becoming a standard feature to reduce purchase hesitation. To address authenticity concerns, blockchain for gemstone provenance tracking provides an immutable record of an item's history.
  • On the front end, AI-powered personalized jewelry recommendations and generative AI for custom jewelry design are creating highly engaging customer experiences. Operationally, ensuring secure logistics for high-value jewelry delivery is paramount. The successful implementation of an omnichannel strategy for luxury jewelry retail requires seamless integration of online and offline touchpoints.
  • Debates around lab-grown versus natural diamond analytics are influencing product assortments. A growing number of firms are highlighting sustainable practices in fine jewelry e-commerce and using a digital passport for authenticating vintage jewelry. Marketing efforts increasingly depend on analyzing the impact of influencer marketing on fashion jewelry and leveraging social commerce integration for impulse buys.
  • The effectiveness of virtual try-on reducing online jewelry returns is a key metric, with some platforms reporting a reduction of over 30% in return rates, directly improving operational efficiency. Firms are also using data analytics for jewelry trend forecasting and executing campaigns based on hyper-personalization in D2C jewelry marketing.
  • Proactively managing counterfeit products in online marketplaces and optimizing mobile commerce for jewelry sales are critical for sustained growth. The backend is powered by 3D modeling for bespoke jewelry manufacturing, while customer sentiment analysis for jewelry brands informs strategy.
  • Ultimately, demonstrating ethical sourcing transparency in supply chains and exploring circular economy models for jewelry brands are becoming essential for long-term brand value.

What are the key market drivers leading to the rise in the adoption of Online Jewelry Industry?

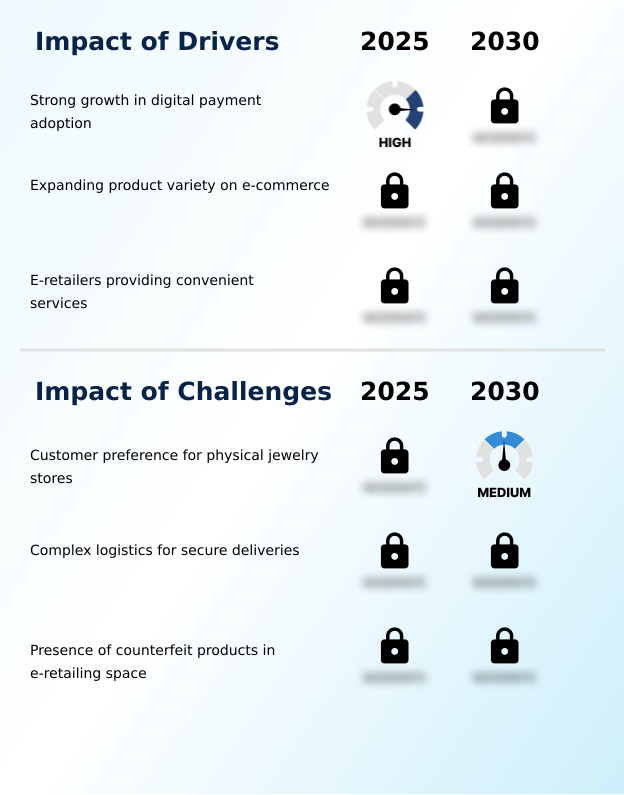
  • The strong growth in digital payment adoption is a key driver accelerating market expansion by enhancing transaction security, convenience, and accessibility for a global consumer base.

  • A key driver for the online jewelry market is the expanding product variety, enhanced by visual search algorithms that improve product discovery success rates by 40%. This vast selection, managed through effective product information management, attracts diverse demographics.
  • The growth in digital payment adoption, underpinned by AI-driven fraud protection, has also been pivotal, with buy now, pay later integration increasing average order values by over 15% for some retailers.
  • E-retailers providing convenient services, including virtual consultation services and high-resolution product visuals, build consumer confidence for high-value purchases.
  • Furthermore, the integration of a dynamic pricing engine and customer feedback analysis allows platforms to offer competitive pricing and continually refine the shopping experience, ensuring long-term customer loyalty.

What are the market trends shaping the Online Jewelry Industry?

  • The increasing adoption of omnichannel strategies is a significant market trend, compelling retailers to integrate physical and digital touchpoints to deliver a seamless and consistent customer journey.

  • The online jewelry market is increasingly shaped by the adoption of an omnichannel retail strategy, which has been shown to improve customer retention by up to 20% compared to single-channel approaches. This integration creates a seamless customer journey mapping experience across digital and physical touchpoints.
  • Personalization is another key trend, with platforms offering a custom engagement ring configurator and leveraging AI-based recommendations to drive sales. Brands utilizing augmented reality try-on features have reported a 35% reduction in product returns.
  • Furthermore, the rise of social commerce integration and shoppertainment platform integration allows brands to engage consumers directly, turning inspiration into immediate transactions through compelling visual content and influencer collaborations, optimizing the digital storefront optimization. This dynamic environment prioritizes both technological innovation and personalized customer engagement.

What challenges does the Online Jewelry Industry face during its growth?

  • The persistent customer preference for the tangible experience offered by physical jewelry stores remains a key challenge, limiting the full growth potential of the online retail channel.

  • Despite growth, the market faces challenges from customer preference for physical stores, where perceived trust is higher. Logistical complexities for high-value logistics coordination also present hurdles, with secure, tamper-evident packaging and insured shipping increasing operational costs by as much as 18% per order.
  • The presence of counterfeit products erodes trust, requiring significant investment in digital identity verification and user-generated content moderation. This can increase customer acquisition costs by 25% as brands work to rebuild confidence. Managing these issues demands robust cyber-security for e-commerce, effective returns management software, and sophisticated last-mile delivery optimization.
  • Overcoming these challenges is essential for ensuring the credibility and scalability of online jewelry retail.

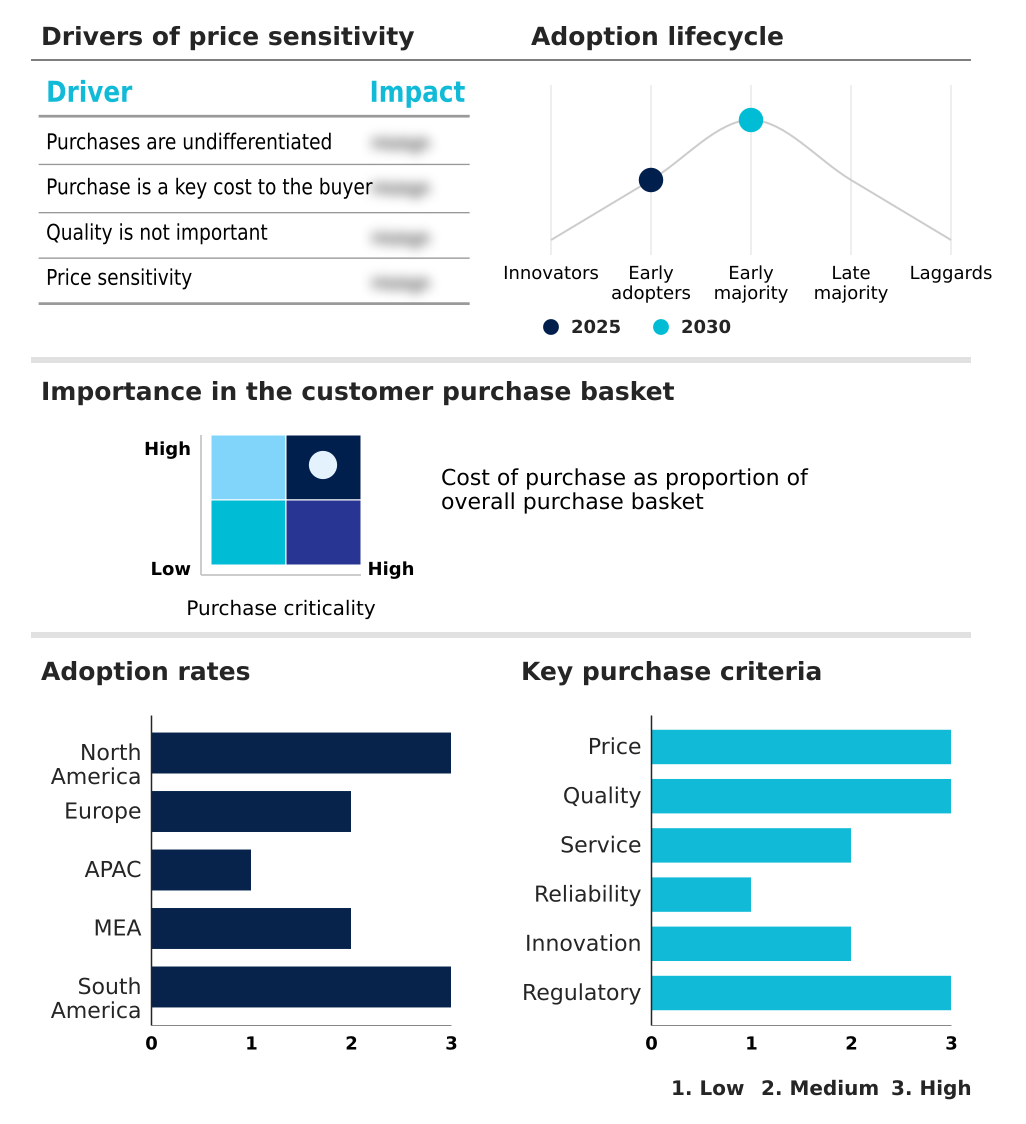
Exclusive Technavio Analysis on Customer Landscape

The online jewelry market forecasting report includes the adoption lifecycle of the market, covering from the innovator’s stage to the laggard’s stage. It focuses on adoption rates in different regions based on penetration. Furthermore, the online jewelry market report also includes key purchase criteria and drivers of price sensitivity to help companies evaluate and develop their market growth analysis strategies.

Customer Landscape of Online Jewelry Industry

Competitive Landscape

Companies are implementing various strategies, such as strategic alliances, online jewelry market forecast, partnerships, mergers and acquisitions, geographical expansion, and product/service launches, to enhance their presence in the industry.

AUrate New York - Specializes in ethically sourced precious metal jewelry, utilizing a direct-to-consumer model focused on sustainability and accessible luxury within the digital marketplace.

The industry research and growth report includes detailed analyses of the competitive landscape of the market and information about key companies, including:

  • AUrate New York
  • Boucheron Holding SAS
  • Buccellati
  • Bulgari S.p.A
  • Cartier SA
  • Catbird LLC
  • Chopard Group
  • Chow Sang Sang Holdings
  • David Yurman Enterprises LLC
  • Graff Diamonds Ltd.
  • Harry Winston Inc.
  • K. Mikimoto and Co. Ltd.
  • Kendra Scott LLC
  • Mejuri Inc
  • Monica Vinader Ltd.
  • Pandora Jewelry LLC
  • Swarovski AG
  • Tiffany and Co.
  • Van Cleef and Arpels
  • VRAI

Qualitative and quantitative analysis of companies has been conducted to help clients understand the wider business environment as well as the strengths and weaknesses of key industry players. Data is qualitatively analyzed to categorize companies as pure play, category-focused, industry-focused, and diversified; it is quantitatively analyzed to categorize companies as dominant, leading, strong, tentative, and weak.

Recent Development and News in Online jewelry market

  • In August, 2025, Tiffany and Co. and Rio Tinto launched the 'Earth-First Elegance' initiative, a limited-edition necklace collection sold exclusively online to highlight a shared commitment to environmental responsibility and supply chain transparency.
  • In December, 2025, Apple Inc. released a specialized software update for its spatial computing hardware, enhancing the visual fidelity of precious minerals and metals to create a more realistic virtual shopping experience.
  • In February, 2025, De Beers introduced an innovative generative design platform, enabling users to create bespoke ring settings through voice commands, bridging the gap between traditional craftsmanship and digital convenience.
  • In May, 2025, Malca-Amit implemented an advanced real-time tracking system integrated with decentralized ledgers to verify the provenance and chain of custody for every gemstone in transit, enhancing security for online purchases.

Dive into Technavio’s robust research methodology, blending expert interviews, extensive data synthesis, and validated models for unparalleled Online Jewelry Market insights. See full methodology.

Market Scope
Page number 298
Base year 2025
Historic period 2020-2024
Forecast period 2026-2030
Growth momentum & CAGR Accelerate at a CAGR of 18.7%
Market growth 2026-2030 USD 69679.4 million
Market structure Fragmented
YoY growth 2025-2026(%) 15.7%
Key countries US, Canada, Mexico, Germany, UK, France, Italy, Spain, The Netherlands, China, India, Japan, South Korea, Australia, Indonesia, UAE, Saudi Arabia, South Africa, Turkey, Israel, Brazil, Argentina and Chile
Competitive landscape Leading Companies, Market Positioning of Companies, Competitive Strategies, and Industry Risks

Request Free Sample

Research Analyst Overview

  • The online jewelry market's evolution is defined by rapid technological integration. Boardroom decisions now center on implementing an omnichannel retail strategy, supported by virtual showroom technology and mobile commerce optimization. Building trust is paramount, addressed through a digital product passport using decentralized ledger technology and digital identity verification.
  • The customer experience is enhanced with augmented reality try-on and virtual try-on technology, alongside AI-based recommendations and an AI concierge. Customization is enabled by a generative design platform, interactive design interfaces, 3D modeling, and on-demand manufacturing. Retailers are leveraging social commerce integration and a visual search algorithm for discovery.
  • Operationally, efficiency is gained through an automated fulfillment center, last-mile delivery optimization, and a smart-sizing tool. Investment in predictive analytics tools for trend-spotting, influencer marketing analytics, and data analytics for customer relationship management is critical. Security is handled by AI-driven fraud protection and secure payment gateways, while logistics depend on secure packaging solutions and tamper-evident packaging.
  • Implementing these technologies, such as a digital verification protocol for authenticity, can improve compliance reporting speed by 40%.

What are the Key Data Covered in this Online Jewelry Market Research and Growth Report?

  • What is the expected growth of the Online Jewelry Market between 2026 and 2030?

    • USD 69.68 billion, at a CAGR of 18.7%

  • What segmentation does the market report cover?

    • The report is segmented by Type (Fine jewelry, and Fashion jewelry), Product Type (Rings, Earrings, Necklaces, Bangles, and Others), Price Range (Luxury, Premium, Mid-range, and Economical) and Geography (North America, Europe, APAC, Middle East and Africa, South America)

  • Which regions are analyzed in the report?

    • North America, Europe, APAC, Middle East and Africa and South America

  • What are the key growth drivers and market challenges?

    • Strong growth in digital payment adoption, Customer preference for physical jewelry stores

  • Who are the major players in the Online Jewelry Market?

    • AUrate New York, Boucheron Holding SAS, Buccellati, Bulgari S.p.A, Cartier SA, Catbird LLC, Chopard Group, Chow Sang Sang Holdings, David Yurman Enterprises LLC, Graff Diamonds Ltd., Harry Winston Inc., K. Mikimoto and Co. Ltd., Kendra Scott LLC, Mejuri Inc, Monica Vinader Ltd., Pandora Jewelry LLC, Swarovski AG, Tiffany and Co., Van Cleef and Arpels and VRAI

Market Research Insights

  • The market's dynamism is driven by a focus on ethical sourcing verification and lab-grown diamond certification, with precious metal traceability becoming a key differentiator. Brands are adopting sustainable jewelry manufacturing using recycled gold jewelry and forming carbon-neutral mining partnerships. A superior customer journey mapping is achieved through a custom engagement ring configurator and virtual consultation services.
  • Platforms are leveraging shoppertainment platform integration and AI-powered styling tools, leading to a 25% increase in user engagement. Behind the scenes, headless commerce architecture allows for flexible digital storefront optimization and better loyalty program management. Integrating buy now, pay later options can lift conversion rates by 15%.
  • Success also hinges on cross-border e-commerce logistics, efficient returns management software, and customer feedback analysis to refine strategies and ensure a seamless experience.

We can help! Our analysts can customize this online jewelry market research report to meet your requirements.

Get in touch

1. Executive Summary

1.1 Market overview

Executive Summary - Chart on Market Overview
Executive Summary - Data Table on Market Overview
Executive Summary - Chart on Global Market Characteristics
Executive Summary - Chart on Market by Geography
Executive Summary - Chart on Market Segmentation by Type
Executive Summary - Chart on Market Segmentation by Product Type
Executive Summary - Chart on Market Segmentation by Price Range
Executive Summary - Chart on Incremental Growth
Executive Summary - Data Table on Incremental Growth
Executive Summary - Chart on Company Market Positioning

2. Technavio Analysis

2.1 Analysis of price sensitivity, lifecycle, customer purchase basket, adoption rates, and purchase criteria

2.2 Criticality of inputs and Factors of differentiation

Chart on Overview on criticality of inputs and factors of differentiation

2.3 Factors of disruption

Chart on Overview on factors of disruption

2.4 Impact of drivers and challenges

Chart on Impact of drivers and challenges in 2025 and 2030

3. Market Landscape

3.1 Market ecosystem

Chart on Parent Market
Data Table on - Parent Market

3.2 Market characteristics

Chart on Market characteristics analysis

3.3 Value chain analysis

Chart on Value chain analysis

4. Market Sizing

4.1 Market definition

Data Table on Offerings of companies included in the market definition

4.2 Market segment analysis

Market segments

4.3 Market size 2025

4.4 Market outlook: Forecast for 2025-2030

Chart on Global - Market size and forecast 2025-2030 ($ million)
Data Table on Global - Market size and forecast 2025-2030 ($ million)
Chart on Global Market: Year-over-year growth 2025-2030 (%)
Data Table on Global Market: Year-over-year growth 2025-2030 (%)

5. Historic Market Size

5.1 Global Online Jewelry Market 2020 - 2024

Historic Market Size - Data Table on Global Online Jewelry Market 2020 - 2024 ($ million)

5.2 Type segment analysis 2020 - 2024

Historic Market Size - Type Segment 2020 - 2024 ($ million)

5.3 Product Type segment analysis 2020 - 2024

Historic Market Size - Product Type Segment 2020 - 2024 ($ million)

5.4 Price Range segment analysis 2020 - 2024

Historic Market Size - Price Range Segment 2020 - 2024 ($ million)

5.5 Geography segment analysis 2020 - 2024

Historic Market Size - Geography Segment 2020 - 2024 ($ million)

5.6 Country segment analysis 2020 - 2024

Historic Market Size - Country Segment 2020 - 2024 ($ million)

6. Qualitative Analysis

6.1 Impact of AI in the Global Online Jewelry Market

7. Five Forces Analysis

7.1 Five forces summary

Five forces analysis - Comparison between 2025 and 2030

7.2 Bargaining power of buyers

Bargaining power of buyers - Impact of key factors 2025 and 2030

7.3 Bargaining power of suppliers

Bargaining power of suppliers - Impact of key factors in 2025 and 2030

7.4 Threat of new entrants

Threat of new entrants - Impact of key factors in 2025 and 2030

7.5 Threat of substitutes

Threat of substitutes - Impact of key factors in 2025 and 2030

7.6 Threat of rivalry

Threat of rivalry - Impact of key factors in 2025 and 2030

7.7 Market condition

Chart on Market condition - Five forces 2025 and 2030

8. Market Segmentation by Type

8.1 Market segments

Chart on Type - Market share 2025-2030 (%)
Data Table on Type - Market share 2025-2030 (%)

8.2 Comparison by Type

Chart on Comparison by Type
Data Table on Comparison by Type

8.3 Fine jewelry - Market size and forecast 2025-2030

Chart on Fine jewelry - Market size and forecast 2025-2030 ($ million)
Data Table on Fine jewelry - Market size and forecast 2025-2030 ($ million)
Chart on Fine jewelry - Year-over-year growth 2025-2030 (%)
Data Table on Fine jewelry - Year-over-year growth 2025-2030 (%)

8.4 Fashion jewelry - Market size and forecast 2025-2030

Chart on Fashion jewelry - Market size and forecast 2025-2030 ($ million)
Data Table on Fashion jewelry - Market size and forecast 2025-2030 ($ million)
Chart on Fashion jewelry - Year-over-year growth 2025-2030 (%)
Data Table on Fashion jewelry - Year-over-year growth 2025-2030 (%)

8.5 Market opportunity by Type

Market opportunity by Type ($ million)
Data Table on Market opportunity by Type ($ million)

9. Market Segmentation by Product Type

9.1 Market segments

Chart on Product Type - Market share 2025-2030 (%)
Data Table on Product Type - Market share 2025-2030 (%)

9.2 Comparison by Product Type

Chart on Comparison by Product Type
Data Table on Comparison by Product Type

9.3 Rings - Market size and forecast 2025-2030

Chart on Rings - Market size and forecast 2025-2030 ($ million)
Data Table on Rings - Market size and forecast 2025-2030 ($ million)
Chart on Rings - Year-over-year growth 2025-2030 (%)
Data Table on Rings - Year-over-year growth 2025-2030 (%)

9.4 Earrings - Market size and forecast 2025-2030

Chart on Earrings - Market size and forecast 2025-2030 ($ million)
Data Table on Earrings - Market size and forecast 2025-2030 ($ million)
Chart on Earrings - Year-over-year growth 2025-2030 (%)
Data Table on Earrings - Year-over-year growth 2025-2030 (%)

9.5 Necklaces - Market size and forecast 2025-2030

Chart on Necklaces - Market size and forecast 2025-2030 ($ million)
Data Table on Necklaces - Market size and forecast 2025-2030 ($ million)
Chart on Necklaces - Year-over-year growth 2025-2030 (%)
Data Table on Necklaces - Year-over-year growth 2025-2030 (%)

9.6 Bangles - Market size and forecast 2025-2030

Chart on Bangles - Market size and forecast 2025-2030 ($ million)
Data Table on Bangles - Market size and forecast 2025-2030 ($ million)
Chart on Bangles - Year-over-year growth 2025-2030 (%)
Data Table on Bangles - Year-over-year growth 2025-2030 (%)

9.7 Others - Market size and forecast 2025-2030

Chart on Others - Market size and forecast 2025-2030 ($ million)
Data Table on Others - Market size and forecast 2025-2030 ($ million)
Chart on Others - Year-over-year growth 2025-2030 (%)
Data Table on Others - Year-over-year growth 2025-2030 (%)

9.8 Market opportunity by Product Type

Market opportunity by Product Type ($ million)
Data Table on Market opportunity by Product Type ($ million)

10. Market Segmentation by Price Range

10.1 Market segments

Chart on Price Range - Market share 2025-2030 (%)
Data Table on Price Range - Market share 2025-2030 (%)

10.2 Comparison by Price Range

Chart on Comparison by Price Range
Data Table on Comparison by Price Range

10.3 Luxury - Market size and forecast 2025-2030

Chart on Luxury - Market size and forecast 2025-2030 ($ million)
Data Table on Luxury - Market size and forecast 2025-2030 ($ million)
Chart on Luxury - Year-over-year growth 2025-2030 (%)
Data Table on Luxury - Year-over-year growth 2025-2030 (%)

10.4 Premium - Market size and forecast 2025-2030

Chart on Premium - Market size and forecast 2025-2030 ($ million)
Data Table on Premium - Market size and forecast 2025-2030 ($ million)
Chart on Premium - Year-over-year growth 2025-2030 (%)
Data Table on Premium - Year-over-year growth 2025-2030 (%)

10.5 Mid-range - Market size and forecast 2025-2030

Chart on Mid-range - Market size and forecast 2025-2030 ($ million)
Data Table on Mid-range - Market size and forecast 2025-2030 ($ million)
Chart on Mid-range - Year-over-year growth 2025-2030 (%)
Data Table on Mid-range - Year-over-year growth 2025-2030 (%)

10.6 Economical - Market size and forecast 2025-2030

Chart on Economical - Market size and forecast 2025-2030 ($ million)
Data Table on Economical - Market size and forecast 2025-2030 ($ million)
Chart on Economical - Year-over-year growth 2025-2030 (%)
Data Table on Economical - Year-over-year growth 2025-2030 (%)

10.7 Market opportunity by Price Range

Market opportunity by Price Range ($ million)
Data Table on Market opportunity by Price Range ($ million)

11. Customer Landscape

11.1 Customer landscape overview

Analysis of price sensitivity, lifecycle, customer purchase basket, adoption rates, and purchase criteria

12. Geographic Landscape

12.1 Geographic segmentation

Chart on Market share by geography 2025-2030 (%)
Data Table on Market share by geography 2025-2030 (%)

12.2 Geographic comparison

Chart on Geographic comparison
Data Table on Geographic comparison

12.3 North America - Market size and forecast 2025-2030

Chart on North America - Market size and forecast 2025-2030 ($ million)
Data Table on North America - Market size and forecast 2025-2030 ($ million)
Chart on North America - Year-over-year growth 2025-2030 (%)
Data Table on North America - Year-over-year growth 2025-2030 (%)
Chart on Regional Comparison - North America
Data Table on Regional Comparison - North America

12.3.1 US - Market size and forecast 2025-2030

Chart on US - Market size and forecast 2025-2030 ($ million)
Data Table on US - Market size and forecast 2025-2030 ($ million)
Chart on US - Year-over-year growth 2025-2030 (%)
Data Table on US - Year-over-year growth 2025-2030 (%)

12.3.2 Canada - Market size and forecast 2025-2030

Chart on Canada - Market size and forecast 2025-2030 ($ million)
Data Table on Canada - Market size and forecast 2025-2030 ($ million)
Chart on Canada - Year-over-year growth 2025-2030 (%)
Data Table on Canada - Year-over-year growth 2025-2030 (%)

12.3.3 Mexico - Market size and forecast 2025-2030

Chart on Mexico - Market size and forecast 2025-2030 ($ million)
Data Table on Mexico - Market size and forecast 2025-2030 ($ million)
Chart on Mexico - Year-over-year growth 2025-2030 (%)
Data Table on Mexico - Year-over-year growth 2025-2030 (%)

12.4 Europe - Market size and forecast 2025-2030

Chart on Europe - Market size and forecast 2025-2030 ($ million)
Data Table on Europe - Market size and forecast 2025-2030 ($ million)
Chart on Europe - Year-over-year growth 2025-2030 (%)
Data Table on Europe - Year-over-year growth 2025-2030 (%)
Chart on Regional Comparison - Europe
Data Table on Regional Comparison - Europe

12.4.1 Germany - Market size and forecast 2025-2030

Chart on Germany - Market size and forecast 2025-2030 ($ million)
Data Table on Germany - Market size and forecast 2025-2030 ($ million)
Chart on Germany - Year-over-year growth 2025-2030 (%)
Data Table on Germany - Year-over-year growth 2025-2030 (%)

12.4.2 UK - Market size and forecast 2025-2030

Chart on UK - Market size and forecast 2025-2030 ($ million)
Data Table on UK - Market size and forecast 2025-2030 ($ million)
Chart on UK - Year-over-year growth 2025-2030 (%)
Data Table on UK - Year-over-year growth 2025-2030 (%)

12.4.3 France - Market size and forecast 2025-2030

Chart on France - Market size and forecast 2025-2030 ($ million)
Data Table on France - Market size and forecast 2025-2030 ($ million)
Chart on France - Year-over-year growth 2025-2030 (%)
Data Table on France - Year-over-year growth 2025-2030 (%)

12.4.4 Italy - Market size and forecast 2025-2030

Chart on Italy - Market size and forecast 2025-2030 ($ million)
Data Table on Italy - Market size and forecast 2025-2030 ($ million)
Chart on Italy - Year-over-year growth 2025-2030 (%)
Data Table on Italy - Year-over-year growth 2025-2030 (%)

12.4.5 Spain - Market size and forecast 2025-2030

Chart on Spain - Market size and forecast 2025-2030 ($ million)
Data Table on Spain - Market size and forecast 2025-2030 ($ million)
Chart on Spain - Year-over-year growth 2025-2030 (%)
Data Table on Spain - Year-over-year growth 2025-2030 (%)

12.4.6 The Netherlands - Market size and forecast 2025-2030

Chart on The Netherlands - Market size and forecast 2025-2030 ($ million)
Data Table on The Netherlands - Market size and forecast 2025-2030 ($ million)
Chart on The Netherlands - Year-over-year growth 2025-2030 (%)
Data Table on The Netherlands - Year-over-year growth 2025-2030 (%)

12.5 APAC - Market size and forecast 2025-2030

Chart on APAC - Market size and forecast 2025-2030 ($ million)
Data Table on APAC - Market size and forecast 2025-2030 ($ million)
Chart on APAC - Year-over-year growth 2025-2030 (%)
Data Table on APAC - Year-over-year growth 2025-2030 (%)
Chart on Regional Comparison - APAC
Data Table on Regional Comparison - APAC

12.5.1 China - Market size and forecast 2025-2030

Chart on China - Market size and forecast 2025-2030 ($ million)
Data Table on China - Market size and forecast 2025-2030 ($ million)
Chart on China - Year-over-year growth 2025-2030 (%)
Data Table on China - Year-over-year growth 2025-2030 (%)

12.5.2 India - Market size and forecast 2025-2030

Chart on India - Market size and forecast 2025-2030 ($ million)
Data Table on India - Market size and forecast 2025-2030 ($ million)
Chart on India - Year-over-year growth 2025-2030 (%)
Data Table on India - Year-over-year growth 2025-2030 (%)

12.5.3 Japan - Market size and forecast 2025-2030

Chart on Japan - Market size and forecast 2025-2030 ($ million)
Data Table on Japan - Market size and forecast 2025-2030 ($ million)
Chart on Japan - Year-over-year growth 2025-2030 (%)
Data Table on Japan - Year-over-year growth 2025-2030 (%)

12.5.4 South Korea - Market size and forecast 2025-2030

Chart on South Korea - Market size and forecast 2025-2030 ($ million)
Data Table on South Korea - Market size and forecast 2025-2030 ($ million)
Chart on South Korea - Year-over-year growth 2025-2030 (%)
Data Table on South Korea - Year-over-year growth 2025-2030 (%)

12.5.5 Australia - Market size and forecast 2025-2030

Chart on Australia - Market size and forecast 2025-2030 ($ million)
Data Table on Australia - Market size and forecast 2025-2030 ($ million)
Chart on Australia - Year-over-year growth 2025-2030 (%)
Data Table on Australia - Year-over-year growth 2025-2030 (%)

12.5.6 Indonesia - Market size and forecast 2025-2030

Chart on Indonesia - Market size and forecast 2025-2030 ($ million)
Data Table on Indonesia - Market size and forecast 2025-2030 ($ million)
Chart on Indonesia - Year-over-year growth 2025-2030 (%)
Data Table on Indonesia - Year-over-year growth 2025-2030 (%)

12.6 Middle East and Africa - Market size and forecast 2025-2030

Chart on Middle East and Africa - Market size and forecast 2025-2030 ($ million)
Data Table on Middle East and Africa - Market size and forecast 2025-2030 ($ million)
Chart on Middle East and Africa - Year-over-year growth 2025-2030 (%)
Data Table on Middle East and Africa - Year-over-year growth 2025-2030 (%)
Chart on Regional Comparison - Middle East and Africa
Data Table on Regional Comparison - Middle East and Africa

12.6.1 UAE - Market size and forecast 2025-2030

Chart on UAE - Market size and forecast 2025-2030 ($ million)
Data Table on UAE - Market size and forecast 2025-2030 ($ million)
Chart on UAE - Year-over-year growth 2025-2030 (%)
Data Table on UAE - Year-over-year growth 2025-2030 (%)

12.6.2 Saudi Arabia - Market size and forecast 2025-2030

Chart on Saudi Arabia - Market size and forecast 2025-2030 ($ million)
Data Table on Saudi Arabia - Market size and forecast 2025-2030 ($ million)
Chart on Saudi Arabia - Year-over-year growth 2025-2030 (%)
Data Table on Saudi Arabia - Year-over-year growth 2025-2030 (%)

12.6.3 South Africa - Market size and forecast 2025-2030

Chart on South Africa - Market size and forecast 2025-2030 ($ million)
Data Table on South Africa - Market size and forecast 2025-2030 ($ million)
Chart on South Africa - Year-over-year growth 2025-2030 (%)
Data Table on South Africa - Year-over-year growth 2025-2030 (%)

12.6.4 Turkey - Market size and forecast 2025-2030

Chart on Turkey - Market size and forecast 2025-2030 ($ million)
Data Table on Turkey - Market size and forecast 2025-2030 ($ million)
Chart on Turkey - Year-over-year growth 2025-2030 (%)
Data Table on Turkey - Year-over-year growth 2025-2030 (%)

12.6.5 Israel - Market size and forecast 2025-2030

Chart on Israel - Market size and forecast 2025-2030 ($ million)
Data Table on Israel - Market size and forecast 2025-2030 ($ million)
Chart on Israel - Year-over-year growth 2025-2030 (%)
Data Table on Israel - Year-over-year growth 2025-2030 (%)

12.7 South America - Market size and forecast 2025-2030

Chart on South America - Market size and forecast 2025-2030 ($ million)
Data Table on South America - Market size and forecast 2025-2030 ($ million)
Chart on South America - Year-over-year growth 2025-2030 (%)
Data Table on South America - Year-over-year growth 2025-2030 (%)
Chart on Regional Comparison - South America
Data Table on Regional Comparison - South America

12.7.1 Brazil - Market size and forecast 2025-2030

Chart on Brazil - Market size and forecast 2025-2030 ($ million)
Data Table on Brazil - Market size and forecast 2025-2030 ($ million)
Chart on Brazil - Year-over-year growth 2025-2030 (%)
Data Table on Brazil - Year-over-year growth 2025-2030 (%)

12.7.2 Argentina - Market size and forecast 2025-2030

Chart on Argentina - Market size and forecast 2025-2030 ($ million)
Data Table on Argentina - Market size and forecast 2025-2030 ($ million)
Chart on Argentina - Year-over-year growth 2025-2030 (%)
Data Table on Argentina - Year-over-year growth 2025-2030 (%)

12.7.3 Chile - Market size and forecast 2025-2030

Chart on Chile - Market size and forecast 2025-2030 ($ million)
Data Table on Chile - Market size and forecast 2025-2030 ($ million)
Chart on Chile - Year-over-year growth 2025-2030 (%)
Data Table on Chile - Year-over-year growth 2025-2030 (%)

12.8 Market opportunity by geography

Market opportunity by geography ($ million)
Data Tables on Market opportunity by geography ($ million)

13. Drivers, Challenges, and Opportunity

13.1 Market drivers

Strong growth in digital payment adoption
Expanding product variety on e‑commerce
E-retailers providing convenient services

13.2 Market challenges

Customer preference for physical jewelry stores
Complex logistics for secure deliveries
Presence of counterfeit products in e-retailing space

13.3 Impact of drivers and challenges

Impact of drivers and challenges in 2025 and 2030

13.4 Market opportunities

Increase in adoption of omnichannel strategy
Rising demand for personalized jewelry designs
Increasing social media marketing influence

14. Competitive Landscape

14.1 Overview

14.2

Overview on criticality of inputs and factors of differentiation

14.3 Landscape disruption

Overview on factors of disruption

14.4 Industry risks

Impact of key risks on business

15. Competitive Analysis

15.1 Companies profiled

Companies covered

15.2 Company ranking index

15.3 Market positioning of companies

Matrix on companies position and classification

15.4 AUrate New York

AUrate New York - Overview
AUrate New York - Product / Service
AUrate New York - Key offerings
SWOT

15.5 Boucheron Holding SAS

Boucheron Holding SAS - Overview
Boucheron Holding SAS - Product / Service
Boucheron Holding SAS - Key offerings
SWOT

15.6 Buccellati

Buccellati - Overview
Buccellati - Product / Service
Buccellati - Key offerings
SWOT

15.7 Bulgari S.p.A

Bulgari S.p.A - Overview
Bulgari S.p.A - Product / Service
Bulgari S.p.A - Key offerings
SWOT

15.8 Cartier SA

Cartier SA - Overview
Cartier SA - Product / Service
Cartier SA - Key offerings
SWOT

15.9 Catbird LLC

Catbird LLC - Overview
Catbird LLC - Product / Service
Catbird LLC - Key offerings
SWOT

15.10 Chopard Group

Chopard Group - Overview
Chopard Group - Product / Service
Chopard Group - Key offerings
SWOT

15.11 Chow Sang Sang Holdings

Chow Sang Sang Holdings - Overview
Chow Sang Sang Holdings - Product / Service
Chow Sang Sang Holdings - Key offerings
SWOT

15.12 Graff Diamonds Ltd.

Graff Diamonds Ltd. - Overview
Graff Diamonds Ltd. - Product / Service
Graff Diamonds Ltd. - Key offerings
SWOT

15.13 Harry Winston Inc.

Harry Winston Inc. - Overview
Harry Winston Inc. - Product / Service
Harry Winston Inc. - Key offerings
SWOT

15.14 Kendra Scott LLC

Kendra Scott LLC - Overview
Kendra Scott LLC - Product / Service
Kendra Scott LLC - Key offerings
SWOT

15.15 Mejuri Inc

Mejuri Inc - Overview
Mejuri Inc - Product / Service
Mejuri Inc - Key offerings
SWOT

15.16 Pandora Jewelry LLC

Pandora Jewelry LLC - Overview
Pandora Jewelry LLC - Product / Service
Pandora Jewelry LLC - Key offerings
SWOT

15.17 Swarovski AG

Swarovski AG - Overview
Swarovski AG - Product / Service
Swarovski AG - Key offerings
SWOT

15.18 Van Cleef and Arpels

Van Cleef and Arpels - Overview
Van Cleef and Arpels - Product / Service
Van Cleef and Arpels - Key offerings
SWOT

16. Appendix

16.1 Scope of the report

Market definition
Objectives
Notes and caveats

16.2 Inclusions and exclusions checklist

Inclusions checklist
Exclusions checklist

16.3 Currency conversion rates for US$

16.4 Research methodology

16.5 Data procurement

Information sources

16.6 Data validation

16.7 Validation techniques employed for market sizing

16.8 Data synthesis

16.9 360 degree market analysis

16.10 List of abbreviations

Research Methodology

Technavio presents a detailed picture of the market by way of study, synthesis, and summation of data from multiple sources. The analysts have presented the various facets of the market with a particular focus on identifying the key industry influencers. The data thus presented is comprehensive, reliable, and the result of extensive research, both primary and secondary.

INFORMATION SOURCES

Primary sources

  • Manufacturers and suppliers
  • Channel partners
  • Industry experts
  • Strategic decision makers

Secondary sources

  • Industry journals and periodicals
  • Government data
  • Financial reports of key industry players
  • Historical data
  • Press releases

DATA ANALYSIS

Data Synthesis

  • Collation of data
  • Estimation of key figures
  • Analysis of derived insights

Data Validation

  • Triangulation with data models
  • Reference against proprietary databases
  • Corroboration with industry experts

REPORT WRITING

Qualitative

  • Market drivers
  • Market challenges
  • Market trends
  • Five forces analysis

Quantitative

  • Market size and forecast
  • Market segmentation
  • Geographical insights
  • Competitive landscape

Interested in this report?

Get your sample now to see our research methodology and insights!

Download Now

Frequently Asked Questions

Online Jewelry market growth will increase by USD 69679.4 million during 2026-2030.

The Online Jewelry market is expected to grow at a CAGR of 18.7% during 2026-2030.

Online Jewelry market is segmented by Type (Fine jewelry, Fashion jewelry) Product type (Rings, Earrings, Necklaces, Bangles, Others) Price range (Luxury, Premium, Mid-range, Economical)

AUrate New York, Boucheron Holding SAS, Buccellati, Bulgari S.p.A, Cartier SA, Catbird LLC, Chopard Group, Chow Sang Sang Holdings, David Yurman Enterprises LLC, Graff Diamonds Ltd., Harry Winston Inc., K. Mikimoto and Co. Ltd., Kendra Scott LLC, Mejuri Inc, Monica Vinader Ltd., Pandora Jewelry LLC, Swarovski AG, Tiffany and Co., Van Cleef and Arpels, VRAI are a few of the key vendors in the Online Jewelry market.

North America will register the highest growth rate of 39.7% among the other regions. Therefore, the Online Jewelry market in North America is expected to garner significant business opportunities for the vendors during the forecast period.

US, Canada, Mexico, Germany, UK, France, Italy, Spain, The Netherlands, China, India, Japan, South Korea, Australia, Indonesia, UAE, Saudi Arabia, South Africa, Turkey, Israel, Brazil, Argentina, Chile

  • Strong growth in digital payment adoption is the driving factor this market.

The Online Jewelry market vendors should focus on grabbing business opportunities from the Type segment as it accounted for the largest market share in the base year.
RIA - Research AI Assistant
Ask RIA