Online Premium Cosmetics Market Analysis APAC, North America, Europe, South America, Middle East and Africa - US, China, Japan, Germany, Canada - Size and Forecast 2024-2028

Online Premium Cosmetics Market Analysis APAC, North America, Europe, South America, Middle East and Africa - US, China, Japan, Germany, Canada - Size and Forecast 2024-2028

Published: Oct 2024 179 Pages SKU: IRTNTR72672

Market Overview at a Glance

$8.32 B
Market Opportunity
4.1%
CAGR
3.9
YoY growth 2023-2024(%)

Online Premium Cosmetics Market Size 2024-2028 

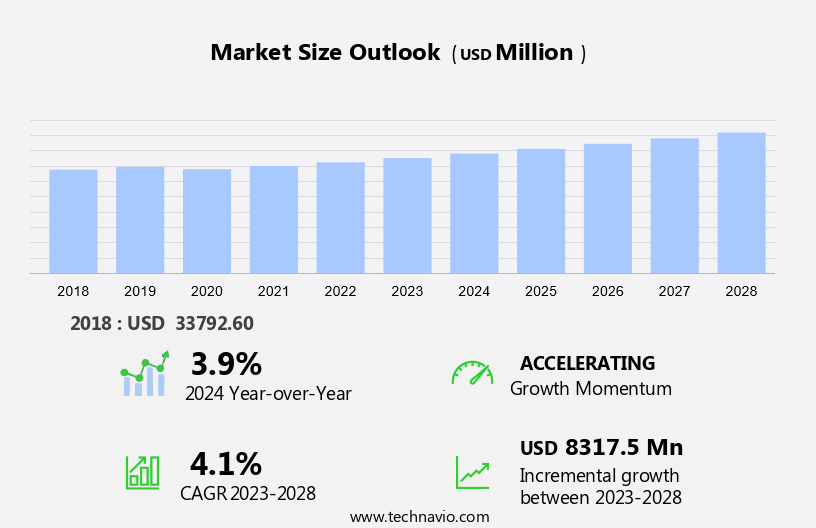
The online premium cosmetics market size is forecast to increase by USD 8.32 billion at a CAGR of 4.1% between 2023 and 2028.

  • The market is witnessing significant growth, driven by several factors in the retail landscape. The rising preference for a convenient shopping experience and duty-free purchases during international travel are key purchase drivers. The increasing trend towards natural cosmetics and cosmeceuticals, driven by health and wellness consciousness, is another growth factor. However, the high cost of premium cosmetic skincare products and luxury cosmetic products, import taxes, and value-added taxes pose challenges to market growth. Consumers seek brands that offer competitive pricing and tax-free shopping options, enhancing the overall shopping experience. Brands that can effectively navigate these challenges and provide a seamless online shopping experience are poised to succeed in this dynamic market.

What will be the Size of the Market During the Forecast Period?

Online Premium Cosmetics Market Size

 Request Free Sample

  • The travel retail industry, a segment of the market, has emerged as a significant revenue source for retailers and governments alike. This unique retail landscape caters to the needs of international travelers, offering them the opportunity to purchase a wide range of premium cosmetics products at tax-exempt prices. Travel retail outlets are strategically located in airports, international flights, railway stations, and other high-traffic transportation hubs. These outlets are regulated to ensure a consistent shopping experience for travellers, who are often exempt from taxes and customs allowances when making purchases.
  • The market in travel retail is a thriving industry, driven by several key factors. International travellers seek out these retail environments to purchase their favorite brands at competitive prices, often taking advantage of larger product sizes and exclusive travel-retail-only offerings. The shopping experience in travel retail outlets is designed to cater to the unique needs of travellers. Conveniently located in secure areas, these outlets offer a wide range of premium cosmetics brands, making it an attractive destination for consumers. The tax-exempt status of these purchases is a significant draw, as value-added taxes and import duties can add a substantial cost to cosmetics purchases in other retail environments.

How is this market segmented and which is the largest segment?

The market research report provides comprehensive data (region-wise segment analysis), with forecasts and estimates in "USD million" for the period 2024-2028, as well as historical data from 2018-2022 for the following segments.
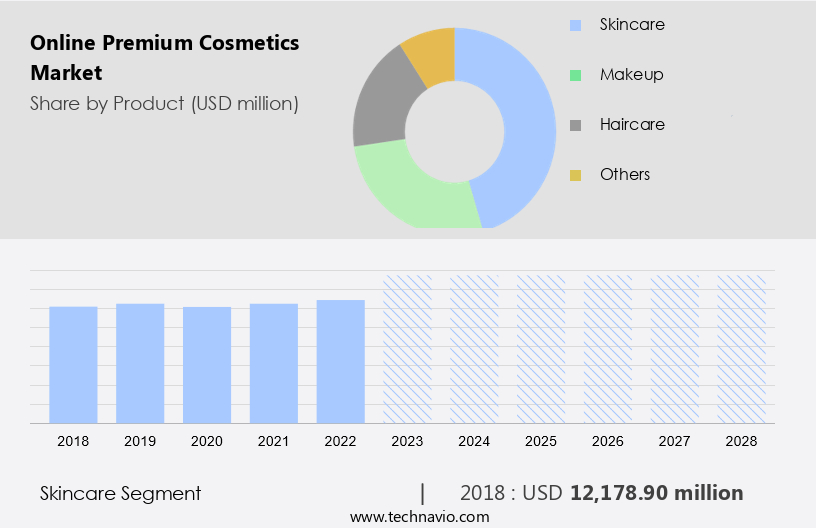
  • Product
    • Skincare
    • Makeup
    • Haircare
    • Others
  • End-user
    • Women
    • Men
  • Geography
    • APAC
      • China
      • Japan
    • North America
      • Canada
      • US
    • Europe
      • Germany
    • South America
    • Middle East and Africa

By Product Insights

  • The skincare segment is estimated to witness significant growth during the forecast period.

Online premium cosmetics, including skincare products, have witnessed significant growth in demand due to their effectiveness in addressing various skin concerns. These products, which encompass topical creams, lotions, toners, exfoliators, and serums, cater to anti-aging, skin-whitening, sun protection, and general skin hydration needs. Airport shops and duty-free stores have become popular destinations for travelers to purchase these merchandise, as they offer the added advantage of EU regulations allowing duty-refunds on luxury goods such as perfume, liquor, chocolate, and skincare items. The popularity of these products can be attributed to their ability to protect, hydrate, fight wrinkles, tighten, and replenish skin, resulting in a radiant and healthy appearance. Moreover, the aging population and advancements in skincare product technology have further fueled market growth.

Online Premium Cosmetics Market Size

Get a glance at the market report of share of various segments Request Free Sample

The skincare segment was valued at USD 12.18 billion in 2018 and showed a gradual increase during the forecast period.

Regional Analysis

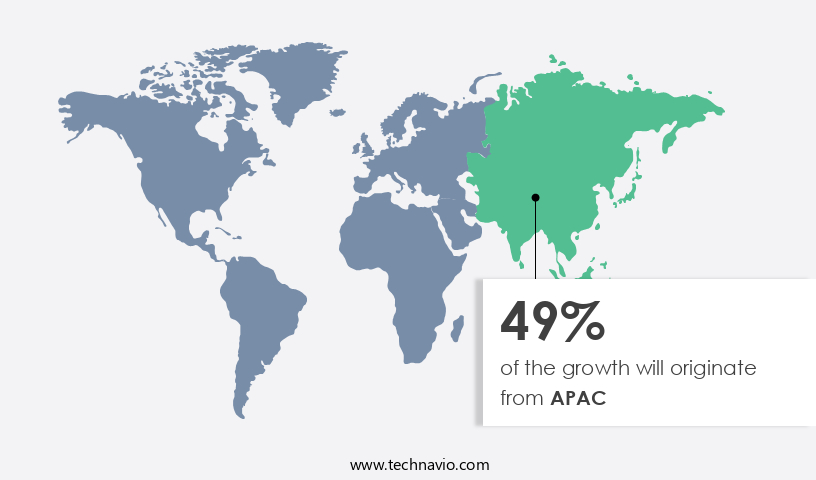
  • APAC is estimated to contribute 49% to the growth of the global market during the forecast period.

Technavio's analysts have elaborately explained the regional trends and drivers that shape the market during the forecast period.

Online Premium Cosmetics Market Share by Geography

For more insights on the market share of various regions Request Free Sample

The market in Asia Pacific (APAC) held a substantial market share in 2023. Key product categories in this region include skincare, hair care, sun care, deodorants, and fragrances. The expansion of the online shopping industry, facilitated by the Internet and advanced technology, has significantly boosted the growth of the APAC market over the last decade. Urbanization, the proliferation of smartphones and the Internet, a large population, and escalating demand for personal grooming products among male and female consumers are major factors fueling the market's growth in APAC during the forecast period. Despite the growth, there are certain limitations and special exemptions to consider.

For instance, airlines may impose baggage cost restrictions, which could impact the purchasing power of consumers. Furthermore, exchange rates and travel insurance policies can also influence the affordability of online premium cosmetics for international customers. Nevertheless, the increasing popularity of online shopping and the convenience it offers are expected to continue driving the market in APAC.

Market Dynamics

Our researchers analyzed the data with 2023 as the base year, along with the key drivers, trends, and challenges. A holistic analysis of drivers will help companies refine their marketing strategies to gain a competitive advantage.

What are the key market drivers leading to the rise in the adoption of the Online Premium Cosmetics Market?

The rise in the aging population is the key driver of the market.

  • In the global industry of premium cosmetics, the duty-free market within travel retail continues to expand. International travellers, seeking exempt-from-tax purchases, contribute significantly to retail sales in this sector. The aging population, a demographic trend, fuels the demand for anti-aging products. Skin, as we age, undergoes changes, becoming thinner and losing fat, firmness, and texture.
  • Visible veins, prolonged sun exposure resulting in wrinkles, dryness, and age spots, and health issues such as diabetes and kidney diseases can cause dry skin. In a regulated retail environment, airports serve as key distribution channels for these premium cosmetics, catering to travelers' needs in a balanced and great shopping experience.

What are the market trends shaping the Online Premium Cosmetics Market?

Growing preference for organic cosmetics and cosmeceuticals is the upcoming trend in the market.

  • The market is experiencing a significant shift in consumer preferences towards organic and chemical-free options. These products, also known as cosmeceuticals, offer a shopping experience that appeals to health-conscious consumers. The retail landscape is evolving as duty-free shopping and international travel has become key purchase drivers. Consumers are increasingly aware of the potential health risks associated with certain chemicals, such as parabens and phthalates, which are commonly found in chemical-based cosmetics. These compounds have been linked to various health issues, including cancer and diabetes.
  • In response, the cosmetics industry is turning to natural raw materials, such as neem extracts, soybean, fish oil, aloe vera, and guar gum, to manufacture organic skincare products. Value-added tax and import taxes are also factors influencing the purchasing decision, making duty-free shopping an attractive option for consumers. Overall, the trend towards organic and chemical-free cosmetics is expected to continue, driven by consumer demand for safer and more effective skincare solutions.

What challenges does the Online Premium Cosmetics Market face during its growth?

The high cost of cosmetic skincare products is a key challenge affecting the market growth.

  • Premium online cosmetics, including anti-aging skincare products like creams and serums, carry a higher price tag due to various factors. The use of costly ingredients, such as diamonds, gold, caviar, saffron, rose, and jasmine essential oils, contributes significantly to the expense. Additionally, packaging and advertising costs are incorporated into the final product price. Companies continue to innovate and invest in developing advanced, efficient, and safe cosmetics and skincare solutions.
  • These products often include expensive components like antioxidants, peptides, and retinol, which are essential for addressing fine lines and wrinkles. International travelers, such as diplomatic and military personnel, can purchase these premium cosmetics duty-free at arrivals. This non-aeronautical income serves as a significant revenue source for airports and railway stations. Taxes and duties levied on these sales contribute to the overall revenue of governments.

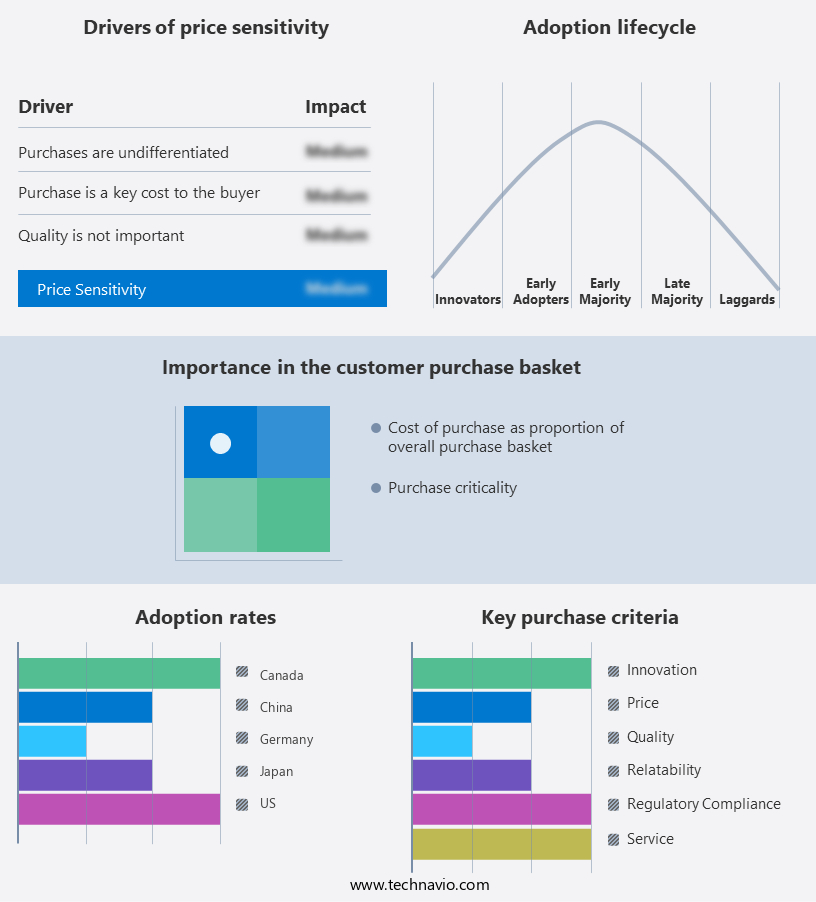
Exclusive Customer Landscape

The market forecasting report includes the adoption lifecycle of the market, covering from the innovator's stage to the laggard's stage. It focuses on adoption rates in different regions based on penetration. Furthermore, the market report also includes key purchase criteria and drivers of price sensitivity to help companies evaluate and develop their market growth analysis strategies.

Online Premium Cosmetics Market Share by Geography

 Customer Landscape

Key Companies & Market Insights

Companies are implementing various strategies, such as strategic alliances, market forecast, partnerships, mergers and acquisitions, geographical expansion, and product/service launches, to enhance their presence in the market. The market research and growth report includes detailed analyses of the competitive landscape of the market and information about key companies, including:

  • Amorepacific Corp.
  • Avon Products Inc.
  • Chanel Ltd.
  • Clarins Pte Ltd.
  • Dambiro de
  • Hermes International SA
  • Johnson and Johnson Services Inc.
  • Kao Corp.
  • Kose Corp.
  • LOccitane Groupe SA
  • LOreal SA
  • LVMH Moet Hennessy Louis Vuitton SE
  • Manash E-Commerce Pvt. Ltd.
  • Oriflame Cosmetics S.A.
  • PUIG S.L.
  • Revlon Inc.
  • Shiseido Co. Ltd.
  • The Estee Lauder Co. Inc.
  • The Procter and Gamble Co.
  • Unilever PLC

Qualitative and quantitative analysis of companies has been conducted to help clients understand the wider business environment as well as the strengths and weaknesses of key market players. Data is qualitatively analyzed to categorize companies as pure play, category-focused, industry-focused, and diversified; it is quantitatively analyzed to categorize companies as dominant, leading, strong, tentative, and weak.

Research Analyst Overview

The global duty-free industry, a significant segment of the travel retail market, caters to international travellers seeking exempted merchandise from taxes and customs allowances. This regulated retail environment primarily operates in airports, international flights, railway stations, and other travel hubs. Duty-free stores offer a wide range of merchandise, including liquor, chocolate, perfume, and cosmetics, at high-markup prices. International travellers are the primary purchasers in this sector, benefiting from special exemptions and limitations on customs laws. The shopping experience in duty-free stores is unique, with an emphasis on luxury goods and impulsive buying. Duty-free sales contribute significantly to the non-aeronautical income of airports and airlines.

European Union regulations govern the duty-refund process for travellers, allowing them to claim back Value-Added Tax (VAT) on purchases above a certain threshold. Duty-free shops also offer special exemptions for diplomatic personnel, military personnel, and cruise lines. The retail landscape of duty-free stores is diverse, with an emphasis on tax-free shopping and a wide range of merchandise. Consumer goods such as alcohol, cigarettes, food, and cosmetics are popular purchases. However, there are food restrictions and travel limitations for certain items, such as tobacco and liquor. Baggage costs, exchange rates, and travel insurance are essential considerations for international travellers when making purchases in duty-free stores. The duty-free industry continues to evolve, with innovations such as crypto-asset exchange and special offers for arrivals duty-free.

Market Scope

Report Coverage

Details

Page number

179

Base year

2023

Historic period

2018-2022

Forecast period

2024-2028

Growth momentum & CAGR

Accelerate at a CAGR of 4.1%

Market Growth 2024-2028

USD 8.32 billion

Market structure

Fragmented

YoY growth 2023-2024(%)

3.9

Key countries

US, China, Japan, Germany, and Canada

Competitive landscape

Leading Companies, Market Positioning of Companies, Competitive Strategies, and Industry Risks

Request Free Sample

What are the Key Data Covered in this Market Research and Growth Report?

  • CAGR of the market during the forecast period
  • Detailed information on factors that will drive the market growth and forecasting between 2024 and 2028
  • Precise estimation of the size of the market  and its contribution of the market in focus to the parent market
  • Accurate predictions about upcoming market growth and trends and changes in consumer behaviour
  • Growth of the market across APAC, North America, Europe, South America, and Middle East and Africa
  • Thorough analysis of the market's competitive landscape and detailed information about companies
  • Comprehensive analysis of factors that will challenge the growth of market companies

We can help! Our analysts can customize this market research report to meet your requirements. Get in touch

1 Executive Summary

  • 1.1 Market overview
    • Executive Summary - Chart on Market Overview
    • Executive Summary - Data Table on Market Overview
    • Executive Summary - Chart on Global Market Characteristics
    • Executive Summary - Chart on Market by Geography
    • Executive Summary - Chart on Market Segmentation by Product
    • Executive Summary - Chart on Market Segmentation by End-user
    • Executive Summary - Chart on Incremental Growth
    • Executive Summary - Data Table on Incremental Growth
    • Executive Summary - Chart on Company Market Positioning

2 Market Landscape

  • 2.1 Market ecosystem
    • Parent Market
    • Data Table on - Parent Market
  • 2.2 Market characteristics
    • Market characteristics analysis
  • 2.3 Value chain analysis
    • Value Chain Analysis

3 Market Sizing

  • 3.1 Market definition
    • Offerings of companies included in the market definition
  • 3.2 Market segment analysis
    • Market segments
  • 3.3 Market size 2023
    • 3.4 Market outlook: Forecast for 2023-2028
      • Chart on Global - Market size and forecast 2023-2028 ($ million)
      • Data Table on Global - Market size and forecast 2023-2028 ($ million)
      • Chart on Global Market: Year-over-year growth 2023-2028 (%)
      • Data Table on Global Market: Year-over-year growth 2023-2028 (%)

    4 Historic Market Size

    • 4.1 Global Online Premium Cosmetics Market 2018 - 2022
      • Historic Market Size - Data Table on Global Online Premium Cosmetics Market 2018 - 2022 ($ million)
    • 4.2 Product segment analysis 2018 - 2022
      • Historic Market Size - Product Segment 2018 - 2022 ($ million)
    • 4.3 End-user segment analysis 2018 - 2022
      • Historic Market Size - End-user Segment 2018 - 2022 ($ million)
    • 4.4 Geography segment analysis 2018 - 2022
      • Historic Market Size - Geography Segment 2018 - 2022 ($ million)
    • 4.5 Country segment analysis 2018 - 2022
      • Historic Market Size - Country Segment 2018 - 2022 ($ million)

    5 Five Forces Analysis

    • 5.1 Five forces summary
      • Five forces analysis - Comparison between 2023 and 2028
    • 5.2 Bargaining power of buyers
      • Bargaining power of buyers - Impact of key factors 2023 and 2028
    • 5.3 Bargaining power of suppliers
      • Bargaining power of suppliers - Impact of key factors in 2023 and 2028
    • 5.4 Threat of new entrants
      • Threat of new entrants - Impact of key factors in 2023 and 2028
    • 5.5 Threat of substitutes
      • Threat of substitutes - Impact of key factors in 2023 and 2028
    • 5.6 Threat of rivalry
      • Threat of rivalry - Impact of key factors in 2023 and 2028
    • 5.7 Market condition
      • Chart on Market condition - Five forces 2023 and 2028

    6 Market Segmentation by Product

    • 6.1 Market segments
      • Chart on Product - Market share 2023-2028 (%)
      • Data Table on Product - Market share 2023-2028 (%)
    • 6.2 Comparison by Product
      • Chart on Comparison by Product
      • Data Table on Comparison by Product
    • 6.3 Skincare - Market size and forecast 2023-2028
      • Chart on Skincare - Market size and forecast 2023-2028 ($ million)
      • Data Table on Skincare - Market size and forecast 2023-2028 ($ million)
      • Chart on Skincare - Year-over-year growth 2023-2028 (%)
      • Data Table on Skincare - Year-over-year growth 2023-2028 (%)
    • 6.4 Makeup - Market size and forecast 2023-2028
      • Chart on Makeup - Market size and forecast 2023-2028 ($ million)
      • Data Table on Makeup - Market size and forecast 2023-2028 ($ million)
      • Chart on Makeup - Year-over-year growth 2023-2028 (%)
      • Data Table on Makeup - Year-over-year growth 2023-2028 (%)
    • 6.5 Haircare - Market size and forecast 2023-2028
      • Chart on Haircare - Market size and forecast 2023-2028 ($ million)
      • Data Table on Haircare - Market size and forecast 2023-2028 ($ million)
      • Chart on Haircare - Year-over-year growth 2023-2028 (%)
      • Data Table on Haircare - Year-over-year growth 2023-2028 (%)
    • 6.6 Others - Market size and forecast 2023-2028
      • Chart on Others - Market size and forecast 2023-2028 ($ million)
      • Data Table on Others - Market size and forecast 2023-2028 ($ million)
      • Chart on Others - Year-over-year growth 2023-2028 (%)
      • Data Table on Others - Year-over-year growth 2023-2028 (%)
    • 6.7 Market opportunity by Product
      • Market opportunity by Product ($ million)
      • Data Table on Market opportunity by Product ($ million)

    7 Market Segmentation by End-user

    • 7.1 Market segments
      • Chart on End-user - Market share 2023-2028 (%)
      • Data Table on End-user - Market share 2023-2028 (%)
    • 7.2 Comparison by End-user
      • Chart on Comparison by End-user
      • Data Table on Comparison by End-user
    • 7.3 Women - Market size and forecast 2023-2028
      • Chart on Women - Market size and forecast 2023-2028 ($ million)
      • Data Table on Women - Market size and forecast 2023-2028 ($ million)
      • Chart on Women - Year-over-year growth 2023-2028 (%)
      • Data Table on Women - Year-over-year growth 2023-2028 (%)
    • 7.4 Men - Market size and forecast 2023-2028
      • Chart on Men - Market size and forecast 2023-2028 ($ million)
      • Data Table on Men - Market size and forecast 2023-2028 ($ million)
      • Chart on Men - Year-over-year growth 2023-2028 (%)
      • Data Table on Men - Year-over-year growth 2023-2028 (%)
    • 7.5 Market opportunity by End-user
      • Market opportunity by End-user ($ million)
      • Data Table on Market opportunity by End-user ($ million)

    8 Customer Landscape

    • 8.1 Customer landscape overview
      • Analysis of price sensitivity, lifecycle, customer purchase basket, adoption rates, and purchase criteria

    9 Geographic Landscape

    • 9.1 Geographic segmentation
      • Chart on Market share by geography 2023-2028 (%)
      • Data Table on Market share by geography 2023-2028 (%)
    • 9.2 Geographic comparison
      • Chart on Geographic comparison
      • Data Table on Geographic comparison
    • 9.3 APAC - Market size and forecast 2023-2028
      • Chart on APAC - Market size and forecast 2023-2028 ($ million)
      • Data Table on APAC - Market size and forecast 2023-2028 ($ million)
      • Chart on APAC - Year-over-year growth 2023-2028 (%)
      • Data Table on APAC - Year-over-year growth 2023-2028 (%)
    • 9.4 North America - Market size and forecast 2023-2028
      • Chart on North America - Market size and forecast 2023-2028 ($ million)
      • Data Table on North America - Market size and forecast 2023-2028 ($ million)
      • Chart on North America - Year-over-year growth 2023-2028 (%)
      • Data Table on North America - Year-over-year growth 2023-2028 (%)
    • 9.5 Europe - Market size and forecast 2023-2028
      • Chart on Europe - Market size and forecast 2023-2028 ($ million)
      • Data Table on Europe - Market size and forecast 2023-2028 ($ million)
      • Chart on Europe - Year-over-year growth 2023-2028 (%)
      • Data Table on Europe - Year-over-year growth 2023-2028 (%)
    • 9.6 South America - Market size and forecast 2023-2028
      • Chart on South America - Market size and forecast 2023-2028 ($ million)
      • Data Table on South America - Market size and forecast 2023-2028 ($ million)
      • Chart on South America - Year-over-year growth 2023-2028 (%)
      • Data Table on South America - Year-over-year growth 2023-2028 (%)
    • 9.7 Middle East and Africa - Market size and forecast 2023-2028
      • Chart on Middle East and Africa - Market size and forecast 2023-2028 ($ million)
      • Data Table on Middle East and Africa - Market size and forecast 2023-2028 ($ million)
      • Chart on Middle East and Africa - Year-over-year growth 2023-2028 (%)
      • Data Table on Middle East and Africa - Year-over-year growth 2023-2028 (%)
    • 9.8 US - Market size and forecast 2023-2028
      • Chart on US - Market size and forecast 2023-2028 ($ million)
      • Data Table on US - Market size and forecast 2023-2028 ($ million)
      • Chart on US - Year-over-year growth 2023-2028 (%)
      • Data Table on US - Year-over-year growth 2023-2028 (%)
    • 9.9 China - Market size and forecast 2023-2028
      • Chart on China - Market size and forecast 2023-2028 ($ million)
      • Data Table on China - Market size and forecast 2023-2028 ($ million)
      • Chart on China - Year-over-year growth 2023-2028 (%)
      • Data Table on China - Year-over-year growth 2023-2028 (%)
    • 9.10 Japan - Market size and forecast 2023-2028
      • Chart on Japan - Market size and forecast 2023-2028 ($ million)
      • Data Table on Japan - Market size and forecast 2023-2028 ($ million)
      • Chart on Japan - Year-over-year growth 2023-2028 (%)
      • Data Table on Japan - Year-over-year growth 2023-2028 (%)
    • 9.11 Germany - Market size and forecast 2023-2028
      • Chart on Germany - Market size and forecast 2023-2028 ($ million)
      • Data Table on Germany - Market size and forecast 2023-2028 ($ million)
      • Chart on Germany - Year-over-year growth 2023-2028 (%)
      • Data Table on Germany - Year-over-year growth 2023-2028 (%)
    • 9.12 Canada - Market size and forecast 2023-2028
      • Chart on Canada - Market size and forecast 2023-2028 ($ million)
      • Data Table on Canada - Market size and forecast 2023-2028 ($ million)
      • Chart on Canada - Year-over-year growth 2023-2028 (%)
      • Data Table on Canada - Year-over-year growth 2023-2028 (%)
    • 9.13 Market opportunity by geography
      • Market opportunity by geography ($ million)
      • Data Tables on Market opportunity by geography ($ million)

    10 Drivers, Challenges, and Opportunity/Restraints

    • 10.1 Market drivers
      • 10.2 Market challenges
        • 10.3 Impact of drivers and challenges
          • Impact of drivers and challenges in 2023 and 2028
        • 10.4 Market opportunities/restraints

          11 Competitive Landscape

          • 11.1 Overview
            • 11.2 Competitive Landscape
              • Overview on criticality of inputs and factors of differentiation
            • 11.3 Landscape disruption
              • Overview on factors of disruption
            • 11.4 Industry risks
              • Impact of key risks on business

            12 Competitive Analysis

            • 12.1 Companies profiled
              • Companies covered
            • 12.2 Market positioning of companies
              • Matrix on companies position and classification
            • 12.3 Chanel Ltd.
              • Chanel Ltd. - Overview
              • Chanel Ltd. - Product / Service
              • Chanel Ltd. - Key offerings
            • 12.4 Clarins Pte Ltd.
              • Clarins Pte Ltd. - Overview
              • Clarins Pte Ltd. - Product / Service
              • Clarins Pte Ltd. - Key offerings
            • 12.5 Dambiro de
              • Dambiro de - Overview
              • Dambiro de - Product / Service
              • Dambiro de - Key offerings
            • 12.6 Hermes International SA
              • Hermes International SA - Overview
              • Hermes International SA - Business segments
              • Hermes International SA - Key news
              • Hermes International SA - Key offerings
              • Hermes International SA - Segment focus
            • 12.7 Kao Corp.
              • Kao Corp. - Overview
              • Kao Corp. - Business segments
              • Kao Corp. - Key news
              • Kao Corp. - Key offerings
              • Kao Corp. - Segment focus
            • 12.8 Kose Corp.
              • Kose Corp. - Overview
              • Kose Corp. - Product / Service
              • Kose Corp. - Key offerings
            • 12.9 LOreal SA
              • LOreal SA - Overview
              • LOreal SA - Business segments
              • LOreal SA - Key news
              • LOreal SA - Key offerings
              • LOreal SA - Segment focus
            • 12.10 LVMH Moet Hennessy Louis Vuitton SE
              • LVMH Moet Hennessy Louis Vuitton SE - Overview
              • LVMH Moet Hennessy Louis Vuitton SE - Business segments
              • LVMH Moet Hennessy Louis Vuitton SE - Key news
              • LVMH Moet Hennessy Louis Vuitton SE - Key offerings
              • LVMH Moet Hennessy Louis Vuitton SE - Segment focus
            • 12.11 Oriflame Cosmetics S.A.
              • Oriflame Cosmetics S.A. - Overview
              • Oriflame Cosmetics S.A. - Product / Service
              • Oriflame Cosmetics S.A. - Key offerings
            • 12.12 PUIG S.L.
              • PUIG S.L. - Overview
              • PUIG S.L. - Product / Service
              • PUIG S.L. - Key offerings
            • 12.13 Revlon Inc.
              • Revlon Inc. - Overview
              • Revlon Inc. - Business segments
              • Revlon Inc. - Key offerings
              • Revlon Inc. - Segment focus
            • 12.14 Shiseido Co. Ltd.
              • Shiseido Co. Ltd. - Overview
              • Shiseido Co. Ltd. - Product / Service
              • Shiseido Co. Ltd. - Key news
              • Shiseido Co. Ltd. - Key offerings
            • 12.15 The Estee Lauder Co. Inc.
              • The Estee Lauder Co. Inc. - Overview
              • The Estee Lauder Co. Inc. - Product / Service
              • The Estee Lauder Co. Inc. - Key news
              • The Estee Lauder Co. Inc. - Key offerings
            • 12.16 The Procter and Gamble Co.
              • The Procter and Gamble Co. - Overview
              • The Procter and Gamble Co. - Business segments
              • The Procter and Gamble Co. - Key news
              • The Procter and Gamble Co. - Key offerings
              • The Procter and Gamble Co. - Segment focus
            • 12.17 Unilever PLC
              • Unilever PLC - Overview
              • Unilever PLC - Business segments
              • Unilever PLC - Key offerings
              • Unilever PLC - Segment focus

            13 Appendix

            • 13.1 Scope of the report
              • 13.2 Inclusions and exclusions checklist
                • Inclusions checklist
                • Exclusions checklist
              • 13.3 Currency conversion rates for US$
                • Currency conversion rates for US$
              • 13.4 Research methodology
                • Research methodology
              • 13.5 Data procurement
                • Information sources
              • 13.6 Data validation
                • Data validation
              • 13.7 Validation techniques employed for market sizing
                • Validation techniques employed for market sizing
              • 13.8 Data synthesis
                • Data synthesis
              • 13.9 360 degree market analysis
                • 360 degree market analysis
              • 13.10 List of abbreviations
                • List of abbreviations

              Research Methodology

              Technavio presents a detailed picture of the market by way of study, synthesis, and summation of data from multiple sources. The analysts have presented the various facets of the market with a particular focus on identifying the key industry influencers. The data thus presented is comprehensive, reliable, and the result of extensive research, both primary and secondary.

              INFORMATION SOURCES

              Primary sources

              • Manufacturers and suppliers
              • Channel partners
              • Industry experts
              • Strategic decision makers

              Secondary sources

              • Industry journals and periodicals
              • Government data
              • Financial reports of key industry players
              • Historical data
              • Press releases

              DATA ANALYSIS

              Data Synthesis

              • Collation of data
              • Estimation of key figures
              • Analysis of derived insights

              Data Validation

              • Triangulation with data models
              • Reference against proprietary databases
              • Corroboration with industry experts

              REPORT WRITING

              Qualitative

              • Market drivers
              • Market challenges
              • Market trends
              • Five forces analysis

              Quantitative

              • Market size and forecast
              • Market segmentation
              • Geographical insights
              • Competitive landscape

              Interested in this report?

              Get your sample now to see our research methodology and insights!

              Download Now

              Frequently Asked Questions

              Online Premium Cosmetics market growth will increase by $ 8317.5 mn during 2024-2028.

              The Online Premium Cosmetics market is expected to grow at a CAGR of 4.1% during 2024-2028.

              Online Premium Cosmetics market is segmented by Product( Skincare, Makeup, Haircare, Others) End-user( Women, Men, Europe, South America, Middle East and Africa)

              Amorepacific Corp., Avon Products Inc., Chanel Ltd., Clarins Pte Ltd., Dambiro de, Hermes International SA, Johnson and Johnson Services Inc., Kao Corp., Kose Corp., LOccitane Groupe SA, LOreal SA, LVMH Moet Hennessy Louis Vuitton SE, Manash E-Commerce Pvt. Ltd., Oriflame Cosmetics S.A., PUIG S.L., Revlon Inc., Shiseido Co. Ltd., The Estee Lauder Co. Inc., The Procter and Gamble Co., Unilever PLC are a few of the key vendors in the Online Premium Cosmetics market.

              APAC will register the highest growth rate of 49% among the other regions. Therefore, the Online Premium Cosmetics market in APAC is expected to garner significant business opportunities for the vendors during the forecast period.

              US, China, Japan, Germany, Canada

              • Rise in aging populationThe skin undergoes severe changes with age. Globally is the driving factor this market.
              • the aging population (men and women) is growing significantly. Anti-aging products are gaining popularity is the driving factor this market.
              • owing to a rise in the aging population globally. The skin becomes thinner and loses fat is the driving factor this market.
              • firmness is the driving factor this market.
              • and texture with aging. The veins become more visible is the driving factor this market.
              • and scratches is the driving factor this market.
              • cuts is the driving factor this market.
              • or bumps can take a long time to heal. Prolonged exposure to the sun can lead to wrinkles is the driving factor this market.
              • dryness is the driving factor this market.
              • and age spots on the skin. Some of the possible causes of dry skin are smoking is the driving factor this market.
              • feeling stressed is the driving factor this market.
              • sweating profusely is the driving factor this market.
              • and exposure to dry air. Dry skin can also be caused by health problems is the driving factor this market.
              • such as diabetes and several kidney diseases.Cosmetics that offer anti-aging properties are gaining popularity among end-users. These cosmetics are formulated using various substances is the driving factor this market.
              • such as resveratrol and carotenes. Resveratrol is found in grape seed extracts. Its natural antioxidant properties prevent the skin from premature aging. Antioxidants are specially prepared to provide essential nutrients to the skin. Carotenes fight against the signs of aging and play a significant role in halting visible signs of aging. Therefore is the driving factor this market.
              • the increasing aging population and the need to prevent the signs of aging among end-users are expected to increase the demand for anti-aging cosmetic products is the driving factor this market.
              • which is the driving factor this market.
              • in turn is the driving factor this market.
              • will drive the growth of the global online premium cosmetics market during the forecast period. is the driving factor this market.

              The Online Premium Cosmetics market vendors should focus on grabbing business opportunities from the Skincare segment as it accounted for the largest market share in the base year.
              RIA - Research AI Assistant
              Ask RIA