
US Online Recruitment Market Size 2026-2030
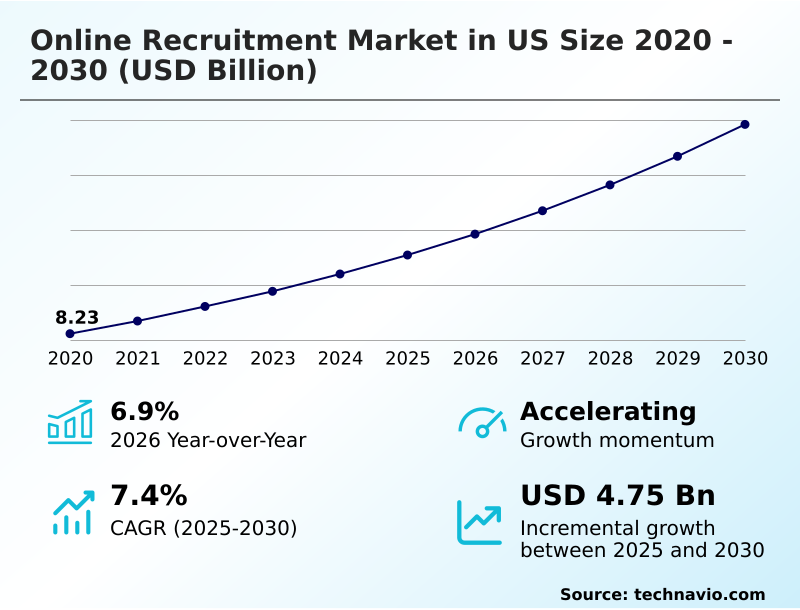
The us online recruitment market size is valued to increase by USD 4.75 billion, at a CAGR of 7.4% from 2025 to 2030. AI adoption accelerating faster candidate sourcing efficiency will drive the us online recruitment market.
Major Market Trends & Insights
- By Application - Hospitality segment was valued at USD 2.52 billion in 2024
- By End-user - Employers segment accounted for the largest market revenue share in 2024
Market Size & Forecast
- Market Opportunities: USD 7.61 billion
- Market Future Opportunities: USD 4.75 billion
- CAGR from 2025 to 2030 : 7.4%
Market Summary
- The online recruitment market in US is evolving from a transactional model to a strategic, technology-driven function. Central to this shift is the widespread adoption of AI-powered matching and sourcing automation, which are becoming standard in modern talent acquisition funnels. These advancements are driven by the need for greater efficiency in a competitive labor environment.
- Key trends include the integration of predictive analytics to forecast hiring needs and the rise of mobile-first recruitment platforms that enhance candidate engagement. However, the market faces challenges related to data privacy and the operational disruption caused by candidate ghosting.
- For instance, a large retail enterprise may leverage an integrated platform with automated screening and mobile application features to manage high-volume seasonal hiring. This approach not only accelerates the hiring workflow but also improves the candidate experience, ultimately reducing time-to-hire and enhancing the quality of talent pipelines.
- This focus on creating a seamless, intelligent hiring process defines the current trajectory of the market.
What will be the Size of the US Online Recruitment Market during the forecast period?
Get Key Insights on Market Forecast (PDF) Get Free Sample
How is the US Online Recruitment Market Segmented?
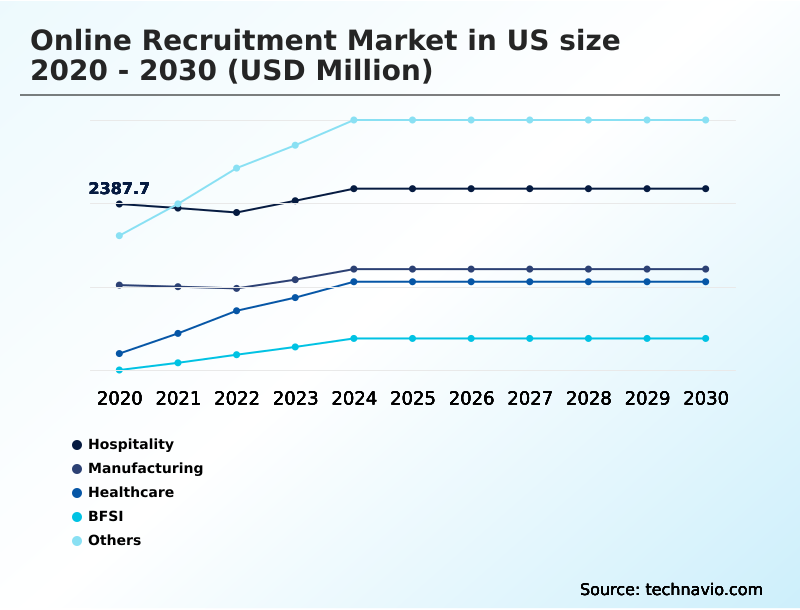
The us online recruitment industry research report provides comprehensive data (region-wise segment analysis), with forecasts and estimates in "USD million" for the period 2026-2030, as well as historical data from 2020-2024 for the following segments.
- Application
- Hospitality
- Manufacturing
- Healthcare
- BFSI
- Others
- End-user
- Employers
- Non-employers
- Platform
- Web-based
- Mobile-based
- Geography
- North America
- US
- North America
By Application Insights
The hospitality segment is estimated to witness significant growth during the forecast period.
The hospitality segment is undergoing a significant transformation, driven by its reliance on high-volume hiring. To manage this, firms are adopting mobile-first recruitment platforms and automated sourcing to streamline hiring workflows.
These technologies are crucial on hourly worker recruitment platforms, where mobile job application optimization is key to capturing talent.
The focus is shifting from simply filling vacancies to improving the overall candidate experience and creating a positive employer brand to build a resilient workforce. By optimizing applicant funnels with efficient applicant tracking systems, organizations are improving time-to-hire metrics.
This strategic shift is underscored by data indicating 66% of hiring managers plan to increase headcount, necessitating more scalable and efficient digital solutions.
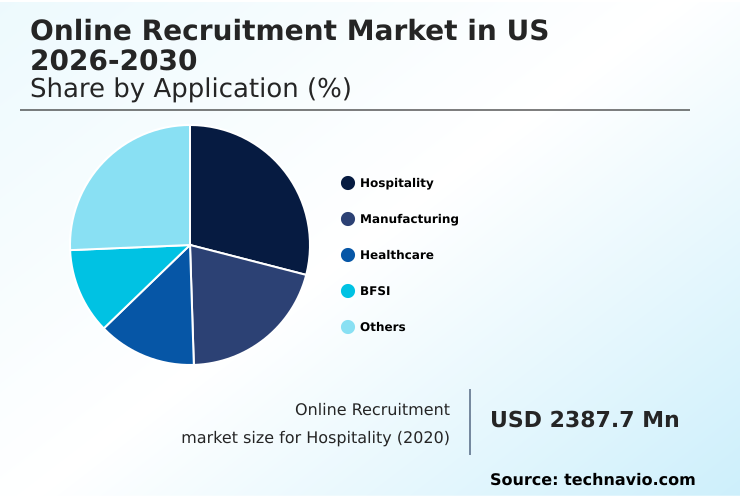
The Hospitality segment was valued at USD 2.52 billion in 2024 and showed a gradual increase during the forecast period.
Market Dynamics
Our researchers analyzed the data with 2025 as the base year, along with the key drivers, trends, and challenges. A holistic analysis of drivers will help companies refine their marketing strategies to gain a competitive advantage.
- The strategic implementation of digital tools is reshaping hiring outcomes across the US. A primary focus is on using AI to reduce time-to-hire, with platforms that automate repetitive tasks seeing a nearly twofold increase in recruiter productivity compared to manual methods.
- This is particularly relevant for high-volume sectors, where mobile recruitment for hourly retail jobs has become essential for reaching candidates. The optimization of job ads for mobile applications is a critical component of this strategy. Beyond active applicants, organizations are using the best tools for sourcing passive candidates to build robust talent pipelines.
- The market is also adapting to new employment structures, with dedicated platforms for hybrid work model hiring and tools for managing freelance talent through marketplaces gaining prominence. Central to this evolution is the critical task of ensuring data privacy in recruitment software, which requires robust security protocols.
- Furthermore, companies are actively exploring strategies for reducing candidate ghosting through better engagement and communication. A key technical priority involves integrating ATS with existing HRIS systems to create a unified and efficient talent management ecosystem that supports advanced functions like implementing skills-based hiring assessments.
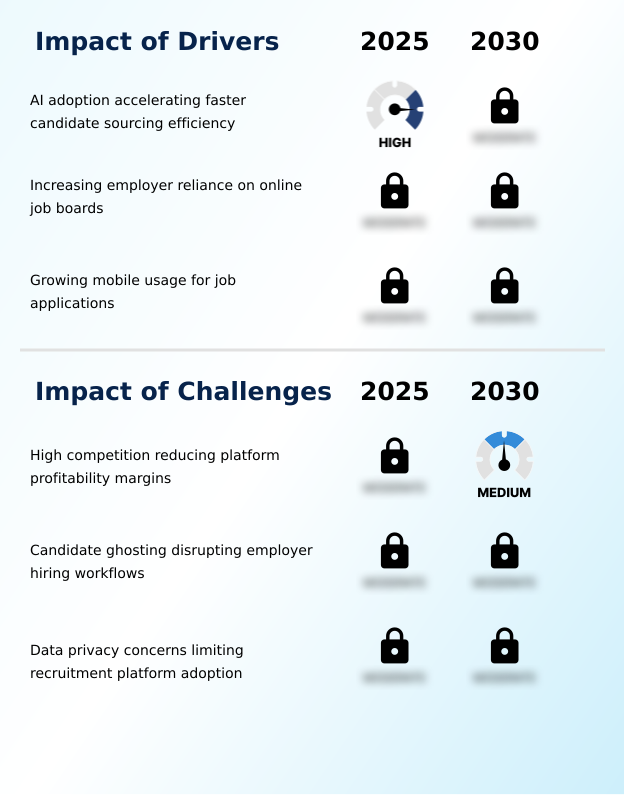
What are the key market drivers leading to the rise in the adoption of US Online Recruitment Industry?
- The acceleration of candidate sourcing efficiency, driven by widespread AI adoption, is a key driver for market growth.
- The adoption of AI for recruitment platforms is a primary market driver, significantly accelerating the talent acquisition funnel.
- Technologies like AI-powered matching and sourcing automation are transforming how companies find candidates, with some firms receiving responses in as little as three minutes through mobile channels.
- This is complemented by programmatic job advertising, which optimizes ad spend across multiple channels. The rise of virtual recruiting is improving digital candidate experience by offering flexibility.
- Employers utilize automated candidate sourcing tools for sourcing passive candidates effectively, moving beyond just active job seekers.
- This focus on proactive candidate engagement ensures a steady flow of qualified talent, with data showing a 31% surge in job seeker interest, highlighting the need for efficient digital platforms.
What are the market trends shaping the US Online Recruitment Industry?
- The rising integration of predictive analytics tools represents a significant upcoming market trend. These tools are increasingly being adopted to forecast hiring needs and improve candidate selection accuracy.
- The market is evolving toward comprehensive career ecosystems, moving beyond transactional hiring. The integration of predictive hiring analytics software is central to this shift, enabling data-driven workforce planning and talent rediscovery from existing databases.
- This trend is amplified by the permanence of hybrid work models, which demand remote work recruitment tools that can handle credential verification and skills validation at scale. Advanced platforms now host dynamic talent profiles that give a holistic view of a candidate’s capabilities.
- This evolution allows for improved talent intelligence for retention, as organizations can better match internal and external candidates to roles. Furthermore, the use of compliant hiring technologies is becoming standard, with platforms embedding fairness checks to meet regulatory requirements.
What challenges does the US Online Recruitment Industry face during its growth?
- High competition among platforms, which reduces profitability margins, poses a key challenge to industry growth.
- Intense competition and operational hurdles define the market's challenges. Candidate ghosting, for instance, disrupts hiring, prompting investment in candidate ghosting reduction strategies and better candidate relationship management tools. Integrating disparate systems remains a technical barrier, making ATS integration best practices a critical focus for achieving seamless workflows.
- Platforms must also enhance recruitment marketing efforts to differentiate themselves in a crowded field. The need for fair and effective digital screening is paramount, leading to the adoption of asynchronous interviews to manage high applicant volumes. These challenges pressure companies to refine their employer branding, improve diversity and inclusion sourcing, and build robust talent pipelines.
- Success is increasingly tied to measuring recruitment kpis effectively to demonstrate value and ROI.
Exclusive Technavio Analysis on Customer Landscape
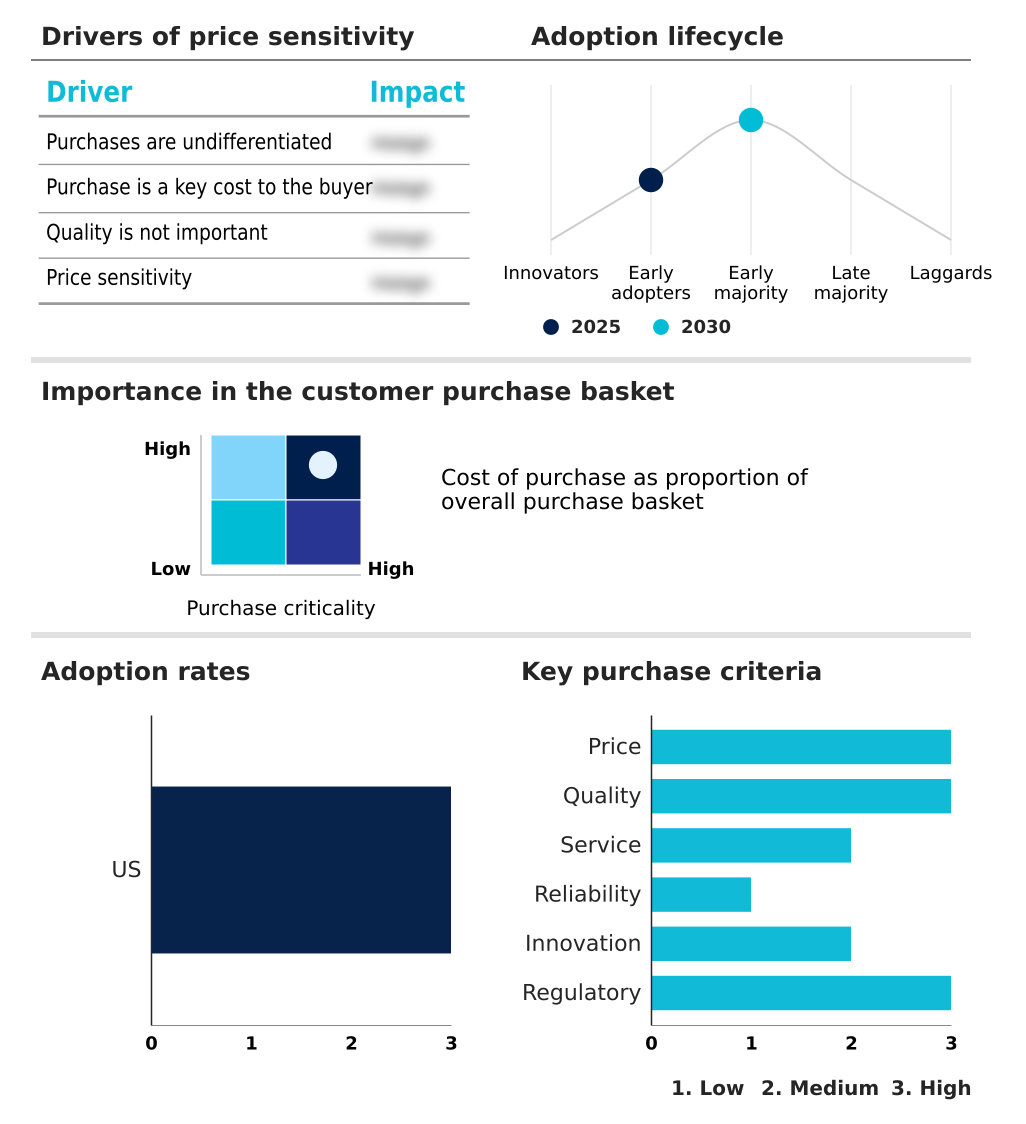
The us online recruitment market forecasting report includes the adoption lifecycle of the market, covering from the innovator’s stage to the laggard’s stage. It focuses on adoption rates in different regions based on penetration. Furthermore, the us online recruitment market report also includes key purchase criteria and drivers of price sensitivity to help companies evaluate and develop their market growth analysis strategies.
Customer Landscape of US Online Recruitment Industry
Competitive Landscape
Companies are implementing various strategies, such as strategic alliances, us online recruitment market forecast, partnerships, mergers and acquisitions, geographical expansion, and product/service launches, to enhance their presence in the industry.
Automatic Data Processing Inc. - Provides integrated recruiting management solutions designed for comprehensive workforce sourcing and hiring, leveraging advanced talent acquisition frameworks.
The industry research and growth report includes detailed analyses of the competitive landscape of the market and information about key companies, including:
- Automatic Data Processing Inc.
- CareerBuilder LLC
- DHI Group Inc.
- Eightfold AI
- Employ Inc.
- Glassdoor LLC
- Greenhouse Software Inc.
- Handshake
- iCIMS Inc.
- Jobvite Inc.
- Ladders Inc.
- LinkedIn Corp.
- Monster Inc.
- ROBERT HALF INC
- SeekOut
- SmartRecruiters Inc.
- Snagajob.com Inc.
- Toptal LLC
- Upwork Inc.
- Workable Software Ltd.
Qualitative and quantitative analysis of companies has been conducted to help clients understand the wider business environment as well as the strengths and weaknesses of key industry players. Data is qualitatively analyzed to categorize companies as pure play, category-focused, industry-focused, and diversified; it is quantitatively analyzed to categorize companies as dominant, leading, strong, tentative, and weak.
Recent Development and News in Us online recruitment market
- In January 2025, Experian launched its I-9 Management solution featuring Virtual Section 2, a government-approved tool enabling remote completion of employment eligibility verification through live virtual appointments.
- In February 2025, Eightfold AI deployed a new generative intelligence layer specifically designed to reduce bias in its automated screening processes.
- In February 2025, SeekOut expanded its platform capabilities to better identify passive talent within specialized engineering domains, enhancing its talent intelligence offerings.
- In May 2025, a strategic partnership was formed between AnitaB.org and Findem to launch an integrated AI talent network, aiming to improve diversity and technical precision in hiring using large-scale, expert-labeled datasets.
Dive into Technavio’s robust research methodology, blending expert interviews, extensive data synthesis, and validated models for unparalleled US Online Recruitment Market insights. See full methodology.
| Market Scope | |
|---|---|
| Page number | 182 |
| Base year | 2025 |
| Historic period | 2020-2024 |
| Forecast period | 2026-2030 |
| Growth momentum & CAGR | Accelerate at a CAGR of 7.4% |
| Market growth 2026-2030 | USD 4751.6 million |
| Market structure | Fragmented |
| YoY growth 2025-2026(%) | 6.9% |
| Key countries | US |
| Competitive landscape | Leading Companies, Market Positioning of Companies, Competitive Strategies, and Industry Risks |
Research Analyst Overview
- The online recruitment market is undergoing a structural shift from basic automation to integrated intelligence, fundamentally altering talent acquisition. Organizations are now leveraging sophisticated talent intelligence platforms that go beyond simple resume parsing to enable dynamic workforce planning and talent rediscovery. This evolution is driven by the need for more effective hiring workflows and sourcing automation.
- A critical boardroom decision now centers on investing in a unified stack that combines applicant tracking systems with advanced candidate engagement and recruitment marketing tools. Such an investment is crucial for not just improving efficiency but also for ensuring compliance and maintaining a strong employer branding presence.
- For instance, companies that have fully adopted AI-powered matching and automated screening report a significant improvement in hiring accuracy. The adoption of virtual recruiting and asynchronous interviews has also become standard, improving the overall candidate experience. This focus on creating strategic talent pipelines through technology is essential for competitive advantage.
What are the Key Data Covered in this US Online Recruitment Market Research and Growth Report?
-
What is the expected growth of the US Online Recruitment Market between 2026 and 2030?
-
USD 4.75 billion, at a CAGR of 7.4%
-
-
What segmentation does the market report cover?
-
The report is segmented by Application (Hospitality, Manufacturing, Healthcare, BFSI, and Others), End-user (Employers, and Non-employers), Platform (Web-based, and Mobile-based) and Geography (North America)
-
-
Which regions are analyzed in the report?
-
North America
-
-
What are the key growth drivers and market challenges?
-
AI adoption accelerating faster candidate sourcing efficiency, High competition reducing platform profitability margins
-
-
Who are the major players in the US Online Recruitment Market?
-
Automatic Data Processing Inc., CareerBuilder LLC, DHI Group Inc., Eightfold AI, Employ Inc., Glassdoor LLC, Greenhouse Software Inc., Handshake, iCIMS Inc., Jobvite Inc., Ladders Inc., LinkedIn Corp., Monster Inc., ROBERT HALF INC, SeekOut, SmartRecruiters Inc., Snagajob.com Inc., Toptal LLC, Upwork Inc. and Workable Software Ltd.
-
Market Research Insights
- The market's dynamics are shaped by a strategic pivot toward efficiency and specialized talent acquisition. The increasing use of remote work recruitment tools reflects a broader acceptance of decentralized teams, a trend supported by data showing 26% of hiring managers plan to utilize contingent staff for greater flexibility.
- This shift demands more sophisticated technology, with a focus on improving the digital candidate experience to attract top talent. Platforms that enable automated candidate sourcing tools and offer predictive hiring analytics software are gaining traction. The effectiveness of these systems is clear, as some firms now report receiving candidate responses in as little as three minutes.
- This emphasis on speed and precision is critical in a market where job seeker interest has surged by 31%, compelling companies to optimize every stage of the hiring process.
We can help! Our analysts can customize this us online recruitment market research report to meet your requirements.
 RIA -
RIA - 
