Online Sex Toys Market Analysis APAC, Europe, North America, South America, Middle East and Africa - China, US, Germany, Japan, India, Canada, South Korea, UK, France, Italy - Size and Forecast 2025-2029

Online Sex Toys Market Analysis APAC, Europe, North America, South America, Middle East and Africa - China, US, Germany, Japan, India, Canada, South Korea, UK, France, Italy - Size and Forecast 2025-2029

Published: Dec 2024 201 Pages SKU: IRTNTR40487

Market Overview at a Glance

$11.56 B
Market Opportunity
11.1%
CAGR
10.0
YoY growth 2024-2025(%)

Online Sex Toys Market Size 2025-2029 

The online sex toys market size is forecast to increase by USD 11.56 billion, at a CAGR of 11.1% between 2024 and 2029. The market is experiencing significant growth, driven by several key factors. In developed countries, the increasing population of the LGBTQ community represents a substantial consumer base with unique needs and preferences.

Major Market Trends & Insights

  • Based on the Gender, the female segment led the market and was valued at USD 9.96 billion of the global revenue in 2023.
  • Based on the Product, the adult vibrators segment accounted for the largest market revenue share in 2023.

Market Size & Forecast

  • 2024 Market Size: USD 16.67 Billion
  • Future Opportunities: USD 11.56 Billion
  • CAGR (2024-2029): 11.1%

The market exhibits robust growth, fueled by increasing consumer acceptance and the normalization of sexual wellness. This burgeoning industry is characterized by a tech-driven landscape, with IoT solutions, AI development, and big data management playing pivotal roles. Enterprise resource planning and data-driven decision making are essential for businesses seeking to optimize operations and stay competitive. Predictive analytics models and marketing automation enable targeted campaigns and personalized customer experiences.

What will be the size of the Online Sex Toys Market during the forecast period?

Online Sex Toys Market Size

 Request Free Sample

  • Innovation in technology, including machine learning applications and cloud computing services, facilitates seamless user experiences and enhances product offerings. The market's digital transformation strategy continues to evolve, with a focus on business growth and SME solutions, ensuring a dynamic and ever-evolving landscape for stakeholders. The male segment is the second largest segment of the gender and was valued at USD 5.25 billion in 2023.
  • This demographic is increasingly embracing technology and the convenience of online shopping for sex toys, leading to a surge in demand. Furthermore, the innovative marketing strategies of companies in this sector are breaking down cultural taboos surrounding sexual health and wellness, making sex toys more mainstream and socially acceptable. However, the market also faces challenges, particularly in regional markets where cultural sensitivities and stringent laws can hinder growth.

  • Navigating these complex regulatory environments requires a nuanced understanding of local customs and a commitment to ethical business practices. Companies seeking to capitalize on market opportunities must stay informed of these trends and adapt their strategies accordingly, ensuring they are responsive to the evolving needs and preferences of their customers. Overall, the market presents significant growth potential, with opportunities for companies that can navigate cultural sensitivities and regulatory challenges while delivering innovative, high-quality products and services.

How is this market segmented?

The market research report provides comprehensive data (region-wise segment analysis), with forecasts and estimates in "USD million" for the period 2025-2029, as well as historical data from 2019-2023 for the following segments.

  • Gender
    • Female
    • Male
  • Product
    • Adult vibrators
    • Erection rings
    • Dildos
    • Others
  • Geography
    • North America
      • US
      • Canada
    • Europe
      • France
      • Germany
      • Italy
      • UK
    • APAC
      • China
      • India
      • Japan
      • South Korea
    • Rest of World (ROW)

By Gender Insights

The female segment is estimated to witness significant growth during the forecast period. The segment was valued at USD 9.96 billion in 2023. It continued to the largest segment at a CAGR of 8.21%.

Online Sex Toys Market Size

Download Free Sample Report

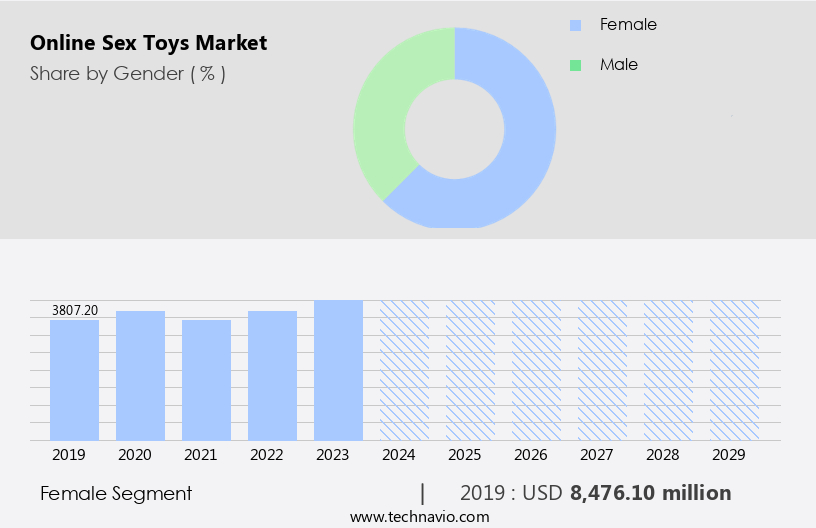
The Female segment was valued at  USD 8476.10 million in 2019 and showed a gradual increase during the forecast period.

Market Dynamics

Our researchers analyzed the data with 2024 as the base year, along with the key drivers, trends, and challenges. A holistic analysis of drivers will help companies refine their marketing strategies to gain a competitive advantage.

The Global Online Sex Toys Market grows with sex toys for e-commerce and discreet packaging for toys. Sex toys market trends 2025 emphasize smart sex toys and eco-friendly sex toys. Toys for wellness retail and vibrators for online stores fuel demand, per sex toys market forecast. Body-safe sex toys leverage toys for subscription services, while toys for couples ensure appeal. Toys for health-conscious consumers and luxury sex toys enhance accessibility. Toys for sustainable production, advanced toy technologies, and sex toys supply chain drive efficiency. Toys for regulatory compliance, toys for global markets, toys for discreet delivery, toys for sexual wellness, and female sex toys for B2B sectors propel growth through 2029.

What are the Online Sex Toys Market market drivers leading to the rise in adoption of the Industry?

  • In the United States, the LGBTQ community comprises a significant segment of the population, and they have a notable presence in the market for sexual wellness products, such as online sex toys. The acceptance and recognition of the LGBTQ community in mainstream society have been growing, with organizations like Goldman Sachs, Google, Morgan Stanley, and Coca-Cola expressing their support. The US Department of Health and Health Services' Healthy People 2020 initiative also includes a goal focused on enhancing the health and wellbeing of the LGBTQ population. Sexual health issues, such as menopausal symptoms, lack of arousal, premature ejaculation, low libido, and erectile dysfunction, are common concerns for individuals.
  • Additionally, SexTech products, including online sex toys from companies like Lovense, serve as therapeutic tools to address these issues. These devices offer discreet and convenient solutions for individuals seeking to improve their sexual health and wellbeing. Key drivers for this growth include the increasing acceptance of sexual wellness products, the convenience and privacy offered by online sales, and the expanding demographic of users. In summary, the LGBTQ community in the US is a significant consumer base for online sex toys, driven by the growing acceptance and support for this population. SexTech products offer discreet and effective solutions for various sexual health concerns, contributing to the expected growth of the market.

What are the Online Sex Toys Market market trends shaping the Industry?

  • An increase in innovative marketing of sex toys is the upcoming trend in the market.Online sales of discreetly packaged sexual wellness products, such as vibrators, have gained traction due to the stigma surrounding their purchase. Market participants have responded by offering unobtrusive packaging to boost consumer confidence. While explicit images were once common in underground sales, their availability in mainstream retail has led to more tasteful product illustrations, often featuring patterns or graphics and labeled as personal massagers or pleasure objects.
  • companies are also employing alternative marketing strategies to position their products as essential for a healthy and pleasurable sex life. This shift in approach will likely continue to drive growth in the market.

How does Online Sex Toys Market market faces challenges face during its growth?

  • Cultural taboos and stringent laws in regional markets are key challenges affecting the market growth.The market for online sales of adult entertainment and products, including sex toys, faces cultural and legal challenges in certain regions, particularly in Asia Pacific and the Middle East. Historically, societal perceptions, influenced by the association of sex toys with pornography in the 1920s, have created a stigma surrounding their use. Some countries have laws prohibiting their sale due to their perceived obscenity, making it difficult for companies to openly display and sell these products in public.
  • However, the advent of e-commerce platforms has enabled anonymous purchasing, thereby mitigating this obstacle to some extent. Despite these challenges, the market continues to grow as more individuals seek privacy and discretion in their purchases.

Exclusive Online Sex Toys Market Customer Landscape

The market forecasting report includes the adoption lifecycle of the market, covering from the innovator's stage to the laggard's stage. It focuses on adoption rates in different regions based on penetration. Furthermore, the report also includes key purchase criteria and drivers of price sensitivity to help companies evaluate and develop their market growth analysis strategies.
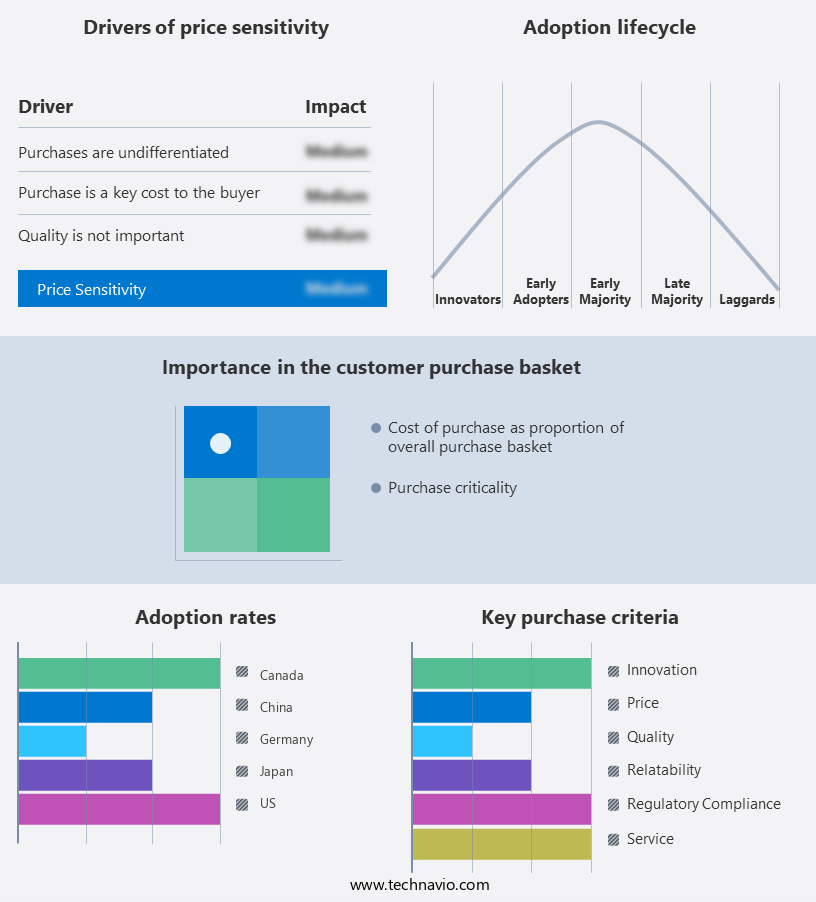
Online Sex Toys Market Share by Geography

 Customer Landscape

Key Companies & Market Insights

Companies are implementing various strategies, such as strategic alliances, market forecast partnerships, mergers and acquisitions, geographical expansion, and product/service launches, to enhance their presence in the market.

The market research and growth report includes detailed analyses of the competitive landscape of the market and information about key companies, including:

  • Bad Dragon Enterprises Inc.
  • BMS Factory
  • Cliq Ltd.
  • FUN FACTORY GmbH
  • Gizmoswala
  • JIMMYJANE
  • Landmark Group
  • LELOi AB
  • Lovetreats
  • Lovehoney Group Ltd.
  • Ltd. Brands
  • Luvu Brands Inc.
  • PHC Inc.
  • Pipedream Products LLC
  • Reckitt Benckiser Group Plc
  • Tantus Inc.
  • TENGA Co. Ltd.
  • The Aneros Co.
  • VIBRATEX Inc.
  • WOW Tech International GmbH

Qualitative and quantitative analysis of companies has been conducted to help clients understand the wider business environment as well as the strengths and weaknesses of key market players. Data is qualitatively analyzed to categorize companies as pure play, category-focused, industry-focused, and diversified; it is quantitatively analyzed to categorize companies as dominant, leading, strong, tentative, and weak.

Recent Development and News in Online Sex Toys Market

  • March 2023: Ethical Capital Partners Ltd. acquired MindGeek LLC, enhancing its online sex toy retail channels to promote consensual adult products globally, leveraging MindGeek's digital reach.
  • July 2023: Lovense LLC launched the ChatGPT Pleasure Companion app, integrating AI-driven storytelling with app-controlled sex toys to cater to tech-savvy consumers.
  • January 2025: We-Vibe introduced the Nova X vibrator with upgraded features like a stronger motor and app connectivity, targeting the USD40.86 billion global market.
  • February 2025: Germany implemented stricter regulations on online sex toy sales, mandating safety certifications to boost consumer trust in e-commerce platforms.

Research Analyst Overview

The market is experiencing a significant surge in growth, driven by the intersection of technology and consumer demand for discreet, convenient, and personalized sexual wellness solutions. This market dynamic is being fueled by several key trends, including machine learning, IoT, digital transformation, and cloud computing. Machine learning algorithms are increasingly being integrated into sex toys, enabling them to learn user preferences and adapt to individual needs. These advanced technologies allow for customized experiences, enhancing satisfaction and engagement. Moreover, machine learning can help optimize product design and development, improving overall product quality and competitiveness. IoT technology is revolutionizing the sex toy industry by enabling connected devices, allowing users to control their toys remotely from anywhere in the world.

This feature adds a new level of intimacy and convenience, making it an attractive proposition for consumers. Furthermore, IoT integration can facilitate data collection and analysis, providing valuable insights into consumer behavior and preferences. Digital transformation is another significant factor driving growth in the market. As more businesses adopt digital strategies, the market is seeing an influx of innovative startups and established players entering the space. This competition is leading to increased innovation, as companies strive to differentiate themselves through unique features and user experiences. SMEs and enterprises are recognizing the potential of the market and are investing in strategic partnerships and acquisitions to expand their offerings.

Sales of sex toys are no longer limited to niche markets; they are becoming mainstream consumer products, with a growing presence in major retailers and e-commerce platforms. Predictive analytics and big data are also playing a crucial role in the market. By analyzing consumer data, companies can gain valuable insights into trends, preferences, and buying behaviors. This information can be used to inform marketing strategies, product development, and customer engagement efforts. Artificial intelligence (AI) is another technology that is transforming the market. AI-powered toys can simulate human touch and respond to user input, creating a more realistic and immersive experience.

Additionally, AI can be used to analyze user data and provide personalized recommendations, enhancing customer satisfaction and loyalty. In conclusion, the market is undergoing a period of rapid growth and innovation, driven by the convergence of technology and consumer demand. Machine learning, IoT, digital transformation, and other emerging technologies are transforming the industry, making it an exciting space for businesses to explore. As the market continues to evolve, we can expect to see further advancements in product design, user experience, and data analysis.

Dive into Technavio's robust research methodology, blending expert interviews, extensive data synthesis, and validated models for unparalleled Online Sex Toys Market insights. See full methodology.

Market Scope

Report Coverage

Details

Page number

201

Base year

2024

Historic period

2019-2023

Forecast period

2025-2029

Growth momentum & CAGR

Accelerate at a CAGR of 11.1%

Market growth 2025-2029

USD 11557.3 million

Market structure

Fragmented

YoY growth 2024-2025(%)

10.0

Competitive landscape

Leading Companies, Market Positioning of Companies, Competitive Strategies, and Industry Risks

Request Free Sample

What are the Key Data Covered in this Market Research Report?

  • CAGR of the market during the forecast period
  • Detailed information on factors that will drive the market growth and forecasting between 2025 and 2029
  • Precise estimation of the size of the market  and its contribution of the market in focus to the parent market
  • Accurate predictions about upcoming market growth and trends and changes in consumer behaviour
  • Growth of the market across APAC, Europe, North America, South America, and Middle East and Africa
  • Thorough analysis of the market's competitive landscape and detailed information about companies
  • Comprehensive analysis of factors that will challenge the growth of market companies

We can help! Our analysts can customize this market research report to meet your requirements Get in touch

1 Executive Summary

  • 1.1 Market overview
    • Executive Summary - Chart on Market Overview
    • Executive Summary - Data Table on Market Overview
    • Executive Summary - Chart on Global Market Characteristics
    • Executive Summary - Chart on Market by Geography
    • Executive Summary - Chart on Market Segmentation by Gender
    • Executive Summary - Chart on Market Segmentation by Product
    • Executive Summary - Chart on Incremental Growth
    • Executive Summary - Data Table on Incremental Growth
    • Executive Summary - Chart on Company Market Positioning

2 Technavio Analysis

  • 2.1 Analysis of price sensitivity, lifecycle, customer purchase basket, adoption rates, and purchase criteria
    • Analysis of price sensitivity, lifecycle, customer purchase basket, adoption rates, and purchase criteria
  • 2.2 Criticality of inputs and Factors of differentiation
    • Overview on criticality of inputs and factors of differentiation
  • 2.3 Factors of disruption
    • Overview on factors of disruption
  • 2.4 Impact of drivers and challenges
    • Impact of drivers and challenges in 2024 and 2029

3 Market Landscape

  • 3.1 Market ecosystem
    • Parent Market
    • Data Table on - Parent Market
  • 3.2 Market characteristics
    • Market characteristics analysis
  • 3.3 Value chain analysis
    • Value chain analysis

4 Market Sizing

  • 4.1 Market definition
    • Offerings of companies included in the market definition
  • 4.2 Market segment analysis
    • Market segments
  • 4.3 Market size 2024
    • 4.4 Market outlook: Forecast for 2024-2029
      • Chart on Global - Market size and forecast 2024-2029 ($ million)
      • Data Table on Global - Market size and forecast 2024-2029 ($ million)
      • Chart on Global Market: Year-over-year growth 2024-2029 (%)
      • Data Table on Global Market: Year-over-year growth 2024-2029 (%)

    5 Historic Market Size

    • 5.1 Global Online Sex Toys Market 2019 - 2023
      • Historic Market Size - Data Table on Global Online Sex Toys Market 2019 - 2023 ($ million)
    • 5.2 Gender segment analysis 2019 - 2023
      • Historic Market Size - Gender Segment 2019 - 2023 ($ million)
    • 5.3 Product segment analysis 2019 - 2023
      • Historic Market Size - Product Segment 2019 - 2023 ($ million)
    • 5.4 Geography segment analysis 2019 - 2023
      • Historic Market Size - Geography Segment 2019 - 2023 ($ million)
    • 5.5 Country segment analysis 2019 - 2023
      • Historic Market Size - Country Segment 2019 - 2023 ($ million)

    6 Qualitative Analysis

    • 6.1 The impact of AI in Global Online Sex Toys Market

      7 Five Forces Analysis

      • 7.1 Five forces summary
        • Five forces analysis - Comparison between 2024 and 2029
      • 7.2 Bargaining power of buyers
        • Bargaining power of buyers - Impact of key factors 2024 and 2029
      • 7.3 Bargaining power of suppliers
        • Bargaining power of suppliers - Impact of key factors in 2024 and 2029
      • 7.4 Threat of new entrants
        • Threat of new entrants - Impact of key factors in 2024 and 2029
      • 7.5 Threat of substitutes
        • Threat of substitutes - Impact of key factors in 2024 and 2029
      • 7.6 Threat of rivalry
        • Threat of rivalry - Impact of key factors in 2024 and 2029
      • 7.7 Market condition
        • Chart on Market condition - Five forces 2024 and 2029

      8 Market Segmentation by Gender

      • 8.1 Market segments
        • Chart on Gender - Market share 2024-2029 (%)
        • Data Table on Gender - Market share 2024-2029 (%)
      • 8.2 Comparison by Gender
        • Chart on Comparison by Gender
        • Data Table on Comparison by Gender
      • 8.3 Female - Market size and forecast 2024-2029
        • Chart on Female - Market size and forecast 2024-2029 ($ million)
        • Data Table on Female - Market size and forecast 2024-2029 ($ million)
        • Chart on Female - Year-over-year growth 2024-2029 (%)
        • Data Table on Female - Year-over-year growth 2024-2029 (%)
      • 8.4 Male - Market size and forecast 2024-2029
        • Chart on Male - Market size and forecast 2024-2029 ($ million)
        • Data Table on Male - Market size and forecast 2024-2029 ($ million)
        • Chart on Male - Year-over-year growth 2024-2029 (%)
        • Data Table on Male - Year-over-year growth 2024-2029 (%)
      • 8.5 Market opportunity by Gender
        • Market opportunity by Gender ($ million)
        • Data Table on Market opportunity by Gender ($ million)

      9 Market Segmentation by Product

      • 9.1 Market segments
        • Chart on Product - Market share 2024-2029 (%)
        • Data Table on Product - Market share 2024-2029 (%)
      • 9.2 Comparison by Product
        • Chart on Comparison by Product
        • Data Table on Comparison by Product
      • 9.3 Adult vibrators - Market size and forecast 2024-2029
        • Chart on Adult vibrators - Market size and forecast 2024-2029 ($ million)
        • Data Table on Adult vibrators - Market size and forecast 2024-2029 ($ million)
        • Chart on Adult vibrators - Year-over-year growth 2024-2029 (%)
        • Data Table on Adult vibrators - Year-over-year growth 2024-2029 (%)
      • 9.4 Erection rings - Market size and forecast 2024-2029
        • Chart on Erection rings - Market size and forecast 2024-2029 ($ million)
        • Data Table on Erection rings - Market size and forecast 2024-2029 ($ million)
        • Chart on Erection rings - Year-over-year growth 2024-2029 (%)
        • Data Table on Erection rings - Year-over-year growth 2024-2029 (%)
      • 9.5 Dildos - Market size and forecast 2024-2029
        • Chart on Dildos - Market size and forecast 2024-2029 ($ million)
        • Data Table on Dildos - Market size and forecast 2024-2029 ($ million)
        • Chart on Dildos - Year-over-year growth 2024-2029 (%)
        • Data Table on Dildos - Year-over-year growth 2024-2029 (%)
      • 9.6 Others - Market size and forecast 2024-2029
        • Chart on Others - Market size and forecast 2024-2029 ($ million)
        • Data Table on Others - Market size and forecast 2024-2029 ($ million)
        • Chart on Others - Year-over-year growth 2024-2029 (%)
        • Data Table on Others - Year-over-year growth 2024-2029 (%)
      • 9.7 Market opportunity by Product
        • Market opportunity by Product ($ million)
        • Data Table on Market opportunity by Product ($ million)

      10 Customer Landscape

      • 10.1 Customer landscape overview
        • Analysis of price sensitivity, lifecycle, customer purchase basket, adoption rates, and purchase criteria

      11 Geographic Landscape

      • 11.1 Geographic segmentation
        • Chart on Market share by geography 2024-2029 (%)
        • Data Table on Market share by geography 2024-2029 (%)
      • 11.2 Geographic comparison
        • Chart on Geographic comparison
        • Data Table on Geographic comparison
      • 11.3 APAC - Market size and forecast 2024-2029
        • Chart on APAC - Market size and forecast 2024-2029 ($ million)
        • Data Table on APAC - Market size and forecast 2024-2029 ($ million)
        • Chart on APAC - Year-over-year growth 2024-2029 (%)
        • Data Table on APAC - Year-over-year growth 2024-2029 (%)
      • 11.4 Europe - Market size and forecast 2024-2029
        • Chart on Europe - Market size and forecast 2024-2029 ($ million)
        • Data Table on Europe - Market size and forecast 2024-2029 ($ million)
        • Chart on Europe - Year-over-year growth 2024-2029 (%)
        • Data Table on Europe - Year-over-year growth 2024-2029 (%)
      • 11.5 North America - Market size and forecast 2024-2029
        • Chart on North America - Market size and forecast 2024-2029 ($ million)
        • Data Table on North America - Market size and forecast 2024-2029 ($ million)
        • Chart on North America - Year-over-year growth 2024-2029 (%)
        • Data Table on North America - Year-over-year growth 2024-2029 (%)
      • 11.6 South America - Market size and forecast 2024-2029
        • Chart on South America - Market size and forecast 2024-2029 ($ million)
        • Data Table on South America - Market size and forecast 2024-2029 ($ million)
        • Chart on South America - Year-over-year growth 2024-2029 (%)
        • Data Table on South America - Year-over-year growth 2024-2029 (%)
      • 11.7 Middle East and Africa - Market size and forecast 2024-2029
        • Chart on Middle East and Africa - Market size and forecast 2024-2029 ($ million)
        • Data Table on Middle East and Africa - Market size and forecast 2024-2029 ($ million)
        • Chart on Middle East and Africa - Year-over-year growth 2024-2029 (%)
        • Data Table on Middle East and Africa - Year-over-year growth 2024-2029 (%)
      • 11.8 China - Market size and forecast 2024-2029
        • Chart on China - Market size and forecast 2024-2029 ($ million)
        • Data Table on China - Market size and forecast 2024-2029 ($ million)
        • Chart on China - Year-over-year growth 2024-2029 (%)
        • Data Table on China - Year-over-year growth 2024-2029 (%)
      • 11.9 US - Market size and forecast 2024-2029
        • Chart on US - Market size and forecast 2024-2029 ($ million)
        • Data Table on US - Market size and forecast 2024-2029 ($ million)
        • Chart on US - Year-over-year growth 2024-2029 (%)
        • Data Table on US - Year-over-year growth 2024-2029 (%)
      • 11.10 Germany - Market size and forecast 2024-2029
        • Chart on Germany - Market size and forecast 2024-2029 ($ million)
        • Data Table on Germany - Market size and forecast 2024-2029 ($ million)
        • Chart on Germany - Year-over-year growth 2024-2029 (%)
        • Data Table on Germany - Year-over-year growth 2024-2029 (%)
      • 11.11 Japan - Market size and forecast 2024-2029
        • Chart on Japan - Market size and forecast 2024-2029 ($ million)
        • Data Table on Japan - Market size and forecast 2024-2029 ($ million)
        • Chart on Japan - Year-over-year growth 2024-2029 (%)
        • Data Table on Japan - Year-over-year growth 2024-2029 (%)
      • 11.12 India - Market size and forecast 2024-2029
        • Chart on India - Market size and forecast 2024-2029 ($ million)
        • Data Table on India - Market size and forecast 2024-2029 ($ million)
        • Chart on India - Year-over-year growth 2024-2029 (%)
        • Data Table on India - Year-over-year growth 2024-2029 (%)
      • 11.13 Canada - Market size and forecast 2024-2029
        • Chart on Canada - Market size and forecast 2024-2029 ($ million)
        • Data Table on Canada - Market size and forecast 2024-2029 ($ million)
        • Chart on Canada - Year-over-year growth 2024-2029 (%)
        • Data Table on Canada - Year-over-year growth 2024-2029 (%)
      • 11.14 South Korea - Market size and forecast 2024-2029
        • Chart on South Korea - Market size and forecast 2024-2029 ($ million)
        • Data Table on South Korea - Market size and forecast 2024-2029 ($ million)
        • Chart on South Korea - Year-over-year growth 2024-2029 (%)
        • Data Table on South Korea - Year-over-year growth 2024-2029 (%)
      • 11.15 UK - Market size and forecast 2024-2029
        • Chart on UK - Market size and forecast 2024-2029 ($ million)
        • Data Table on UK - Market size and forecast 2024-2029 ($ million)
        • Chart on UK - Year-over-year growth 2024-2029 (%)
        • Data Table on UK - Year-over-year growth 2024-2029 (%)
      • 11.16 France - Market size and forecast 2024-2029
        • Chart on France - Market size and forecast 2024-2029 ($ million)
        • Data Table on France - Market size and forecast 2024-2029 ($ million)
        • Chart on France - Year-over-year growth 2024-2029 (%)
        • Data Table on France - Year-over-year growth 2024-2029 (%)
      • 11.17 Italy - Market size and forecast 2024-2029
        • Chart on Italy - Market size and forecast 2024-2029 ($ million)
        • Data Table on Italy - Market size and forecast 2024-2029 ($ million)
        • Chart on Italy - Year-over-year growth 2024-2029 (%)
        • Data Table on Italy - Year-over-year growth 2024-2029 (%)
      • 11.18 Market opportunity by geography
        • Market opportunity by geography ($ million)
        • Data Tables on Market opportunity by geography ($ million)

      12 Drivers, Challenges, and Opportunity/Restraints

      • 12.1 Market drivers
        • 12.2 Market challenges
          • 12.3 Impact of drivers and challenges
            • Impact of drivers and challenges in 2024 and 2029
          • 12.4 Market opportunities/restraints

            13 Competitive Landscape

            • 13.1 Overview
              • 13.2 Competitive Landscape
                • Overview on criticality of inputs and factors of differentiation
              • 13.3 Landscape disruption
                • Overview on factors of disruption
              • 13.4 Industry risks
                • Impact of key risks on business

              14 Competitive Analysis

              • 14.1 Companies profiled
                • Companies covered
              • 14.2 Company ranking index
                • Company ranking index
              • 14.3 Market positioning of companies
                • Matrix on companies position and classification
              • 14.4 Bad Dragon Enterprises Inc.
                • Bad Dragon Enterprises Inc. - Overview
                • Bad Dragon Enterprises Inc. - Product / Service
                • Bad Dragon Enterprises Inc. - Key offerings
                • SWOT
              • 14.5 BMS Factory
                • BMS Factory - Overview
                • BMS Factory - Product / Service
                • BMS Factory - Key offerings
                • SWOT
              • 14.6 Cliq Ltd.
                • Cliq Ltd. - Overview
                • Cliq Ltd. - Product / Service
                • Cliq Ltd. - Key offerings
                • SWOT
              • 14.7 FUN FACTORY GmbH
                • FUN FACTORY GmbH - Overview
                • FUN FACTORY GmbH - Product / Service
                • FUN FACTORY GmbH - Key offerings
                • SWOT
              • 14.8 JIMMYJANE
                • JIMMYJANE - Overview
                • JIMMYJANE - Product / Service
                • JIMMYJANE - Key offerings
                • SWOT
              • 14.9 Landmark Group
                • Landmark Group - Overview
                • Landmark Group - Product / Service
                • Landmark Group - Key offerings
                • SWOT
              • 14.10 LELOi AB
                • LELOi AB - Overview
                • LELOi AB - Product / Service
                • LELOi AB - Key offerings
                • SWOT
              • 14.11 Lovehoney Group Ltd.
                • Lovehoney Group Ltd. - Overview
                • Lovehoney Group Ltd. - Product / Service
                • Lovehoney Group Ltd. - Key offerings
                • SWOT
              • 14.12 Luvu Brands Inc.
                • Luvu Brands Inc. - Overview
                • Luvu Brands Inc. - Business segments
                • Luvu Brands Inc. - Key offerings
                • Luvu Brands Inc. - Segment focus
                • SWOT
              • 14.13 PHC Inc.
                • PHC Inc. - Overview
                • PHC Inc. - Product / Service
                • PHC Inc. - Key offerings
                • SWOT
              • 14.14 Reckitt Benckiser Group Plc
                • Reckitt Benckiser Group Plc - Overview
                • Reckitt Benckiser Group Plc - Business segments
                • Reckitt Benckiser Group Plc - Key news
                • Reckitt Benckiser Group Plc - Key offerings
                • Reckitt Benckiser Group Plc - Segment focus
                • SWOT
              • 14.15 Tantus Inc.
                • Tantus Inc. - Overview
                • Tantus Inc. - Product / Service
                • Tantus Inc. - Key offerings
                • SWOT
              • 14.16 TENGA Co. Ltd.
                • TENGA Co. Ltd. - Overview
                • TENGA Co. Ltd. - Product / Service
                • TENGA Co. Ltd. - Key offerings
                • SWOT
              • 14.17 The Aneros Co.
                • The Aneros Co. - Overview
                • The Aneros Co. - Product / Service
                • The Aneros Co. - Key offerings
                • SWOT
              • 14.18 WOW Tech International GmbH
                • WOW Tech International GmbH - Overview
                • WOW Tech International GmbH - Product / Service
                • WOW Tech International GmbH - Key offerings
                • SWOT

              15 Appendix

              • 15.1 Scope of the report
                • 15.2 Inclusions and exclusions checklist
                  • Inclusions checklist
                  • Exclusions checklist
                • 15.3 Currency conversion rates for US$
                  • Currency conversion rates for US$
                • 15.4 Research methodology
                  • Research methodology
                • 15.5 Data procurement
                  • Information sources
                • 15.6 Data validation
                  • Data validation
                • 15.7 Validation techniques employed for market sizing
                  • Validation techniques employed for market sizing
                • 15.8 Data synthesis
                  • Data synthesis
                • 15.9 360 degree market analysis
                  • 360 degree market analysis
                • 15.10 List of abbreviations
                  • List of abbreviations

                Research Methodology

                Technavio presents a detailed picture of the market by way of study, synthesis, and summation of data from multiple sources. The analysts have presented the various facets of the market with a particular focus on identifying the key industry influencers. The data thus presented is comprehensive, reliable, and the result of extensive research, both primary and secondary.

                INFORMATION SOURCES

                Primary sources

                • Manufacturers and suppliers
                • Channel partners
                • Industry experts
                • Strategic decision makers

                Secondary sources

                • Industry journals and periodicals
                • Government data
                • Financial reports of key industry players
                • Historical data
                • Press releases

                DATA ANALYSIS

                Data Synthesis

                • Collation of data
                • Estimation of key figures
                • Analysis of derived insights

                Data Validation

                • Triangulation with data models
                • Reference against proprietary databases
                • Corroboration with industry experts

                REPORT WRITING

                Qualitative

                • Market drivers
                • Market challenges
                • Market trends
                • Five forces analysis

                Quantitative

                • Market size and forecast
                • Market segmentation
                • Geographical insights
                • Competitive landscape

                Interested in this report?

                Get your sample now to see our research methodology and insights!

                Download Now

                Frequently Asked Questions

                Online Sex Toys market growth will increase by $ 11557.3 mn during 2025-2029 .

                The Online Sex Toys market is expected to grow at a CAGR of 11.1% during 2025-2029 .

                Online Sex Toys market is segmented by Gender( Female, Male, Dildos, Others) Product( Adult vibrators, Erection rings, Dildos, Others, Middle East and Africa)

                Bad Dragon Enterprises Inc., BMS Factory, Cliq Ltd., FUN FACTORY GmbH, Gizmoswala, JIMMYJANE, Landmark Group, LELOi AB, Lovetreats, Lovehoney Group Ltd., Ltd. Brands, Luvu Brands Inc., PHC Inc., Pipedream Products LLC, Reckitt Benckiser Group Plc, Tantus Inc., TENGA Co. Ltd., The Aneros Co., VIBRATEX Inc., WOW Tech International GmbH are a few of the key vendors in the Online Sex Toys market.

                APAC will register the highest growth rate of 47% among the other regions. Therefore, the Online Sex Toys market in APAC is expected to garner significant business opportunities for the vendors during the forecast period.

                China, US, Germany, Japan, India, Canada, South Korea, UK, France, Italy

                • Growing LGBTQ population in developed countriesIn developed countries like the US is the driving factor this market.
                • the LGBTQ population is a key part of the entire population. The LGBTQ population is the primary user of sexual wellness products is the driving factor this market.
                • including sex toys.Additionally is the driving factor this market.
                • the growing LGBTQ population is also supported by mainstream news media in the US. Goldman Sachs is the driving factor this market.
                • Google is the driving factor this market.
                • Morgan Stanley is the driving factor this market.
                • and Coca-Cola were some of the organizations that were part of this initiative. Furthermore is the driving factor this market.
                • the support for the LGBT population is also evident by an objective in the US Department of Health and Human Services Healthy People 2020 initiative that is solely dedicated to improving the health and wellness of this population.These consumers are becoming prominent purchasers of sex toys is the driving factor this market.
                • including dildos is the driving factor this market.
                • adult vibrators is the driving factor this market.
                • and erection rings. The easy availability and purchase of these products through e-commerce websites is a reason behind the increase in the adoption of these products. Increased information provided by vendors through online forums is the driving factor this market.
                • blogs is the driving factor this market.
                • and videos for discussion is helping women and the LGBTQ population to explore and buy these products legally and discreetly is the driving factor this market.
                • thus increasing demand. Vendors are also providing online communities such as online discussion forums where users can share their experiences is the driving factor this market.
                • offer advice and inspiration is the driving factor this market.
                • and gain support from peers and experts such as sexologists is the driving factor this market.
                • doctors is the driving factor this market.
                • and therapists. The interest among women in innovative adult vibrators and other sex toys is growing is the driving factor this market.
                • which will aid in the generation of revenue in the market. Due to this change in perception and increased product adoption is the driving factor this market.
                • the LGBTQ population is searching for and purchasing a range of sex toys. The availability of sex toys through online platforms such as company websites and dedicated e-commerce sites is serving the purpose in terms of meeting the growing demand for sex toys among the LGBTQ population. Also is the driving factor this market.
                • innovative products and discrete product packaging of sex toys are attracting many LGBTQ individuals to adopt these new products. Thus is the driving factor this market.
                • the growing LGBTQ population is expected to drive the growth of the market during the forecast period is the driving factor this market.
                • generating a majority of its revenue from developed countries such as the US is the driving factor this market.
                • Canada is the driving factor this market.
                • and the UK. Thus is the driving factor this market.
                • the growing LGBTQ population in developed countries will augment the growth of the global online sex toys market during the forecast period. is the driving factor this market.

                The Online Sex Toys market vendors should focus on grabbing business opportunities from the Female segment as it accounted for the largest market share in the base year.