
Operational Resilience Management Platforms Market Size and Growth Forecast 2026-2030
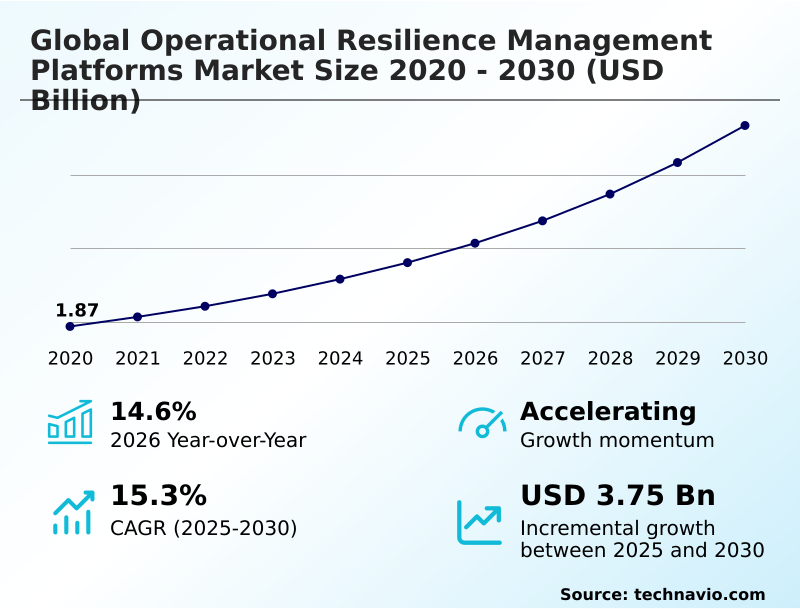
The Operational Resilience Management Platforms Market size was valued at USD 3.61 billion in 2025 growing at a CAGR of 15.3% during the forecast period 2026-2030.
North America accounts for 41.7% of incremental growth during the forecast period. The Software segment by Component was valued at USD 2.08 billion in 2024, while the Cloud based segment holds the largest revenue share by Deployment.
The market is projected to grow by USD 5.48 billion from 2020 to 2030, with USD 3.75 billion of the growth expected during the forecast period of 2025 to 2030.
Get Key Insights on Market Forecast (PDF) Request Free Sample
Operational Resilience Management Platforms Market Overview
The operational resilience management platforms market is advancing with a year-over-year growth of over 14%, as organizations transition from legacy disaster recovery to proactive digital operational resilience. This evolution is driven by the need to maintain service continuity assurance amidst complex cyber threats and supply chain vulnerabilities. For instance, a multinational financial institution, to comply with the Digital Operational Resilience Act (DORA), utilizes a platform for automated impact tolerance testing and real-time threat intelligence. By deploying sophisticated dependency mapping tools, the firm achieves critical business services mapping across its entire technology stack, integrating governance, risk, and compliance (GRC) functions. This enables predictive stress testing and ensures that business continuity planning is not a static exercise but a dynamic capability. Such platforms provide a unified risk posture, which is essential for making informed decisions on operational risk mitigation and strategic investments in cloud-native resilience.
Drivers, Trends, and Challenges in the Operational Resilience Management Platforms Market
The evolution of operational resilience platforms for financial services is largely dictated by the stringent mandates for compliance with the Digital Operational Resilience Act (DORA), which has become a benchmark for other sectors. This regulatory pressure is accelerating the integration of generative AI for scenario testing, allowing organizations to simulate complex failure scenarios with high fidelity.
A key functional advancement is the capability for automating third-party risk assessments, which provides firms with real-time visibility into vulnerabilities within their digital supply chains. In practice, a manufacturing firm implementing an operational technology (OT) resilience strategy can use these platforms to map critical production dependencies and model the impact of a system failure, aligning with standards like ISO 22301.
The business case for these investments is clear when quantifying return on investment for resilience platforms; the upfront cost is often a fraction of the revenue lost during a single significant outage.
This makes a compelling argument for decision-makers evaluating cloud-based business continuity software comparison and looking for best practices for impact tolerance setting to effectively manage supply chain disruptions with technology.
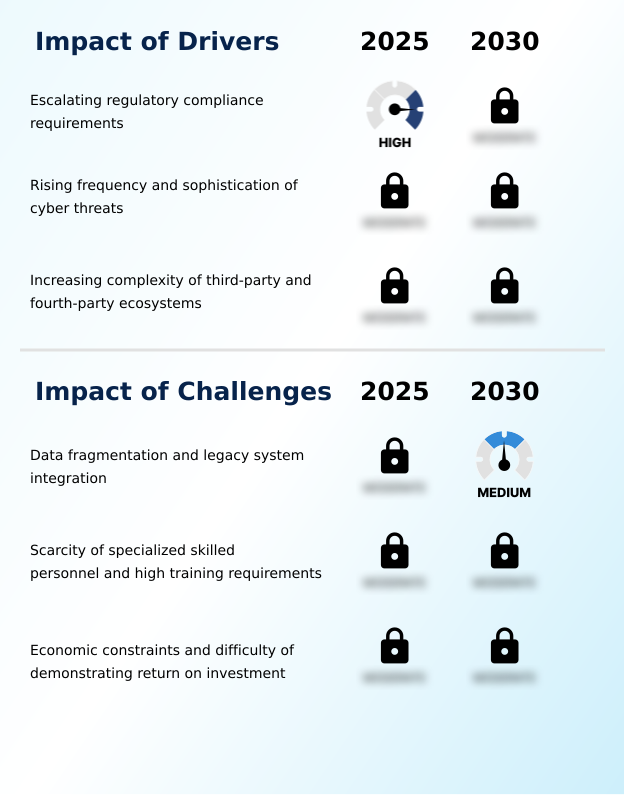
Primary Growth Driver: Escalating regulatory compliance requirements globally serve as a primary driver for the adoption of operational resilience management platforms.
Regulatory pressure remains the primary market driver, with frameworks like the EU's Digital Operational Resilience Act (DORA) mandating sophisticated capabilities for regulatory compliance reporting and third-party risk management.
The growing complexity of global supply chains amplifies this demand, compelling firms to adopt tools for continuous supply chain risk monitoring and dependency mapping.
This is particularly true in North America, which represents the largest market opportunity at over 41%, where critical infrastructure protection and financial stability are paramount.
As enterprises become more interconnected, platforms that enable robust operational risk mitigation and provide a clear line of sight into fourth-party risks are becoming essential for survival and competitive advantage.
Emerging Market Trend: The proliferation of generative AI is enhancing predictive stress testing capabilities. This technology is reshaping organizational approaches to dynamic scenario modeling and vulnerability assessments.
The market is advancing through the integration of generative AI for predictive stress testing and dynamic scenario planning. This technology enables more realistic threat simulation, moving beyond static checklists. Another key trend is the convergence of cybersecurity framework integration with business continuity, creating a unified approach to digital operational resilience.
Organizations are also expanding their risk calculus to include ESG risk factor integration, using platforms to monitor climate-related and social vulnerabilities within their supply chains. This shift toward proactive threat detection is particularly evident in APAC, the region with the highest growth rate of 16.1%, where digital transformation accelerates the need for advanced resilience capabilities.
Key Industry Challenge: Data fragmentation and the complexity of integrating with legacy systems present a significant challenge affecting the growth of the operational resilience management platforms market.
A primary market challenge is data fragmentation, where critical information remains siloed within legacy systems, hindering the creation of a unified risk posture and holistic risk visibility. This technical debt complicates the integration of modern platforms and can impede effective business impact analysis.
A concurrent challenge is the scarcity of specialized skilled personnel with the multidisciplinary expertise required to manage these complex systems, from configuring scenario modeling to interpreting resilience data analytics.
Furthermore, economic constraints and the difficulty in quantifying the return on investment make it challenging to secure budget for these platforms, as they are often viewed as insurance costs rather than revenue-generating assets.
Explore Full Market Dynamics Analysis Request Free Sample
Operational Resilience Management Platforms Market Segmentation
The operational resilience management platforms industry research report provides comprehensive data including region-wise segment analysis, with forecasts and analysis for the period 2026-2030, as well as historical data from 2020-2024 for the following segments.
Component Segment Analysis
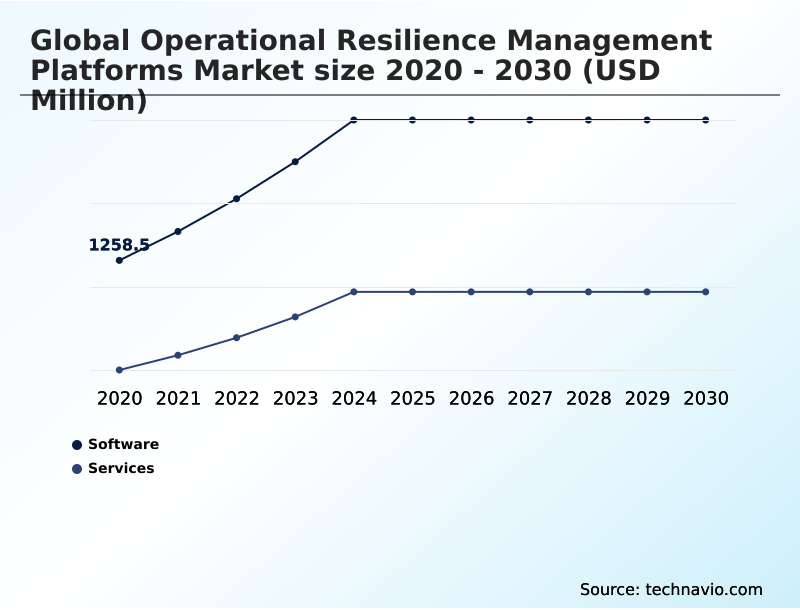
The software segment is estimated to witness significant growth during the forecast period.
The software segment, which accounts for over 65% of the market, is the core component of operational resilience strategies.
These platforms provide essential tools for enterprise risk management (ERM) and business continuity planning, enabling organizations to move beyond static documents to dynamic, actionable frameworks.
Procurement is driven by the need for sophisticated dependency mapping tools and automated regulatory compliance reporting to meet stringent standards such as the EU's Digital Operational Resilience Act (DORA).
The focus is on solutions that deliver a unified risk posture, integrating data for critical business services mapping and real-time threat intelligence.
This allows for proactive risk management and ensures service continuity assurance in an increasingly complex and regulated digital environment.
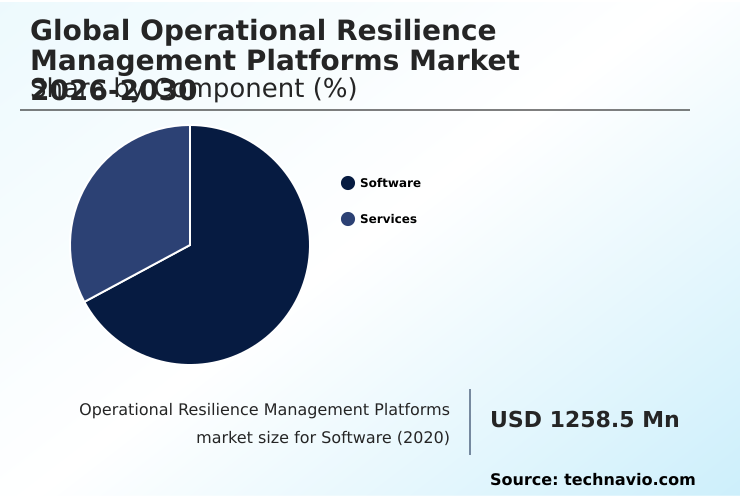
The Software segment was valued at USD 2.08 billion in 2024 and showed a gradual increase during the forecast period.
Operational Resilience Management Platforms Market by Region: North America Leads with 41.7% Growth Share
North America is estimated to contribute 41.7% to the growth of the global market during the forecast period.
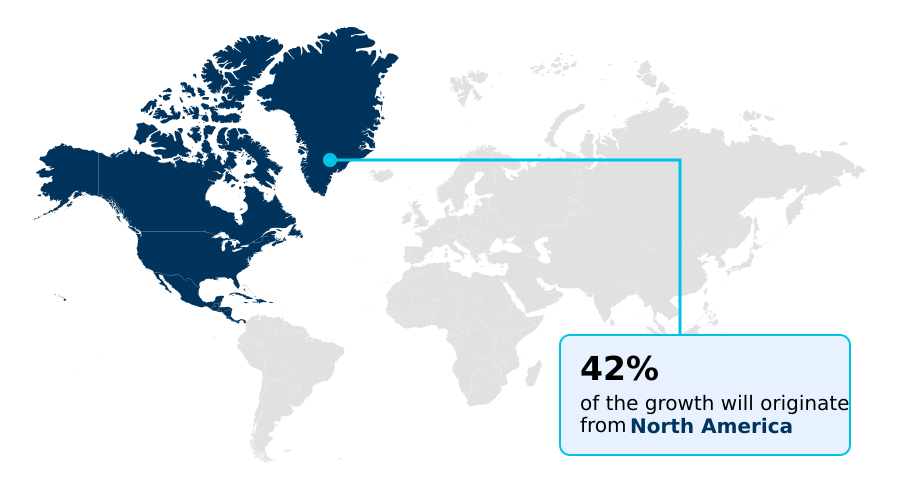
The geographic landscape is led by North America, which commands over 41% of the market opportunity, driven by stringent regulatory oversight and a mature focus on critical infrastructure protection.
Europe's market is primarily shaped by region-wide mandates like the Digital Operational Resilience Act (DORA), which enforces high standards for digital operational resilience and third-party risk management.
Meanwhile, APAC is the fastest-growing region, with a 16.1% CAGR, as rapid digitalization and increasing supply chain dependency analysis compel enterprises to invest in advanced solutions.
Across all regions, the adoption of multi-cloud disaster recovery strategies and real-time telemetry monitoring is becoming standard practice for maintaining a competitive and resilient operational posture in a volatile global economy.
Customer Landscape Analysis for the Operational Resilience Management Platforms Market
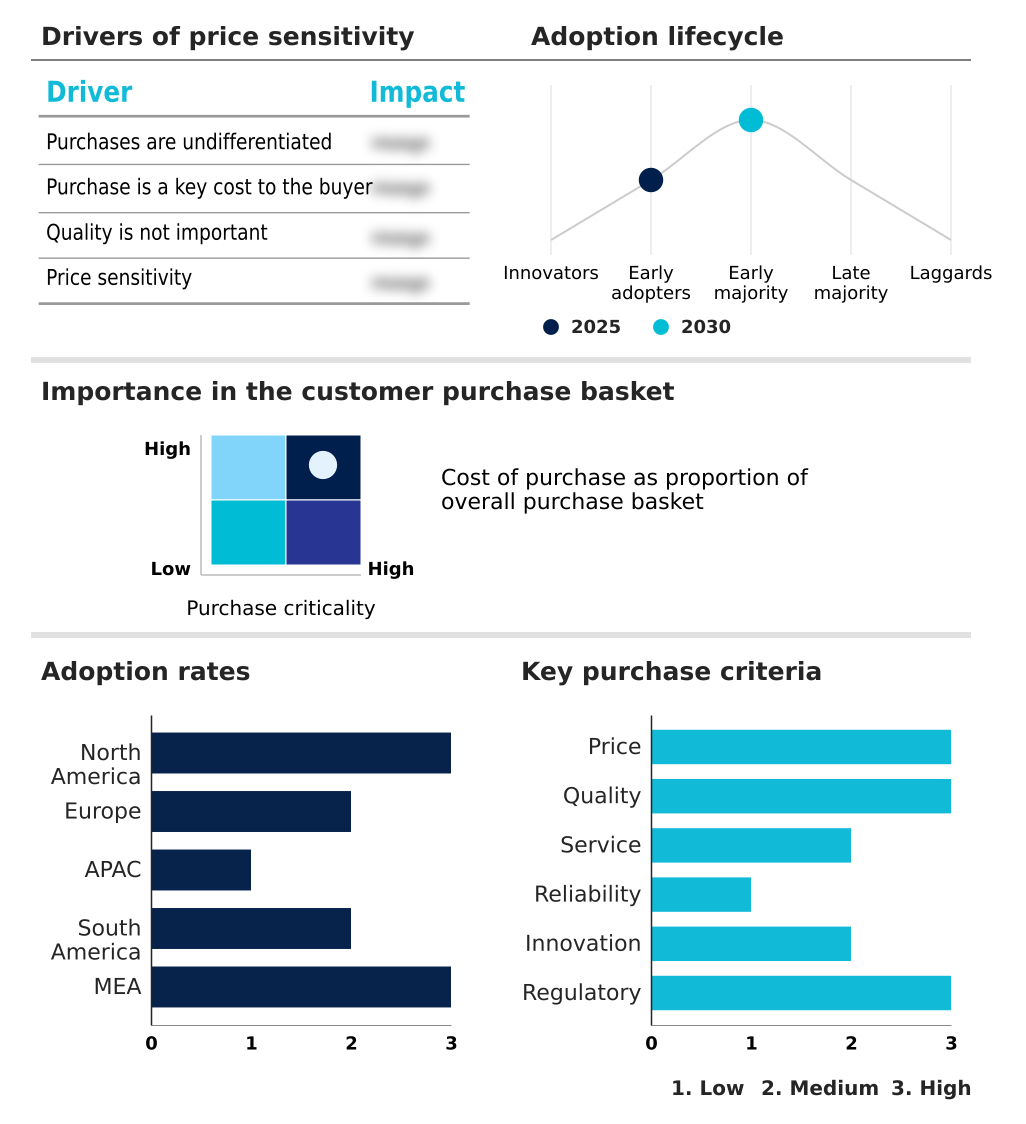
The operational resilience management platforms market forecasting report includes the adoption lifecycle of the market, covering from the innovator’s stage to the laggard’s stage. It focuses on adoption rates in different regions based on penetration. Furthermore, the operational resilience management platforms market report also includes key purchase criteria and drivers of price sensitivity to help companies evaluate and develop their market growth analysis strategies.
Competitive Landscape of the Operational Resilience Management Platforms Market
Companies are implementing various strategies, such as strategic alliances, partnerships, mergers and acquisitions, geographical expansion, and product/service launches, to enhance their presence in the operational resilience management platforms market industry.
AuditBoard Inc. - Providers deliver integrated platforms for governance, risk, and compliance (GRC), featuring automated recovery procedures and tools for comprehensive third-party risk management to ensure enterprise-wide resilience.
The industry research and growth report includes detailed analyses of the competitive landscape of the market and information about key companies, including:
- AuditBoard Inc.
- Cutover Ltd.
- Diligent Corp.
- Everbridge Inc.
- F24 AG.
- Fusion Risk Management Inc.
- IBM Corp.
- LogicManager Inc.
- MetricStream Inc.
- Noggin Corp.
- OneTrust LLC.
- Origami Risk LLC.
- Premier Continuum Inc.
- Protecht Group.
- Quantivate LLC.
- Resilinc Corp.
- Riskonnect Inc.
- SAI360 Inc.
- ServiceNow Inc.
- Wolters Kluwer NV
Qualitative and quantitative analysis of companies has been conducted to help clients understand the wider business environment as well as the strengths and weaknesses of key industry players. Data is qualitatively analyzed to categorize companies as pure play, category-focused, industry-focused, and diversified; it is quantitatively analyzed to categorize companies as dominant, leading, strong, tentative, and weak.
Recent Developments in the Operational Resilience Management Platforms Market
- In January 2025, the European Union commenced the full enforcement of the Digital Operational Resilience Act (DORA), a comprehensive framework mandating rigorous testing and risk management protocols for financial institutions and their critical third-party providers.
- In March 2025, Archer Integrated Risk Management introduced an advanced generative AI engine within its platform, enabling users to automatically generate detailed operational resilience scenarios based on company-specific risk profiles and global threat telemetry.
- In April 2025, the US Cybersecurity and Infrastructure Security Agency (CISA) initiated a resilience enhancement program focused on securing operational technology in municipal water systems against evolving digital threats, underscoring the need for robust management platforms.
- In May 2025, the Australian Prudential Regulation Authority (APRA) finalized CPS 230, a comprehensive operational resilience standard requiring financial entities to define, maintain, and test clear tolerance levels for disruptions to critical services.
Research Analyst Overview: Operational Resilience Management Platforms Market
A fundamental shift toward a unified risk posture is defining capital allocation in the operational resilience management platforms market, where the software segment constitutes over 65% of total revenue. Board-level investment decisions are increasingly driven by the need for integrated governance, risk, and compliance (GRC) capabilities that satisfy auditors and regulators.
The implementation of robust business continuity planning and cybersecurity framework integration is no longer a discretionary IT function but a core business mandate under frameworks like ISO 22301. Organizations are deploying platforms that offer advanced predictive stress testing and disaster recovery orchestration to move from a reactive to a proactive stance.
These systems provide deep fourth-party risk visibility and enable comprehensive impact tolerance testing, which is critical for complex global enterprises. The ability to conduct detailed threat simulation and automate regulatory compliance reporting allows leadership to manage risk more effectively and ensure operational integrity in the face of systemic threats.
Dive into Technavio’s robust research methodology, blending expert interviews, extensive data synthesis, and validated models for unparalleled Operational Resilience Management Platforms Market insights. See full methodology.
| Market Scope | |
|---|---|
| Page number | 285 |
| Base year | 2025 |
| Historic period | 2020-2024 |
| Forecast period | 2026-2030 |
| Growth momentum & CAGR | Accelerate at a CAGR of 15.3% |
| Market growth 2026-2030 | USD 3745.7 million |
| Market structure | Fragmented |
| YoY growth 2025-2026(%) | 14.6% |
| Key countries | US, Canada, Mexico, Germany, UK, France, Italy, Spain, The Netherlands, China, India, Japan, Australia, South Korea, Indonesia, Brazil, Argentina, Colombia, Saudi Arabia, UAE, South Africa, Israel and Turkey |
| Competitive landscape | Leading Companies, Market Positioning of Companies, Competitive Strategies, and Industry Risks |
Operational Resilience Management Platforms Market: Key Questions Answered in This Report
-
What is the expected growth of the Operational Resilience Management Platforms Market between 2026 and 2030?
-
The Operational Resilience Management Platforms Market is expected to grow by USD 3.75 billion during 2026-2030, registering a CAGR of 15.3%. Year-over-year growth in 2026 is estimated at 14.6%%. This acceleration is shaped by escalating regulatory compliance requirements, which is intensifying demand across multiple end-use verticals covered in the report.
-
-
What segmentation does the market report cover?
-
The report is segmented by Component (Software, and Services), Deployment (Cloud based, and On premises), Business Segment (Large enterprises, and Small and medium enterprises) and Geography (North America, Europe, APAC, South America, Middle East and Africa). Among these, the Software segment is estimated to witness significant growth during the forecast period, driven by rising adoption across key application areas. Each segment includes detailed qualitative and quantitative analysis, along with historical data from 2020-2024 and forecasts through 2030 with year-over-year growth rates.
-
-
Which regions are analyzed in the report?
-
The report covers North America, Europe, APAC, South America and Middle East and Africa. North America is estimated to contribute 41.7% to market growth during the forecast period. Country-level analysis includes US, Canada, Mexico, Germany, UK, France, Italy, Spain, The Netherlands, China, India, Japan, Australia, South Korea, Indonesia, Brazil, Argentina, Colombia, Saudi Arabia, UAE, South Africa, Israel and Turkey, with dedicated market size tables and year-over-year growth for each.
-
-
What are the key growth drivers and market challenges?
-
The primary driver is escalating regulatory compliance requirements, which is accelerating investment and industry demand. The main challenge is data fragmentation and legacy system integration, creating operational barriers for key market participants. The report quantifies the impact of each driver and challenge across 2026 and 2030 with comparative analysis.
-
-
Who are the major players in the Operational Resilience Management Platforms Market?
-
Key vendors include AuditBoard Inc., Cutover Ltd., Diligent Corp., Everbridge Inc., F24 AG., Fusion Risk Management Inc., IBM Corp., LogicManager Inc., MetricStream Inc., Noggin Corp., OneTrust LLC., Origami Risk LLC., Premier Continuum Inc., Protecht Group., Quantivate LLC., Resilinc Corp., Riskonnect Inc., SAI360 Inc., ServiceNow Inc. and Wolters Kluwer NV. The report provides qualitative and quantitative analysis categorizing companies as dominant, leading, strong, tentative, and weak based on their market positioning. Company profiles include business segment analysis, SWOT assessment, key offerings, and recent strategic developments.
-
Operational Resilience Management Platforms Market Research Insights
Market dynamics are shaped by the dominance of cloud-based deployments and the software segment, which together enable agile resilience orchestration and an automated compliance workflow. The demand for crisis management platforms that provide service continuity assurance is intensifying under regulatory frameworks like the Digital Operational Resilience Act (DORA).
Enterprises now require a single source of truth for real-time telemetry monitoring and runbook automation to reduce recovery times. This shift compels organizations to adopt platforms that facilitate cross-functional collaboration tools and proactive threat detection, moving beyond simple checklists to a state of continuous readiness and ensuring operational integrity.
We can help! Our analysts can customize this operational resilience management platforms market research report to meet your requirements.
 RIA -
RIA - 
