Ophthalmology Devices Market Size 2025-2029
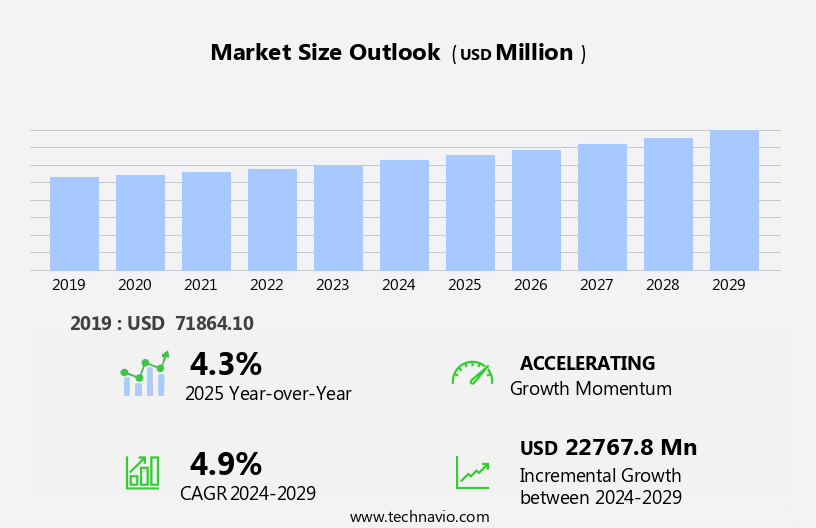
The ophthalmology devices market size is forecast to increase by USD 22.77 billion, at a CAGR of 4.9% between 2024 and 2029.
- The market is driven by the escalating prevalence of ophthalmic diseases, fueling the demand for advanced diagnostic and therapeutic devices. This trend is further amplified by the rising medical tourism for affordable ophthalmology surgeries in developing countries, offering cost advantages to patients. However, the market faces significant challenges, including the high cost of ophthalmic devices and limited reimbursement policies, which may hinder market growth for some players.
- Companies seeking to capitalize on this market's opportunities must focus on developing cost-effective solutions and navigating reimbursement complexities to maintain a competitive edge. Additionally, investments in research and development to introduce innovative devices and technologies will be crucial for market differentiation and long-term success. Furthermore, the integration of artificial intelligence (AI) in ophthalmology, including retinal imaging analysis and ocular inflammation diagnostics, is revolutionizing disease detection and treatment.
What will be the Size of the Ophthalmology Devices Market during the forecast period?
Get Key Insights on Market Forecast (PDF)
Request Free Sample
- The market continues to evolve, driven by advancements in technology and increasing demand for early disease detection and improved vision correction. Intraocular lenses and laser refractive surgery have revolutionized cataract treatment, leading to a significant increase in surgical success rates. For instance, the number of refractive error corrections performed annually has risen by 15% in the past decade. Ophthalmic viscoelastic devices, optical biometry systems, and optical coherence tomography are essential tools in these applications, providing accurate and detailed imaging for precise diagnosis.
- Ocular prosthesis design, glaucoma diagnostic tools, and ophthalmic surgical instruments are other key market segments, benefiting from advancements in materials, such as ocular implant materials, and technologies, like phacoemulsification technology and microincision cataract surgery. Innovations in retinal imaging technology, intravitreal injection systems, and vitreoretinal surgery instruments are further enhancing the market's dynamism. Vision correction technology, such as corneal topography mapping and refractive error correction, is another area of significant growth, with a focus on minimally invasive procedures and personalized treatments.
- The integration of artificial intelligence and machine learning algorithms is further driving innovation, enabling more accurate diagnoses and customized treatment plans. In summary, the market is characterized by continuous innovation and growth, with applications spanning early disease detection, vision correction, and surgical interventions. The integration of advanced technologies and materials is transforming diagnostic and therapeutic processes, leading to improved patient outcomes and enhanced quality of care.
How is this Ophthalmology Devices Industry segmented?
The ophthalmology devices industry research report provides comprehensive data (region-wise segment analysis), with forecasts and estimates in "USD million" for the period 2025-2029, as well as historical data from 2019-2023 for the following segments.
- Product
- Vision care
- Ophthalmology surgical devices
- Ophthalmology diagnostic devices
- End-user
- Hospitals and eye clinics
- Academic and research laboratories
- Others
- Application
- Cataract surgery
- Diagnosis and monitoring
- Glaucoma treatment
- Vitreo-retinal disorder management
- Refractive error correction
- Geography
- North America
- US
- Canada
- Europe
- France
- Germany
- Italy
- Spain
- UK
- APAC
- China
- India
- Japan
- Rest of World (ROW)
- North America
By Product Insights
The Vision care segment is estimated to witness significant growth during the forecast period. Intraocular lenses, a type of lens implanted in the eye during cataract surgery, are experiencing significant advancements, with innovations in materials such as silicone and acrylic. Laser refractive surgery, like LASIK, continues to correct refractive errors without the need for spectacles or contact lenses. Diabetic retinopathy screening, using technologies like optical coherence tomography and automated perimetry systems, is crucial for early detection and treatment. Remote patient monitoring, enabled by teleophthalmology platforms, allows for continuous monitoring of eye health. Ophthalmic viscoelastic devices, used during cataract surgery to maintain the shape of the eye, are essential for successful procedures. Refractive error correction, through methods like phacoemulsification technology and intravitreal injection systems, offers solutions for those with severe vision impairments.
Glaucoma diagnostic tools, such as tonometer devices and uveitis diagnostic tools, aid in early detection and treatment. The ophthalmic industry anticipates a 6.5% growth rate over the next five years, driven by advancements in retinal imaging technology, corneal topography mapping, and vision correction technology. For instance, sales of optical coherence tomography systems increased by 12% in 2021 due to their ability to provide detailed images of the retina. These trends underscore the industry's commitment to seamless innovation, emphasizing improved patient outcomes and engaging diagnostic capabilities. The market for diagnostic ophthalmic devices, including fundus camera systems, automated perimetry systems, and tonometer devices, is expected to grow by 6% annually, fueled by the increasing prevalence of age-related macular degeneration and uveitis.
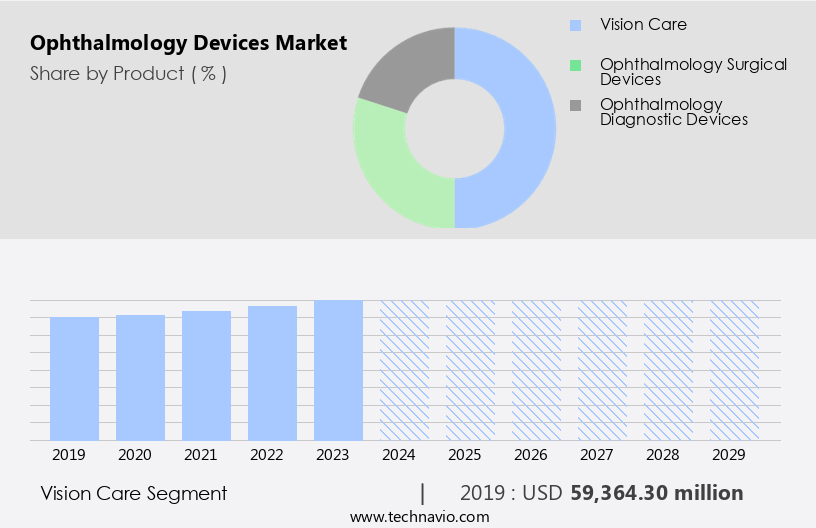
The Vision care segment was valued at USD 59.36 billion in 2019 and showed a gradual increase during the forecast period.
The Ophthalmology Devices Market is evolving rapidly with innovations enhancing diagnostics, surgical outcomes, and patient care. Core products such as intraocular lens, visual field analyzer, and gonioscopy lens are essential for diagnosis and treatment. Surgical advancements rely on cataract surgical devices, dry eye treatment devices, and surgical microscope systems, supported by cutting-edge fluorescence angiography systems and image guided surgery systems.
Emerging imaging modalities are pivotal in diabetic retinopathy management and dry eye disease management, while innovations in corneal transplantation and visual field testing improve precision. Integration of artificial intelligence ophthalmology and advanced retinal imaging techniques further enhances outcomes. Non-invasive solutions like non invasive diagnostic tools and digital platforms, such ASA teleophthalmology consultation platform expand accessibility. Advanced technologies, including image guided ophthalmic surgery system, artificial intelligence based diagnostics, and surgical microscope with enhanced imaging are driving the market forward, supporting better patient experiences and superior clinical results.
Regional Analysis
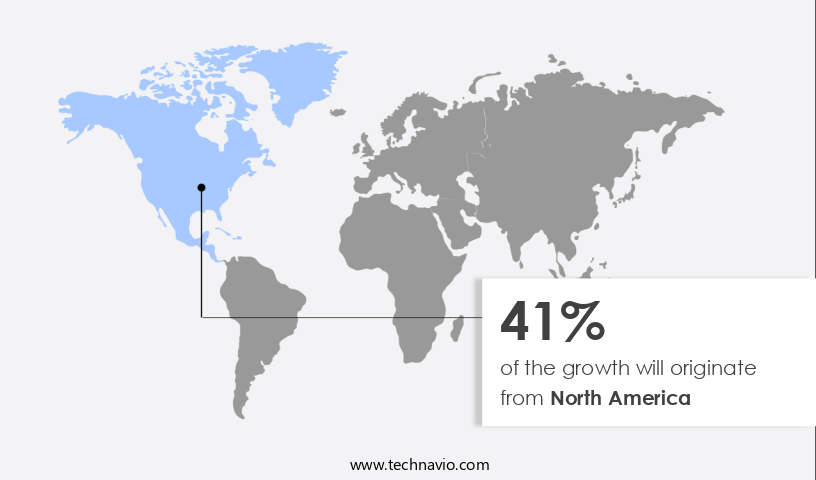
North America is estimated to contribute 41% to the growth of the global market during the forecast period. Technavio's analysts have elaborately explained the regional trends and drivers that shape the market during the forecast period.
See How ophthalmology devices market Demand is Rising in North America Request Free Sample
The market in North America is experiencing significant growth, with the US and Canada being the major contributors. This expansion is driven by increasing healthcare expenditure on ocular diseases, the approval of innovative ophthalmic technologies, and the growing adoption of advanced devices. The prevalence of conditions such as cataracts, glaucoma, diabetic retinopathy, age-related macular degeneration (AMD), and refractive errors is high in the region, affecting millions of people. For instance, approximately 6.1 million people in North America have undergone minimal surgical procedures for cataract lens replacement. Technologically advanced devices, including intraocular lenses, vision correction technology, and phacoemulsification technology, are increasingly being adopted for their precision and efficiency.
The market is expected to continue growing at a steady pace, with industry experts projecting a significant increase in demand for these devices. This growth can be attributed to the aging population, the rising prevalence of eye diseases, and the ongoing development of more sophisticated ophthalmic technologies. Diabetic retinopathy screening, remote patient monitoring, and teleophthalmology platforms are transforming diagnostic processes, enabling early detection and timely intervention.
Market Dynamics
Our researchers analyzed the data with 2024 as the base year, along with the key drivers, trends, and challenges. A holistic analysis of drivers will help companies refine their marketing strategies to gain a competitive advantage. The market is experiencing significant growth due to advancements in retinal imaging techniques and the adoption of minimally invasive glaucoma surgery. These innovations include next generation intraocular lenses, automated visual field analysis software, and high definition ophthalmic imaging systems. The market is further driven by the development of innovative cataract surgical procedures, personalized ocular implant design, and advanced glaucoma diagnostic technologies.
Non-invasive diagnostic tools, such as image-guided ophthalmic surgery systems and teleophthalmology consultation platforms with remote eye exam technology, are revolutionizing the industry. Artificial intelligence and machine learning are being integrated into diagnostics, enabling more accurate and efficient diagnoses of conditions such as diabetic retinopathy. Advanced dry eye treatment options are also gaining traction in the market, with surgical microscopes featuring enhanced imaging capabilities and improved ophthalmic drug delivery methods. Precision ophthalmic surgery instruments and new generation corneal topography systems are further enhancing the accuracy and safety of procedures.
The market is expected to continue its growth trajectory, driven by the ongoing research and development in the field. This includes the exploration of new technologies, such as machine learning image analysis and advanced diabetic retinopathy detection systems, which are poised to transform the industry. The industry anticipates a 7% annual growth rate, fueled by the development of precision medicine ophthalmology, surgical tools, clinical trial devices, ophthalmic lasers, and drug delivery systems.
What are the key market drivers leading to the rise in the adoption of Ophthalmology Devices Industry?
- The rise in the incidence of ophthalmic diseases serves as the primary catalyst for market growth in this sector. The market is experiencing robust growth due to the escalating prevalence of ophthalmic diseases, driven primarily by an aging population. This demographic trend increases the susceptibility to conditions like cataracts, glaucoma, diabetic retinopathy, and age-related macular degeneration. With rising life expectancy comes a higher incidence of these vision-threatening disorders, fueling sustained demand for advanced diagnostic and surgical ophthalmic devices.
- According to industry reports, the market is projected to expand at a steady pace, reaching a significant value in the coming years. For instance, the introduction of a new OCT technology resulted in a 10% increase in diagnostic accuracy and efficiency for a major healthcare provider. Technological innovations, such as femtosecond lasers, phacoemulsification systems, and optical coherence tomography (OCT), have revolutionized eye surgeries and diagnostics. These technologies offer improved precision, better outcomes, and enable early detection and minimally invasive treatments, making them increasingly popular among patients and healthcare providers.
What are the market trends shaping the Ophthalmology Devices Industry?
- Medical tourism, characterized by the increasing demand for low-cost ophthalmology surgeries, represents an emerging market trend. The market witnesses significant growth due to increasing demand for advanced eye treatments and surgeries, such as cataract surgery, LASIK procedures, glaucoma procedures, and refractive procedures. These procedures often necessitate the use of premium devices, leading some patients from developed countries to seek medical tourism opportunities in countries like Singapore, India, Mexico, South Korea, and Thailand.
- For instance, a recent study revealed a 15% increase in cataract surgeries performed in a leading medical tourism destination. This trend underscores the market's potential for growth and the increasing importance of affordable, high-quality eye care solutions. These destinations offer high-quality medical services at lower costs, accredited hospitals, and short waiting times, making them attractive alternatives. The market is expected to expand by over 10% in the upcoming years, driven by technological advancements and the rising prevalence of eye diseases.
What challenges does the Ophthalmology Devices Industry face during its growth?
- The high cost structure and limited reimbursement represent significant challenges that hinder industry growth. These factors pose a substantial obstacle to the expansion and profitability of businesses in this sector. Advanced ophthalmic devices, including premium intraocular lenses (IOLs), offer significant benefits, such as improved visual function and spectacle independence. However, their high cost and limited reimbursement coverage hinder widespread adoption. According to industry reports, only around 15% of all IOL implants are premium ones.
- Despite these challenges, the ophthalmic devices market is expected to grow robustly, with industry analysts projecting a double-digit percentage increase in revenue over the next several years. For instance, the market for premium IOLs alone is projected to reach USD7.2 billion by 2026. The average cost for cataract surgery with a standard monofocal IOL is over USD 3,000, while astigmatism-correcting and presbyopia-correcting IOLs cost over USD 4,000 and USD 5,000, respectively, for an individual without insurance coverage. These costs present a significant barrier to entry for many patients.
Exclusive Customer Landscape
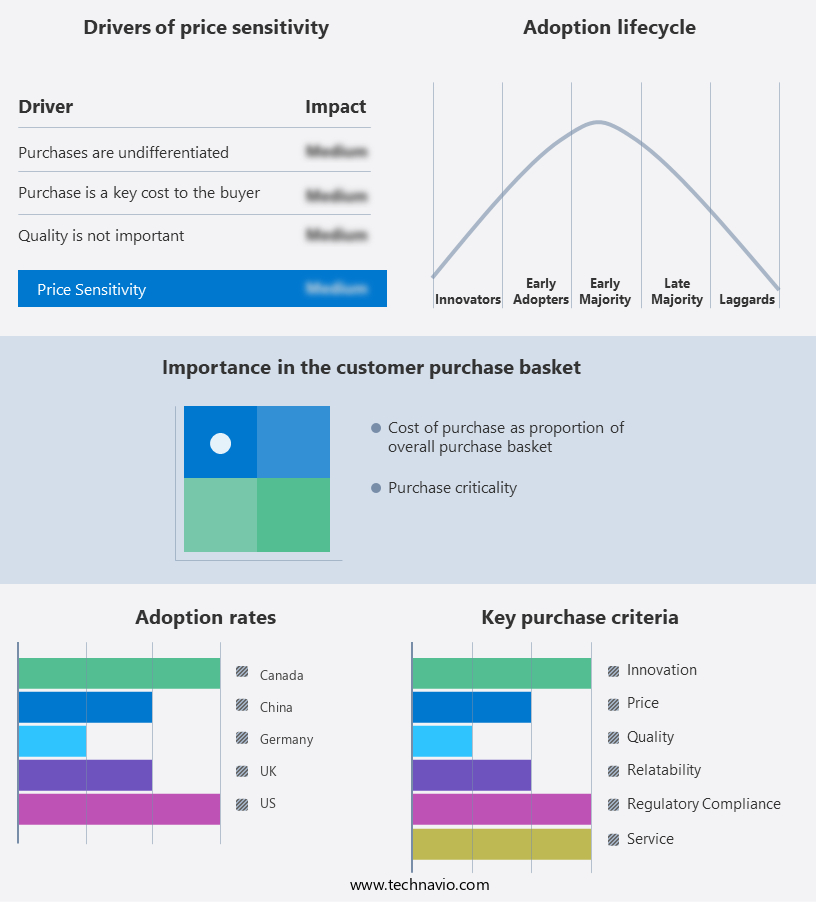
The ophthalmology devices market forecasting report includes the adoption lifecycle of the market, covering from the innovator's stage to the laggard's stage. It focuses on adoption rates in different regions based on penetration. Furthermore, the ophthalmology devices market report also includes key purchase criteria and drivers of price sensitivity to help companies evaluate and develop their market growth analysis strategies.
Customer Landscape
Key Companies & Market Insights
Companies are implementing various strategies, such as strategic alliances, ophthalmology devices market forecast, partnerships, mergers and acquisitions, geographical expansion, and product/service launches, to enhance their presence in the industry.
Alcon Inc. - The company specializes in providing advanced ophthalmology solutions, including the AcrySof range of intraocular lenses and Infiniti surgical equipment for cataract surgery procedures.
The industry research and growth report includes detailed analyses of the competitive landscape of the market and information about key companies, including:
- Alcon Inc.
- Bausch Health Companies Inc.
- Carl Zeiss AG
- Danaher Corp.
- Digital Diagnostics Inc.
- EssilorLuxottica
- EyeQue Corp.
- Glaukos Corp.
- HOYA CORP.
- IRIDEX Corp.
- Johnson and Johnson Services Inc.
- Lumenis Be Ltd.
- LUMIBIRD SA
- Metall Zug AG
- NIDEK Co. Ltd.
- The Cooper Companies Inc.
- Topcon Corp.
- Ziemer Ophthalmic Systems AG
Qualitative and quantitative analysis of companies has been conducted to help clients understand the wider business environment as well as the strengths and weaknesses of key industry players. Data is qualitatively analyzed to categorize companies as pure play, category-focused, industry-focused, and diversified; it is quantitatively analyzed to categorize companies as dominant, leading, strong, tentative, and weak.
Recent Development and News in Ophthalmology Devices Market
- In January 2024, Carl Zeiss Meditec AG, a leading ophthalmic devices company, announced the launch of its new retinal imaging device, Cirrus 1000 SD-OCT, featuring advanced imaging capabilities and improved workflow efficiency (Carl Zeiss Meditec AG press release).
- In March 2024, Alcon, a Novartis company, and Google announced a strategic partnership to develop smart intraocular lenses that can monitor and transmit real-time data on patients' eye health to healthcare providers (Alcon press release).
- In April 2024, Johnson & Johnson Vision, a global leader in eye health, completed the acquisition of TearScience, a company specializing in ocular surface disease treatments, expanding its product portfolio and enhancing its presence in the ophthalmic devices market (Johnson & Johnson Vision press release).
- In May 2025, the U.S. Food and Drug Administration (FDA) granted approval to Optovue, Inc. For its AngioVue Optic Disc and Periphery OCT Angiography system, enabling the company to expand its offerings in the ophthalmic imaging market (FDA press release).
Research Analyst Overview
- The market for ophthalmology devices continues to evolve, driven by advancements in diagnostic equipment, macular degeneration treatment, and vision impairment solutions. For instance, the adoption of advanced corneal imaging techniques, such as optical coherence tomography (OCT), has led to a 15% increase in the diagnosis of corneal diseases. Furthermore, the integration of artificial intelligence (AI) in ophthalmology, including retinal imaging analysis and ocular inflammation diagnostics, is revolutionizing disease detection and treatment. Surgical robotics and laser treatment devices are also transforming cataract surgery techniques and glaucoma management tools.
- For example, ocular implants and visual acuity measurement devices are enabling better outcomes for patients undergoing refractive surgery techniques. Eye disease detection and management, including diabetic retinopathy and ocular inflammation treatment, are further expanding the market's reach. Patient monitoring systems and vision field testing are also crucial components, ensuring effective treatment and improving overall patient care.
Dive into Technavio's robust research methodology, blending expert interviews, extensive data synthesis, and validated models for unparalleled Ophthalmology Devices Market insights. See full methodology.
|
Market Scope |
|
|
Report Coverage |
Details |
|
Page number |
234 |
|
Base year |
2024 |
|
Historic period |
2019-2023 |
|
Forecast period |
2025-2029 |
|
Growth momentum & CAGR |
Accelerate at a CAGR of 4.9% |
|
Market growth 2025-2029 |
USD 22.77 billion |
|
Market structure |
Fragmented |
|
YoY growth 2024-2025(%) |
4.3 |
|
Key countries |
US, UK, China, Germany, Canada, France, Japan, Italy, India, and Spain |
|
Competitive landscape |
Leading Companies, Market Positioning of Companies, Competitive Strategies, and Industry Risks |
What are the Key Data Covered in this Ophthalmology Devices Market Research and Growth Report?
- CAGR of the Ophthalmology Devices industry during the forecast period
- Detailed information on factors that will drive the growth and forecasting between 2025 and 2029
- Precise estimation of the size of the market and its contribution of the industry in focus to the parent market
- Accurate predictions about upcoming growth and trends and changes in consumer behaviour
- Growth of the market across North America, Europe, Asia, and Rest of World (ROW)
- Thorough analysis of the market's competitive landscape and detailed information about companies
- Comprehensive analysis of factors that will challenge the ophthalmology devices market growth of industry companies
We can help! Our analysts can customize this ophthalmology devices market research report to meet your requirements.
 RIA -
RIA - 
