
Organic Solvents Market Size 2024-2028
The organic solvents market size is forecast to increase by USD 4.38 billion at a CAGR of 5.24% between 2023 and 2028.
- Organic solvents are essential ingredients in various industries, including coatings, pharmaceuticals, and agriculture. The market is experiencing significant growth due to increasing demand for durable and high-performance coatings, paints and coatings, and textiles, all of which rely on these solvents for enhanced quality and performance. Additionally, the rise of digitalization and automation in organic solvent manufacturing is driving market expansion. However, the high manufacturing cost of green and bio-based organic solvents poses a challenge to market growth. Producers are investing in research and development to create cost-effective and eco-friendly alternatives. The market is expected to witness steady growth in the coming years, with a focus on sustainability and innovation. Organic solvents play a crucial role in enhancing product quality and efficiency across multiple industries, making them an indispensable component in the global chemical market.
What will be the Size of the Organic Solvents Market During the Forecast Period?

- The market encompasses the production and supply of various chemical compounds used as solvents in diverse industries. Key end-use sectors include pharmaceuticals, construction, and personal care, with solvents playing essential roles in processing technologies such as membrane systems for solvent dehydration and heat and pressure-driven reactions. Eco-friendly solvents, like Daxsol dimethyl carbonate, are gaining traction due to increasing emphasis on environmental sustainability.
- Moreover, these solvents are integral to the production of specialty chemicals, materials, and solutes, with carbon-based solvents derived from living organisms and synthetic solvents made from carbon atoms being commonly used. Industries such as pharmaceuticals, cosmetics, and construction rely on these solvents for their unique properties in chemical reactions. Organic solvent suppliers cater to the needs of these sectors, offering a range of offerings from styrene and trichlorethylene to ethylene glycol ether.
How is this Organic Solvents Industry segmented and which is the largest segment?
The industry research report provides comprehensive data (region-wise segment analysis), with forecasts and estimates in "USD billion" for the period 2024-2028, as well as historical data from 2018-2022 for the following segments.
- Type
- Aromatic hydrocarbons
- Aliphatic hydrocarbons
- Alcohols
- Ketones
- Others
- End-user
- Paints and Coatings
- Pharmaceuticals
- Adhesives
- Printing Inks
- Others
- Geography
- APAC
- China
- India
- Japan
- North America
- US
- Europe
- Germany
- UK
- South America
- Middle East and Africa
- APAC
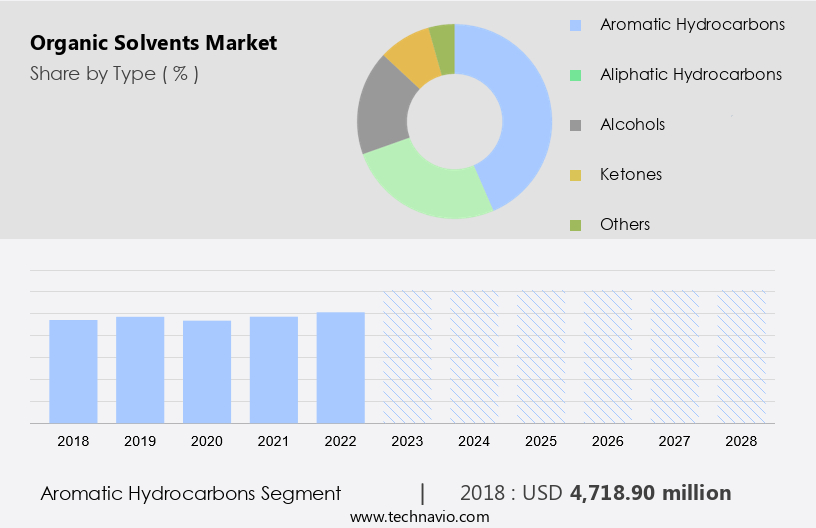
By Type Insights
- The aromatic hydrocarbons segment is estimated to witness significant growth during the forecast period.
Organic solvents, including aromatic hydrocarbons like benzene, toluene, and xylene, are integral to the chemical industry as feedstocks for producing various chemicals and products. These solvents are used in the production of ethylbenzene, which is further processed into styrene for polystyrene and polyethylene terephthalate (PET), extensively utilized in packaging, automotive, and consumer goods. Aromatic hydrocarbons contribute to the production of high-octane fuels and fuel additives, with demand influenced by gasoline and diesel consumption. In the manufacturing sector, they are used for producing automotive parts, such as synthetic rubber for tires and plastic components. The pharmaceutical sector relies on these solvents for various applications, including solvent production, membrane systems, dehydrating organic solvents, and precision cleaning.
Get a glance at the Industry report of share of various segments Request Free Sample
The aromatic hydrocarbons segment was valued at USD 4.72 billion in 2018 and showed a gradual increase during the forecast period.
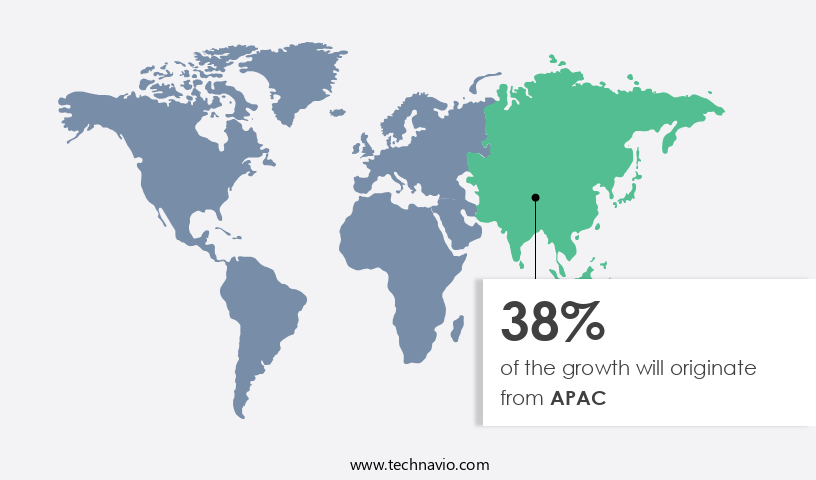
Regional Analysis
- APAC is estimated to contribute 38% to the growth of the global market during the forecast period.
Technavio's analysts have elaborately explained the regional trends and drivers that shape the market during the forecast period.
For more insights on the market share of various regions, Request Free Sample
Organic solvents are essential ingredients in various industries across Asia Pacific (APAC), including automotive, electronics, chemicals, textiles, and construction. The region's industrial growth, driven by countries like China, India, Japan, and South Korea, fuels the demand for these solvents. Rapid urbanization and infrastructure development in APAC nations are increasing the usage of paints, coatings, and adhesives, which heavily rely on these solvents. Moreover, economic growth in countries such as India, Japan, and Australia is leading to increased industrial activity and consumption of solvent-based products. The expanding middle class in APAC is also driving higher demand for consumer goods, personal care products, and pharmaceuticals, all of which utilize these solvents in their manufacturing processes.
Market Dynamics
Our researchers analyzed the data with 2023 as the base year, along with the key drivers, trends, and challenges. A holistic analysis of drivers will help companies refine their marketing strategies to gain a competitive advantage.
What are the key market drivers leading to the rise in the adoption of Organic Solvents Industry?
Growing demand for durable and high-performance coatings is the key driver of the market.
- The growing demand for durable and high-performance coatings is influenced by industries requiring advanced coatings that offer superior protection and aesthetic appeal. The construction sector extensively uses high-performance coatings to protect buildings and infrastructure from environmental damage, corrosion, and wear. These solvents are crucial in formulating these coatings, ensuring proper application and performance. Automotive manufacturers require durable coatings for vehicles to enhance appearance, provide corrosion resistance, and ensure longevity.
- Moreover, these solvents help in achieving the desired finish and durability in automotive coatings. High-performance coatings are essential in the aerospace industry to protect aircraft from extreme conditions, corrosion, and wear. These solvents play a key role in formulating these specialized coatings. Additionally, industries such as oil and gas, marine, and industrial manufacturing rely on coatings that protect equipment and structures from corrosion. Organic solvents are used to dissolve and blend the components of these protective coatings. High-performance coatings that withstand high temperatures and chemical exposure are in demand across various industries. Organic solvents ensure the proper mixing and application of these coatings.
What are the market trends shaping the Organic Solvents Industry?
The rise of digitalization and automation in organic solvent manufacturing is the upcoming market trend.
- Automation in manufacturing processes allows for continuous production with minimal human intervention. This leads to consistent product quality, increased production speed, and reduced labor costs. The use of robotic systems for handling and packaging solvents ensures precision and safety, reducing the risk of contamination and human error.
- Moreover, digital sensors and Internet of Things (IoT) devices enable real-time monitoring of production parameters such as temperature, pressure, and chemical concentrations. This allows for immediate adjustments to maintain optimal conditions. Data analytics and machine learning algorithms predict equipment failures before they occur, reducing downtime and maintenance costs. Additionally, automated systems optimize energy use in manufacturing processes, reducing operational costs and the environmental footprint. Precise control of manufacturing processes minimizes waste generation, contributing to sustainability and cost savings.
What challenges does the Organic Solvents Industry face during its growth?
The high manufacturing cost of green and bio-based organic solvents is a key challenge affecting the industry growth.
- The relatively higher price of bio-based organic solvents, when compared with petroleum-based conventional chemicals, is a challenge faced by the global organic solvents market. The lack of feedstock increases the prices of green and bio-based organic solvents. Usually, green and bio-based organic solvents are more expensive than traditional organic solvents, which makes the recycling of these alternatives highly important.
- Moreover, prices of green and bio-based organic solvents can be 3-5 times higher than alcohol, acetate, ketone, and other organic solvents due to the limited availability of feedstock for green and bio-based organic solvents. Green and bio solvents are manufactured from plant and animal sources, such as carbohydrates, carbohydrate polymers, proteins, alkaloids, plant oils, and animal fats, along with cornstarch, vegetable fats, oils, straw, food waste, and woodchips. Moreover, the price of plant oils and animal fats is increasing. Increased competition for animal fats from other end-use sectors also contributes to higher prices.
Exclusive Customer Landscape
The solvents market forecasting report includes the adoption lifecycle of the market, covering from the innovator's stage to the laggard's stage. It focuses on adoption rates in different regions based on penetration. Furthermore, the solvents market report also includes key purchase criteria and drivers of price sensitivity to help companies evaluate and develop their market growth analysis strategies.

Customer Landscape
Key Companies & Market Insights
Companies are implementing various strategies, such as strategic alliances, solvents market forecast, partnerships, mergers and acquisitions, geographical expansion, and product/service launches, to enhance their presence in the industry.
The industry research and growth report includes detailed analyses of the competitive landscape of the market and information about key companies, including:
- Albemarle Corp.
- Arkema SA
- Ashland Inc.
- BASF SE
- Celanese Corp.
- Central Drug House Pvt. Ltd.
- Clariant AG
- Covestro AG
- Dow Inc.
- Eastman Chemical Co.
- Exxon Mobil Corp.
- Honeywell International Inc.
- Huntsman Corp.
- INEOS AG
- Johnson Matthey Plc
- LyondellBasell Industries N.V.
- Sasol Ltd.
- Shell plc
- Solvay SA
- Synthomer Plc
Qualitative and quantitative analysis of companies has been conducted to help clients understand the wider business environment as well as the strengths and weaknesses of key industry players. Data is qualitatively analyzed to categorize companies as pure play, category-focused, industry-focused, and diversified; it is quantitatively analyzed to categorize companies as dominant, leading, strong, tentative, and weak.
Research Analyst Overview
Organic solvents play a significant role in various industries, particularly in processing technologies for the pharmaceutical sector. The production of these solvents involves intricate processes, which often include the application of heat and pressure to transform chemical compounds. Membrane systems are increasingly being adopted for the dehydration of these solvents due to their energy efficiency and ability to produce high-purity products. These solvents are widely used in manufacturing processes, including the production of eco-friendly solvents. These solvents, such as dimethyl carbonate, are gaining popularity due to their environmental sustainability. Polar solvents, including ketones and esters, are commonly used in specialty applications, while glycerol carbonate is utilized in the production of certain polymers.
Furthermore, the demand for these solvents is driven by their versatility and applicability in various industries. They are used in precision cleaning processes, manufacturing equipment, and as raw materials in the production of various products. However, the use of these solvents is not without risks. Health risks associated with their use include exposure to toxic fumes and potential fire hazards. As the world moves towards carbon neutrality goals, there is a growing focus on the use of renewable resources for solvent production. Natural solvents, such as those derived from plants, are gaining popularity due to their eco-friendly nature. Synthetic solvents, on the other hand, continue to dominate the market due to their high performance and cost-effectiveness.
In addition, organic solvents are used extensively in the petrochemical industries, particularly in the production of aromatic hydrocarbons. They are also used in the production of gasoline, lacquers, and rubber manufacturing. In the paints and thinners industry, aliphatic organic solvents are commonly used for degreasing and cleaning applications. The cosmetic industry is another major consumer of organic solvents. They are used in the production of cleaning products, personal care products, and cosmetics. In the construction sector, organic solvents are used in the production of adhesives, sealants, and coatings. These solvents are also used in the pharmaceutical industry for the production of various drugs and medical products.
Furthermore, they are used as solvents in chemical reactions and as intermediates in the synthesis of complex molecules. In the electronics industry, these solvents are used as cleaning agents and in the production of certain polymers. The organic solvent market is diverse and dynamic, with various players offering a range of products and services. Organic solvent suppliers cater to the needs of various industries, providing specialized solvents for specific applications. Specialty chemicals and diversified materials companies also offer organic solvents as part of their product portfolio. Despite the benefits of these solvents, there are environmental concerns associated with their use.
|
Market Scope |
|
|
Report Coverage |
Details |
|
Page number |
224 |
|
Base year |
2023 |
|
Historic period |
2018-2022 |
|
Forecast period |
2024-2028 |
|
Growth momentum & CAGR |
Accelerate at a CAGR of 5.24% |
|
Market Growth 2024-2028 |
USD 4.38 billion |
|
Market structure |
Fragmented |
|
YoY growth 2023-2024(%) |
4.31 |
|
Key countries |
China, US, Germany, India, UK, and Japan |
|
Competitive landscape |
Leading Companies, Market Positioning of Companies, Competitive Strategies, and Industry Risks |
What are the Key Data Covered in this Market Research and Growth Report?
- CAGR of the industry during the forecast period
- Detailed information on factors that will drive the market growth and forecasting between 2024 and 2028
- Precise estimation of the size of the market and its contribution of the industry in focus to the parent market
- Accurate predictions about upcoming growth and trends and changes in consumer behaviour
- Growth of the market across APAC, North America, Europe, South America, and Middle East and Africa
- Thorough analysis of the market's competitive landscape and detailed information about companies
- Comprehensive analysis of factors that will challenge the market growth of industry companies
We can help! Our analysts can customize this market research report to meet your requirements.
 RIA -
RIA - 
