Packaged Dehydrated Food Market Size 2026-2030
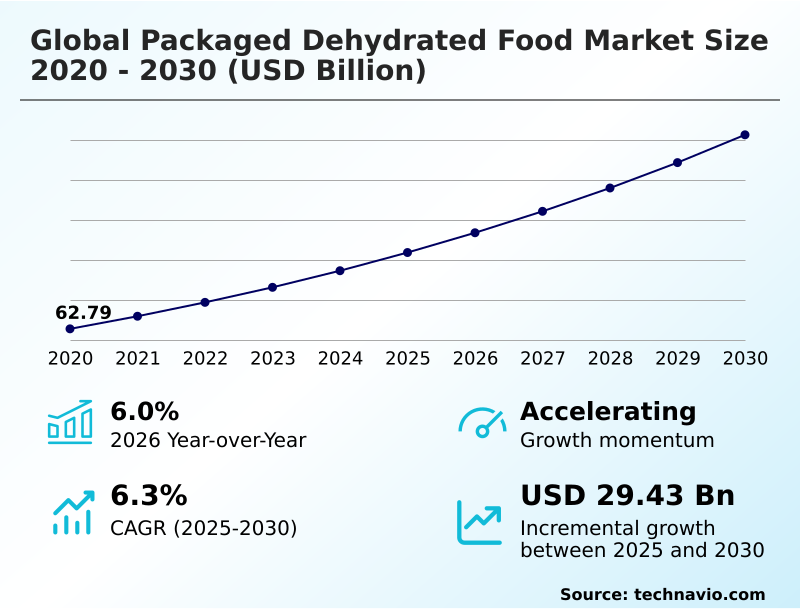
The packaged dehydrated food market size is valued to increase by USD 29.43 billion, at a CAGR of 6.3% from 2025 to 2030. Agentic sublimation and energy-efficient continuous dehydration systems will drive the packaged dehydrated food market.
Major Market Trends & Insights
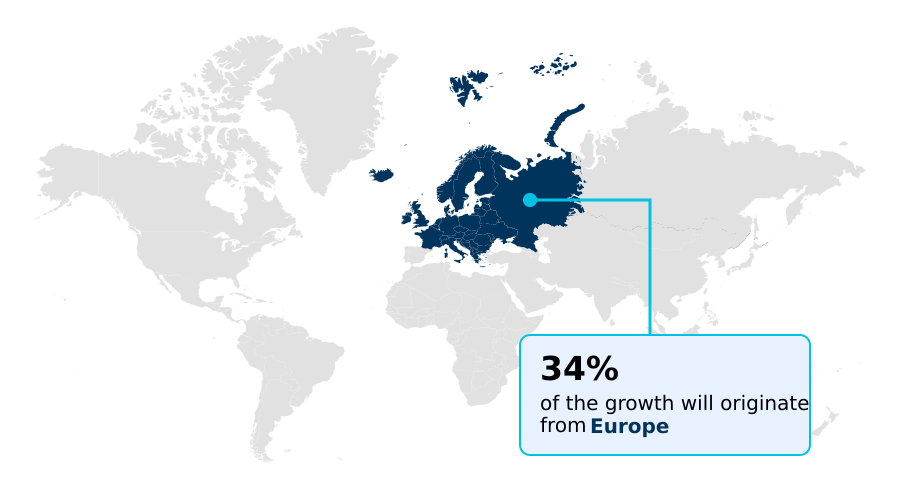
- Europe dominated the market and accounted for a 33.9% growth during the forecast period.
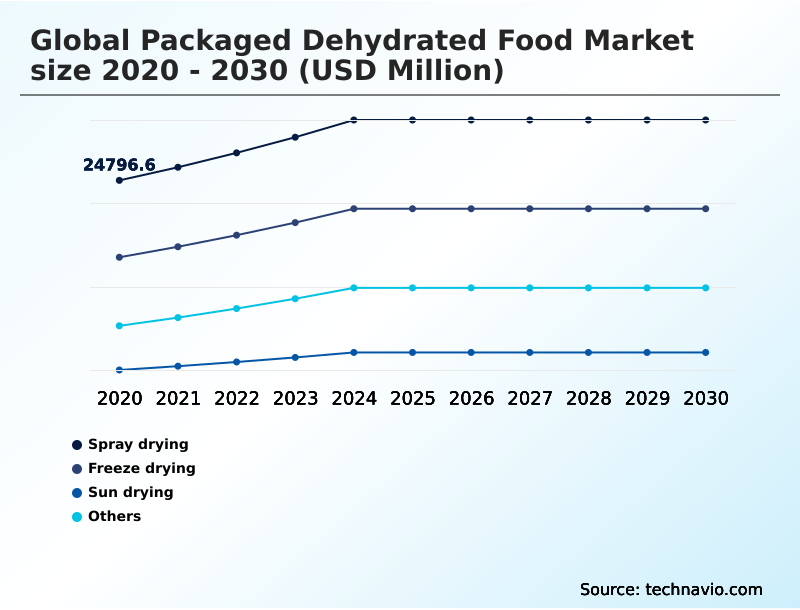
- By Technology - Spray drying segment was valued at USD 30.13 billion in 2024
- By Distribution Channel - Offline segment accounted for the largest market revenue share in 2024
Market Size & Forecast
- Market Opportunities: USD 48.51 billion
- Market Future Opportunities: USD 29.43 billion
- CAGR from 2025 to 2030 : 6.3%
Market Summary
- The packaged dehydrated food market is undergoing a significant transformation, moving beyond basic preservation to focus on high-value nutritional delivery. This evolution is driven by consumer demand for convenient, healthy, and long-lasting food options.
- Advanced techniques such as freeze-drying and vacuum-drying are becoming standard for preserving nutrient retention and the sensory attributes of fresh food, enabling the growth of the clean-label and single-ingredient snacks categories.
- A key business application involves enhancing supply chain resilience; for instance, manufacturers are increasingly using upcycled dehydrated ingredients from agricultural surplus to mitigate raw material price volatility and reduce food waste. This strategy not only improves operational efficiency but also appeals to environmentally conscious consumers. However, the market is not without its challenges.
- The high capital expenditure required for sophisticated dehydration technology creates a barrier for smaller enterprises, while the industry must also contend with competition from fresh and frozen alternatives. The ability to innovate in both processing and product formulation will be critical for sustained success.
What will be the Size of the Packaged Dehydrated Food Market during the forecast period?
Get Key Insights on Market Forecast (PDF) Get Free Sample
How is the Packaged Dehydrated Food Market Segmented?
The packaged dehydrated food industry research report provides comprehensive data (region-wise segment analysis), with forecasts and estimates in "USD million" for the period 2026-2030, as well as historical data from 2020-2024 for the following segments.
- Technology
- Spray drying
- Freeze drying
- Sun drying
- Others
- Distribution channel
- Offline
- Online
- Product type
- Fruits and vegetables
- Dairy
- Meat and seafood
- Others
- Geography
- North America
- US
- Canada
- Mexico
- Europe
- Germany
- France
- UK
- APAC
- China
- India
- Japan
- South America
- Brazil
- Argentina
- Middle East and Africa
- Saudi Arabia
- UAE
- South Africa
- Rest of World (ROW)
- North America
By Technology Insights
The spray drying segment is estimated to witness significant growth during the forecast period.
The spray drying segment is fundamental to the global packaged dehydrated food market 2026-2030, enabling large-scale production of shelf-stable powders from liquid feeds.
This technology, valued for its efficiency in creating products like dairy powders and instant soup mixes, involves atomizing liquids into a hot gas for rapid moisture removal.
Modern systems focus on achieving consistent particle size and moisture content below 5%, a key factor in clean-label formulations. Innovations in spray-drying are enhancing nutrient retention and the preservation of bioactive compounds, making it suitable for functional food ingredients.
The process supports the creation of ready-to-rehydrate meals and other minimal processing solutions that demand high solubility and extended shelf stability, ensuring its continued dominance in industrial food applications.
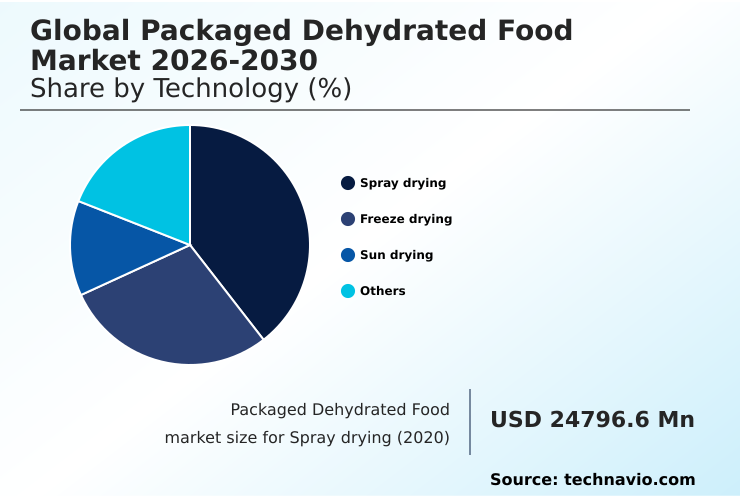
The Spray drying segment was valued at USD 30.13 billion in 2024 and showed a gradual increase during the forecast period.
Regional Analysis
Europe is estimated to contribute 33.9% to the growth of the global market during the forecast period.Technavio’s analysts have elaborately explained the regional trends and drivers that shape the market during the forecast period.
See How Packaged Dehydrated Food Market Demand is Rising in Europe Get Free Sample
The geographic landscape of the global packaged dehydrated food market 2026-2030 is diverse, with regional priorities shaping technology adoption.
In North America and Europe, the focus is on premium, clean-label products, driving investment in freeze-drying to achieve superior structural integrity preservation. In contrast, APAC prioritizes scalability for products like instant soup mixes and beverage powders.
Across Europe, the adoption of solar-assisted drying has reduced energy consumption by up to 25% for small-scale producers. Meanwhile, advanced facilities in North America report over 97% nutrient retention in freeze-dried goods, a key differentiator for functional food ingredients.
Innovations like moisture-sensing labels are becoming crucial in all regions to ensure quality for long-term food storage, reflecting a global push toward higher standards in shelf-stable nutrition and minimal processing.
Market Dynamics
Our researchers analyzed the data with 2025 as the base year, along with the key drivers, trends, and challenges. A holistic analysis of drivers will help companies refine their marketing strategies to gain a competitive advantage.
- Strategic decision-making in the packaged dehydrated food market hinges on a complex interplay of technology, application, and consumer demand. The foundational debate over freeze-drying versus air-drying quality continues to influence investment, with outcomes directly affecting the texture and rehydration quality of freeze-dried meals.
- For industrial applications, the efficiency of spray drying for dairy powders and the use of dehydrated vegetables for instant noodles remain critical. On the consumer front, the emphasis is on clean-label dehydrated snack formulation and the appeal of shelf-stable meal solutions convenience.
- Sustainability is another key pillar, with a focus on reducing food waste with dehydration and incorporating upcycled ingredients in dehydrated foods. This trend supports both cost reduction and brand image. Firms leveraging smart packaging for moisture control report spoilage rates nearly 50% lower than those using standard packaging, significantly impacting supply chain efficiency.
- The high cost of advanced dehydration technology remains a barrier, pushing innovation in energy efficiency of modern dryers. The market is also expanding into niche segments like dehydrated food for emergency preparedness and dehydrated snacks for outdoor activities.
- The use of functional powders from dehydrated superfoods, the impact of dehydration on texture, and the application of dehydrated ingredients for bakery applications are all areas of active development. The ability to ensure long-term storage of dehydrated foods while preserving bioactive compounds will determine future market leaders.
What are the key market drivers leading to the rise in the adoption of Packaged Dehydrated Food Industry?
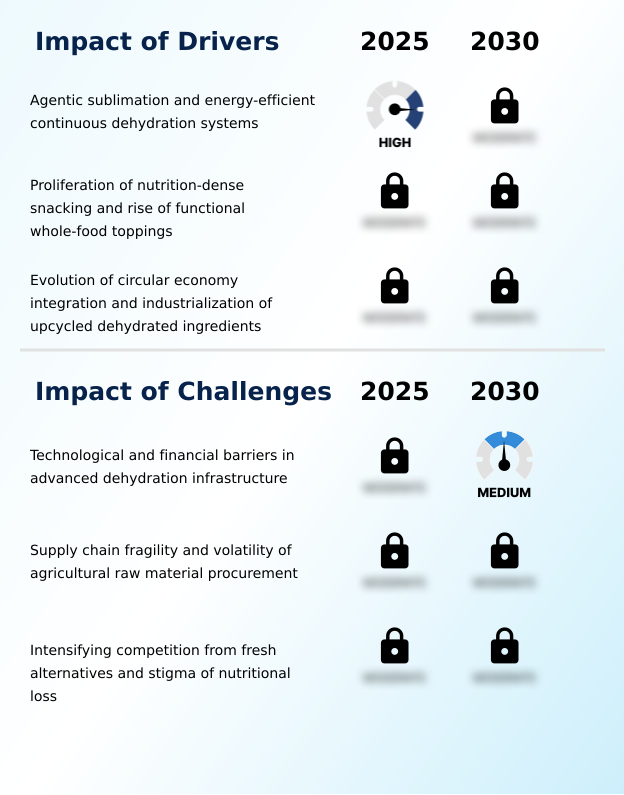
- The adoption of agentic sublimation and energy-efficient continuous dehydration systems is a key driver of market growth.
- Market growth is significantly driven by the convergence of health, convenience, and sustainability. The proliferation of nutrition-dense, single-ingredient snacks aligns with consumer demand for clean-label products, boosting repeat purchase rates by over 20% in this segment.
- On the technology front, the adoption of agentic sublimation and energy-efficient continuous dehydration systems is lowering production barriers. This enables the creation of high-quality plant-based dehydrated meals and other shelf-stable nutrition products.
- Furthermore, the industrialization of upcycled dehydrated ingredients is a critical driver, with processors improving material yield by up to 10% by transforming agricultural by-products into valuable bakery inclusions and pet food ingredients.
- This approach not only enhances the circular economy but also appeals to environmentally conscious consumers.
What are the market trends shaping the Packaged Dehydrated Food Industry?
- The market is trending toward the institutionalization of hybrid dehydration technologies and sophisticated nutrient preservation protocols to enhance product quality and nutritional integrity.
- Key market trends are centered on technological advancements that enhance both convenience and product quality. The institutionalization of hybrid dehydration is enabling manufacturers to produce goods with superior micronutrient preservation. This is complemented by the proliferation of smart packaging solutions; for instance, the use of time-temperature indicators has been shown to reduce spoilage-related returns by 15% for e-commerce vendors.
- Concurrently, the rise of personalized nutrition is driving demand for portion-controlled formats and customized gourmet meal kits, with brands offering such products reporting a customer lifetime value that is 25% higher than those selling in bulk. This shift toward hyper-convenient, ready-to-rehydrate meals and single-ingredient snacks with high nutrient retention is redefining consumer expectations for shelf-stable nutrition.
What challenges does the Packaged Dehydrated Food Industry face during its growth?
- Significant technological and financial barriers associated with advanced dehydration infrastructure present a key challenge to industry growth.
- The market faces considerable challenges related to high capital expenditure and intense competition from fresh alternatives. The initial investment for industrial lyophilization systems can extend the ROI period by 3-5 years compared to traditional setups, creating significant financial barriers. This is compounded by supply chain fragility, where climatic events can disrupt the procurement of raw materials and impact costs.
- Furthermore, consumer perception remains a hurdle. Market data reveals that products perceived as having lower nutrient retention face a 30% higher churn rate when fresh or frozen options are readily available. Overcoming the stigma of nutritional loss and justifying the cost of advanced non-thermal processing technologies are essential for vendors to secure their position against convenient, ready-to-cook solutions.
Exclusive Technavio Analysis on Customer Landscape
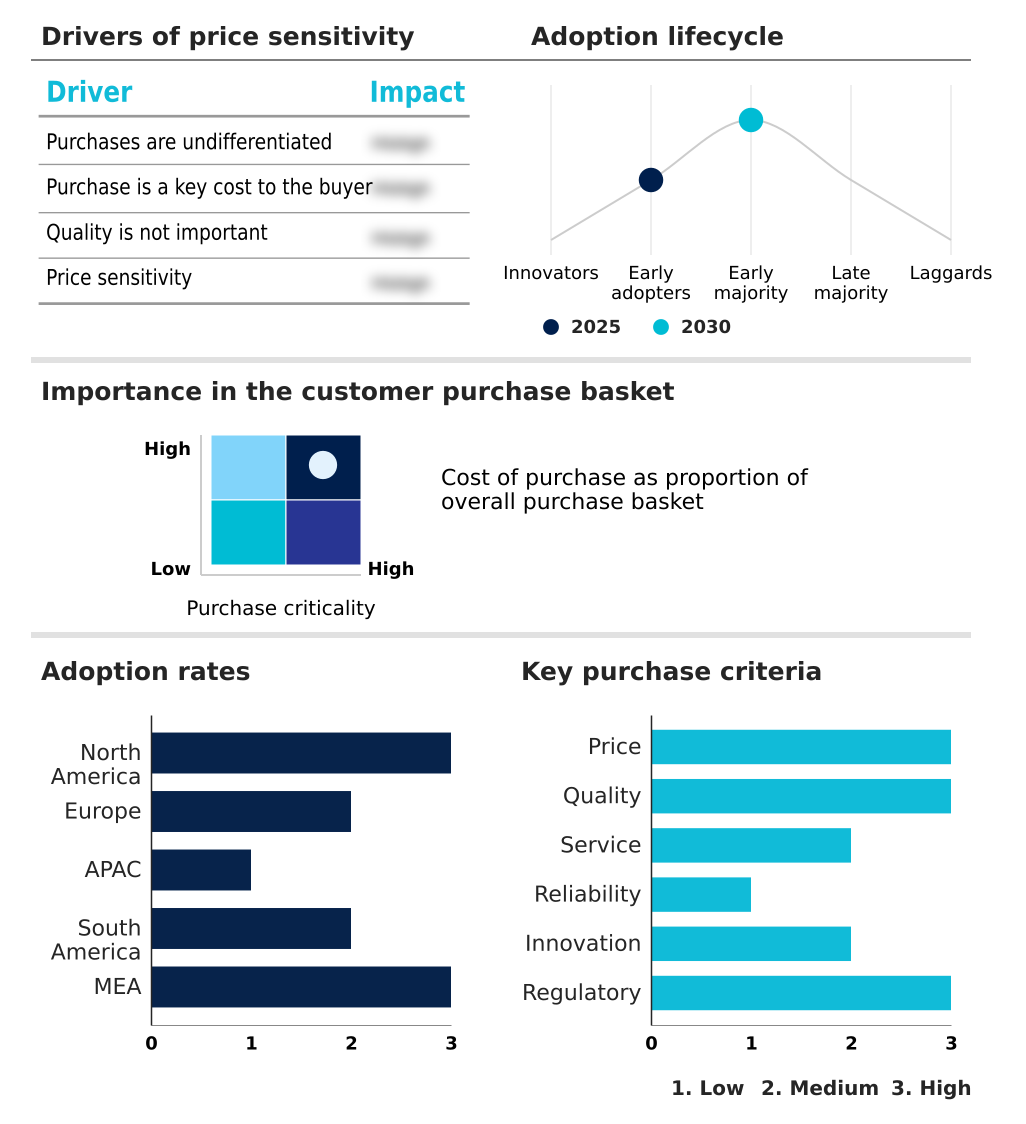
The packaged dehydrated food market forecasting report includes the adoption lifecycle of the market, covering from the innovator’s stage to the laggard’s stage. It focuses on adoption rates in different regions based on penetration. Furthermore, the packaged dehydrated food market report also includes key purchase criteria and drivers of price sensitivity to help companies evaluate and develop their market growth analysis strategies.
Customer Landscape of Packaged Dehydrated Food Industry
Competitive Landscape
Companies are implementing various strategies, such as strategic alliances, packaged dehydrated food market forecast, partnerships, mergers and acquisitions, geographical expansion, and product/service launches, to enhance their presence in the industry.
Ajinomoto Co. Inc. - Analysis reveals a focus on advanced flavor-enhancing technology for dehydrated culinary solutions, including seasonings, soups, and ready-to-eat mixes, catering to industrial and consumer needs.
The industry research and growth report includes detailed analyses of the competitive landscape of the market and information about key companies, including:
- Ajinomoto Co. Inc.
- Asahi Group Holdings Ltd.
- Backpackers Pantry
- Briden Solutions
- Chaucer Foods Ltd.
- Crispy Green Inc.
- European Freeze Dry
- Garon Dehydrates Pvt. Ltd.
- Harmony House Foods Inc.
- Honeyville Inc.
- Mevive Intl. Ingredients
- Mother Earth Products
- Nims Fruit Crisps Ltd.
- Nutradry Pty Ltd.
- Real Dehydrated Foods
- Thrive Foods LLC
- Tong Garden
- Traina Dried Fruit Nut Co.
- Unilever PLC
- Van Drunen Farms
Qualitative and quantitative analysis of companies has been conducted to help clients understand the wider business environment as well as the strengths and weaknesses of key industry players. Data is qualitatively analyzed to categorize companies as pure play, category-focused, industry-focused, and diversified; it is quantitatively analyzed to categorize companies as dominant, leading, strong, tentative, and weak.
Recent Development and News in Packaged dehydrated food market
- In November 2024, Thrive Foods LLC announced a strategic partnership with a leading packaging firm to integrate moisture-sensing labels across its entire line of long-term storage meal kits, enhancing food safety and consumer trust.
- In January 2025, Van Drunen Farms completed a USD 50 million expansion of its Illinois-based freeze-drying facility, doubling its capacity for organic fruit and vegetable processing to meet rising demand for clean-label ingredients.
- In March 2025, Unilever PLC acquired Nims Fruit Crisps Ltd., a UK-based producer of air-dried fruit and vegetable snacks, to strengthen its portfolio in the healthy snacking category and expand its European market presence.
- In May 2025, Crispy Green Inc. launched a new line of Upcycled Certified freeze-dried fruit snacks, made from cosmetically imperfect produce, aligning with growing consumer demand for sustainable and waste-reducing food products.
Dive into Technavio’s robust research methodology, blending expert interviews, extensive data synthesis, and validated models for unparalleled Packaged Dehydrated Food Market insights. See full methodology.
| Market Scope | |
|---|---|
| Page number | 298 |
| Base year | 2025 |
| Historic period | 2020-2024 |
| Forecast period | 2026-2030 |
| Growth momentum & CAGR | Accelerate at a CAGR of 6.3% |
| Market growth 2026-2030 | USD 29428.3 million |
| Market structure | Fragmented |
| YoY growth 2025-2026(%) | 6.0% |
| Key countries | US, Canada, Mexico, Germany, France, UK, Italy, Spain, The Netherlands, China, India, Japan, South Korea, Australia, Indonesia, Brazil, Argentina, Chile, Saudi Arabia, UAE, South Africa, Turkey and Israel |
| Competitive landscape | Leading Companies, Market Positioning of Companies, Competitive Strategies, and Industry Risks |
Research Analyst Overview
- The packaged dehydrated food market is characterized by a pivotal technological shift from conventional drying to advanced methods that prioritize nutritional value and sensory quality. Boardroom-level decisions increasingly center on navigating the high capital expenditure for systems enabling agentic sublimation and hybrid dehydration against the long-term competitive advantage gained through superior micronutrient preservation and rehydration quality.
- Technologies like lyophilization and vacuum-drying are crucial for achieving the high-fidelity structural integrity preservation demanded by the premium and functional food sectors. The integration of microwave-assisted vacuum-drying has demonstrated a reduction in processing times by up to 40% compared to conventional methods. This efficiency gain is critical as manufacturers work to improve moisture removal and achieve consistent particle size.
- The industry is also defined by a move toward clean-label, single-ingredient snacks and ready-to-rehydrate meals, utilizing innovations like moisture-sensing labels, solar-assisted drying, and time-temperature indicators. This push for minimal processing and enhanced nutrient retention, while managing water activity reduction and shelf stability, is reshaping the entire value chain from upcycled dehydrated ingredients to final smart packaging.
What are the Key Data Covered in this Packaged Dehydrated Food Market Research and Growth Report?
-
What is the expected growth of the Packaged Dehydrated Food Market between 2026 and 2030?
-
USD 29.43 billion, at a CAGR of 6.3%
-
-
What segmentation does the market report cover?
-
The report is segmented by Technology (Spray drying, Freeze drying, Sun drying, and Others), Distribution Channel (Offline, and Online), Product Type (Fruits and vegetables, Dairy, Meat and seafood, and Others) and Geography (North America, Europe, APAC, South America, Middle East and Africa)
-
-
Which regions are analyzed in the report?
-
North America, Europe, APAC, South America and Middle East and Africa
-
-
What are the key growth drivers and market challenges?
-
Agentic sublimation and energy-efficient continuous dehydration systems, Technological and financial barriers in advanced dehydration infrastructure
-
-
Who are the major players in the Packaged Dehydrated Food Market?
-
Ajinomoto Co. Inc., Asahi Group Holdings Ltd., Backpackers Pantry, Briden Solutions, Chaucer Foods Ltd., Crispy Green Inc., European Freeze Dry, Garon Dehydrates Pvt. Ltd., Harmony House Foods Inc., Honeyville Inc., Mevive Intl. Ingredients, Mother Earth Products, Nims Fruit Crisps Ltd., Nutradry Pty Ltd., Real Dehydrated Foods, Thrive Foods LLC, Tong Garden, Traina Dried Fruit Nut Co., Unilever PLC and Van Drunen Farms
-
Market Research Insights
- The dynamics of the packaged dehydrated food market are shaped by a convergence of consumer demand for convenience and wellness. The adoption of ready-to-cook solutions has led to a 20% reduction in preparation time for foodservice clients, while brands focusing on high-protein hiking rations are experiencing up to 30% higher customer retention compared to standard snacks.
- Furthermore, the integration of upcycled ingredients has allowed processors to lower raw material costs by over 15% in certain product lines. This shift is supported by the availability of diverse offerings, from plant-based dehydrated meals and gourmet meal kits to specialized pet food ingredients.
- As the market for shelf-stable nutrition expands, vendors offering functional food ingredients and guilt-free lunchbox alternatives are gaining a competitive advantage by addressing specific dietary and lifestyle needs with innovative and sustainable products.
We can help! Our analysts can customize this packaged dehydrated food market research report to meet your requirements.
 RIA -
RIA - 
