Packaged Natural Mineral Water Market Analysis, Size, and Forecast 2025-2029: APAC (China, India, and Japan), North America (US, Canada, and Mexico), Europe (Germany, Italy, and France), South America (Brazil, Argentina, and Colombia), Middle East and Africa (Saudi Arabia, UAE, and South Africa), and Rest of World (ROW)

Packaged Natural Mineral Water Market Analysis, Size, and Forecast 2025-2029:
APAC (China, India, and Japan), North America (US, Canada, and Mexico), Europe (Germany, Italy, and France), South America (Brazil, Argentina, and Colombia), Middle East and Africa (Saudi Arabia, UAE, and South Africa), and Rest of World (ROW)

Published: Dec 2025 292 Pages SKU: IRTNTR73502

Market Overview at a Glance

$55.20 B
Market Opportunity
6.1%
CAGR 2024 - 2029
41.6%
APAC Growth
$133.75 B
Offline segment 2023

Packaged Natural Mineral Water Market Size 2025-2029

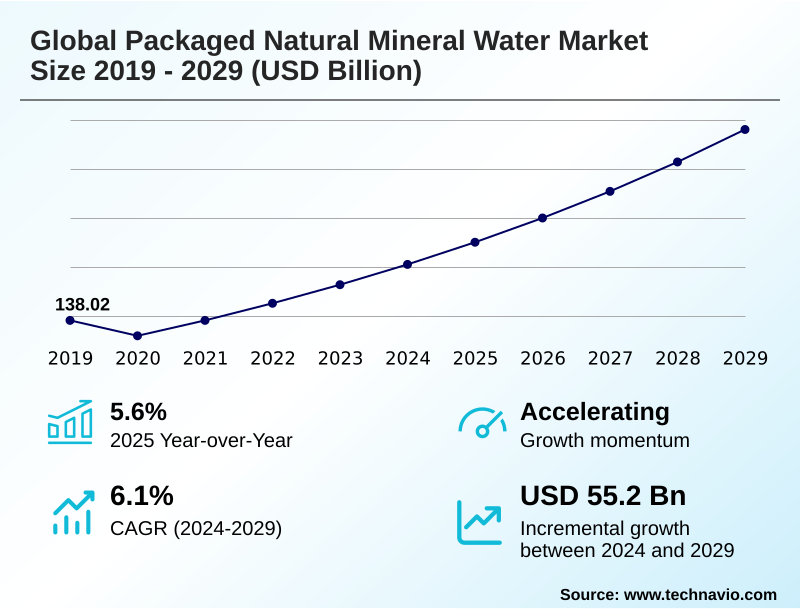
The packaged natural mineral water market size is valued to increase by USD 55.20 billion, at a CAGR of 6.1% from 2024 to 2029. Heightened health and wellness consciousness propelling market growth will drive the packaged natural mineral water market.

Major Market Trends & Insights

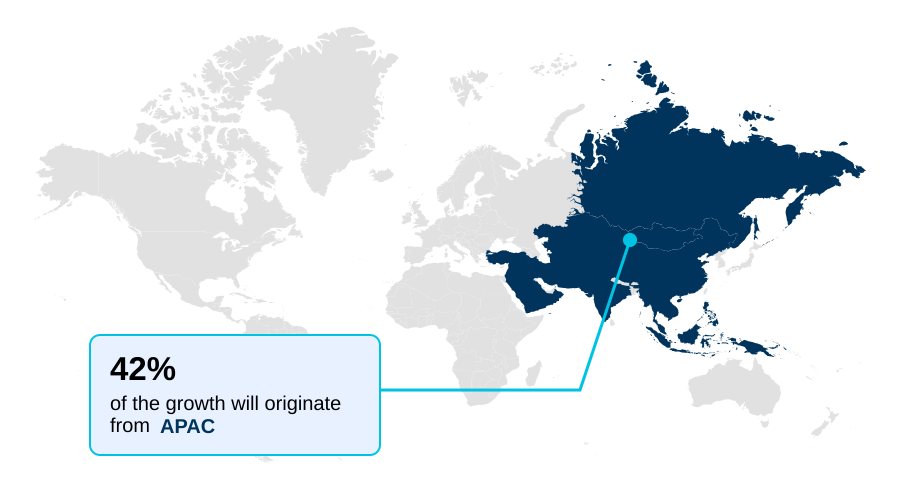
  • APAC dominated the market and accounted for a 41.6% growth during the forecast period.
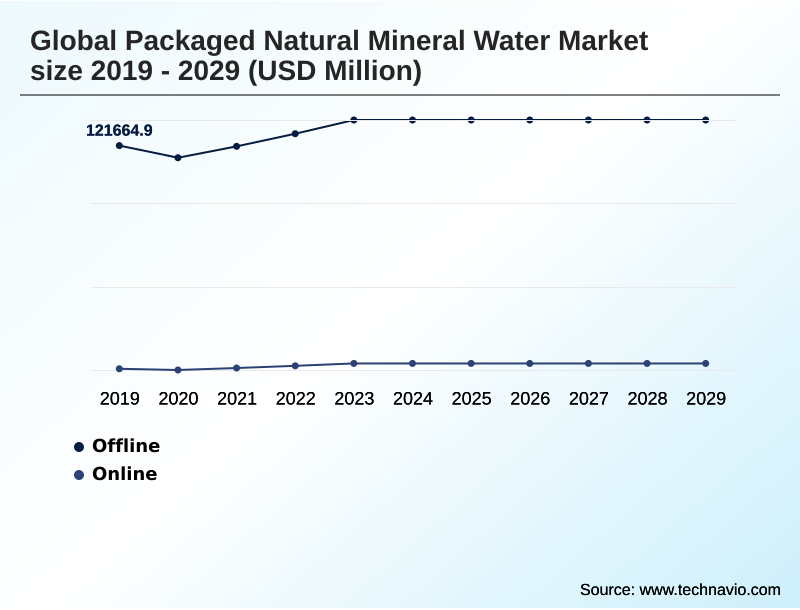
  • By Distribution Channel - Offline segment was valued at USD 133.75 billion in 2023
  • By Product - Packaged natural sparkling mineral water segment accounted for the largest market revenue share in 2023

Market Size & Forecast

  • Market Opportunities: USD 78.10 billion
  • Market Future Opportunities: USD 55.20 billion
  • CAGR from 2024 to 2029 : 6.1%

Market Summary

  • The packaged natural mineral water market is characterized by a fundamental consumer shift toward health and wellness, creating robust demand for pure hydration solutions. This movement away from sugary drinks underpins the market's expansion, with both packaged natural still mineral water and its sparkling counterpart gaining share.
  • Concurrently, the industry grapples with the critical challenge of sustainability, as regulatory pressure on packaging and consumer demand for eco-friendly alternatives intensify. This has spurred innovation in materials and circular economy models. For instance, a beverage company facing complex supply chain logistics can achieve significant operational efficiencies by adopting lightweighting technologies for its PET bottle production.
  • This strategic move not only reduces the carbon footprint by lowering transportation weight but also mitigates operational cost pressures associated with raw material usage. The market's trajectory is further shaped by the premiumization trend and the rise of functional waters, which offer added benefits like electrolytes or enhanced alkalinity, appealing to a discerning consumer base seeking more than simple hydration.
  • Balancing the demand for pristine, high-quality water from sources like artesian aquifers with environmental stewardship and operational viability remains the central strategic focus for market participants.

What will be the Size of the Packaged Natural Mineral Water Market during the forecast period?

Get Key Insights on Market Forecast (PDF) Request Free Sample

How is the Packaged Natural Mineral Water Market Segmented?

The packaged natural mineral water industry research report provides comprehensive data (region-wise segment analysis), with forecasts and estimates in "USD million" for the period 2025-2029, as well as historical data from 2019-2023 for the following segments.

  • Distribution channel
    • Offline
    • Online
  • Product
    • Packaged natural sparkling mineral water
    • Packaged natural still mineral water
  • Type of packaging
    • Plastic bottles
    • Glass bottles
    • Cans
  • Geography
    • APAC
      • China
      • India
      • Japan
    • North America
      • US
      • Canada
      • Mexico
    • Europe
      • Germany
      • Italy
      • France
    • South America
      • Brazil
      • Argentina
      • Colombia
    • Middle East and Africa
      • Saudi Arabia
      • UAE
      • South Africa
    • Rest of World (ROW)

By Distribution Channel Insights

The offline segment is estimated to witness significant growth during the forecast period.

The offline distribution channel, encompassing supermarkets, convenience stores, and other physical retail outlets, remains the foundational pillar of the market.

This segment's dominance is sustained by impulse purchase behavior and the convenience demanded for on-the-go consumption, which physical stores are uniquely positioned to satisfy.

With bottled water accounting for 12.4% of all packaged beverage dollars in convenience stores, strategic product placement is critical. The segment is also experiencing a surge in private label brand growth, intensifying market competition.

As the premiumization trend continues, retailers are dedicating more shelf space to options like packaged natural sparkling mineral water, often sourced from an artesian aquifer, reflecting a sophisticated consumer palate and driving further diversification within the channel.

Request Free Sample

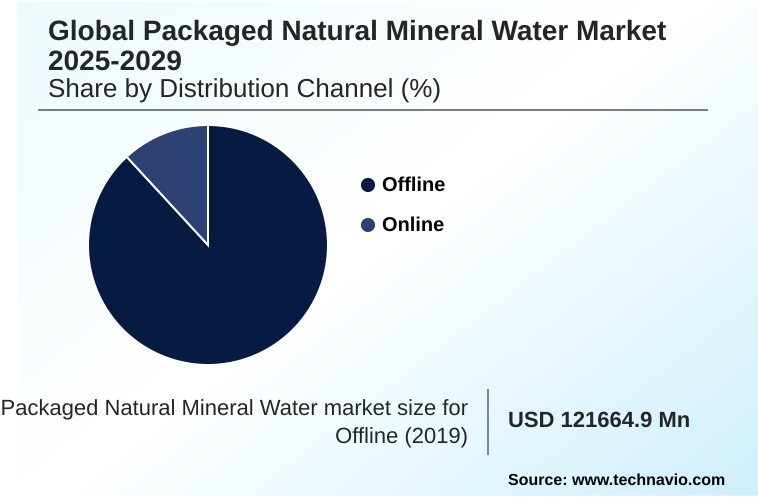
The Offline segment was valued at USD 133.75 billion in 2023 and showed a gradual increase during the forecast period.

Request Free Sample

Regional Analysis

APAC is estimated to contribute 41.6% to the growth of the global market during the forecast period.Technavio’s analysts have elaborately explained the regional trends and drivers that shape the market during the forecast period.

See How Packaged Natural Mineral Water Market Demand is Rising in APAC Request Free Sample

The global market exhibits diverse regional dynamics, with APAC holding an estimated 38% of the market share, driven by rising incomes and significant tap water quality concerns. In this region, demand is primarily for basic, safe hydration.

In contrast, mature markets like Europe and North America are characterized by high per capita consumption and a focus on premium and functional products. European consumer behavior reflects this, with 53% choosing bottled water for its perceived health benefits.

North America showcases a strong commitment to sustainability, where the average recycled content in PET bottles has reached 16.2%.

This focus on a circular economy is compelling brands to innovate in packaging, while the convenience of home and office delivery (HOD) services and direct-to-consumer (D2C) channels expands market access.

Market Dynamics

Our researchers analyzed the data with 2024 as the base year, along with the key drivers, trends, and challenges. A holistic analysis of drivers will help companies refine their marketing strategies to gain a competitive advantage.

  • The market's future is being defined by a complex interplay of consumer demands and operational realities. The impact of rPET on brand perception is undeniable, as eco-friendly packaging innovations in bottled water now directly influence purchasing decisions.
  • This is tied to the growing consumer demand for functional mineral water, with the functional water market growth factors pointing toward personalized health benefits. Premiumization strategies for natural mineral water are evolving, moving beyond source to include unique mineral profiles and sustainable narratives.
  • However, these strategies face the underlying challenges of water source sustainability and the logistical challenges in water distribution. The regulatory landscape for plastic packaging continues to tighten, forcing a re-evaluation of materials, with consumer perception of glass vs plastic bottles shifting toward more recyclable options. Competition from tap water filtration systems is compelling brands to reinforce their value proposition.
  • The role of celebrity endorsements in water branding has proven effective for new entrants, but long-term success depends on managing supply chain risks in the water industry. Firms that successfully navigate the impact of deposit return schemes on recycling and trends in direct-to-consumer water sales, while demonstrating credible water stewardship in beverage manufacturing, are best positioned for growth.
  • For example, brands that transparently report on sustainable sourcing of natural mineral water have seen positive consumer sentiment metrics improve by a greater margin than those relying solely on marketing spend.

What are the key market drivers leading to the rise in the adoption of Packaged Natural Mineral Water Industry?

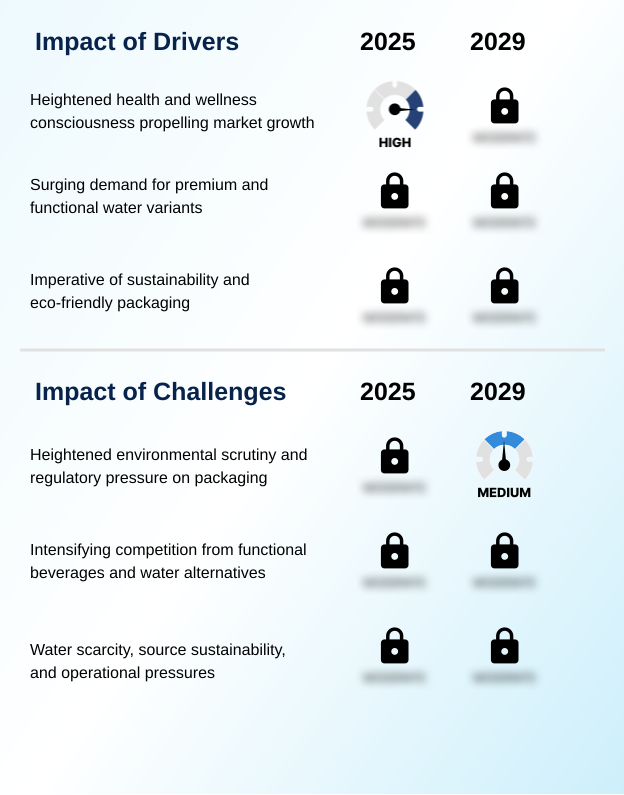
  • Heightened consumer consciousness regarding health and wellness is a primary driver propelling growth in the market.

  • Market growth is fundamentally driven by a pronounced consumer preference shift toward healthier hydration, rooted in a powerful health and wellness trend.
  • Consumers are actively choosing packaged natural still mineral water as a sugar-sweetened beverages alternative, a behavior that has solidified bottled water's position as the leading packaged beverage in major markets for nine consecutive years.
  • This demand is amplified by the convenience of products designed for on-the-go consumption.
  • Furthermore, the premiumization trend and rising disposable incomes are fueling interest in products with a stable mineral composition and functional benefits, such as vitamin-infused water and electrolyte-infused water.
  • In Europe, over 70% of consumers now opt for healthier drinks, reflecting a deep-seated demand for personalized nutrition solutions that support an active and wellness-oriented lifestyle driven by urbanization-driven demand.

What are the market trends shaping the Packaged Natural Mineral Water Industry?

  • The critical imperative for sustainable packaging is emerging as a defining trend, shaping corporate strategy and consumer purchasing decisions across the market.

  • The market is undergoing a significant transformation driven by the ascent of functional and flavored waters and the critical imperative of sustainable packaging. A major trend is the expansion of the premium water segment, where products are differentiated by their unique water source and sophisticated packaging design.
  • This is coupled with a move toward value-added hydration products that offer enhanced wellness benefits. Innovations in alternative packaging materials are accelerating, with launches in aluminum cans tripling in recent years, reflecting strong consumer demand for recyclability. Similarly, the use of recycled PET (rPET) is becoming standard practice, supported by advancements in lightweighting technologies and an emerging refillable bottle culture.
  • The functional beverage category is also a key growth area, with European product launches featuring vitamin and mineral fortifications experiencing a 30% compound annual growth rate.

What challenges does the Packaged Natural Mineral Water Industry face during its growth?

  • The industry faces a significant challenge from heightened environmental scrutiny and increasing regulatory pressure on packaging materials.

  • The market faces considerable headwinds from intensifying market competition and stringent regulatory pressure on packaging, particularly single-use plastics. The proliferation of tap water filtration systems presents a low-cost alternative, eroding market share and impacting brand loyalty factors.
  • Concurrently, operational cost pressures are mounting due to supply chain complexities and water scarcity impact, with disruptions from issues like cargo theft rising by over 10% in the last reporting period. The European Union's mandate for plastic bottles to contain at least 25% recycled plastic by 2025 exemplifies the stringent regulations forcing investment in new materials and processes.
  • This environment fosters a challenging landscape where companies must innovate in both product and packaging to remain competitive against private label brand growth and shifting consumer preferences.

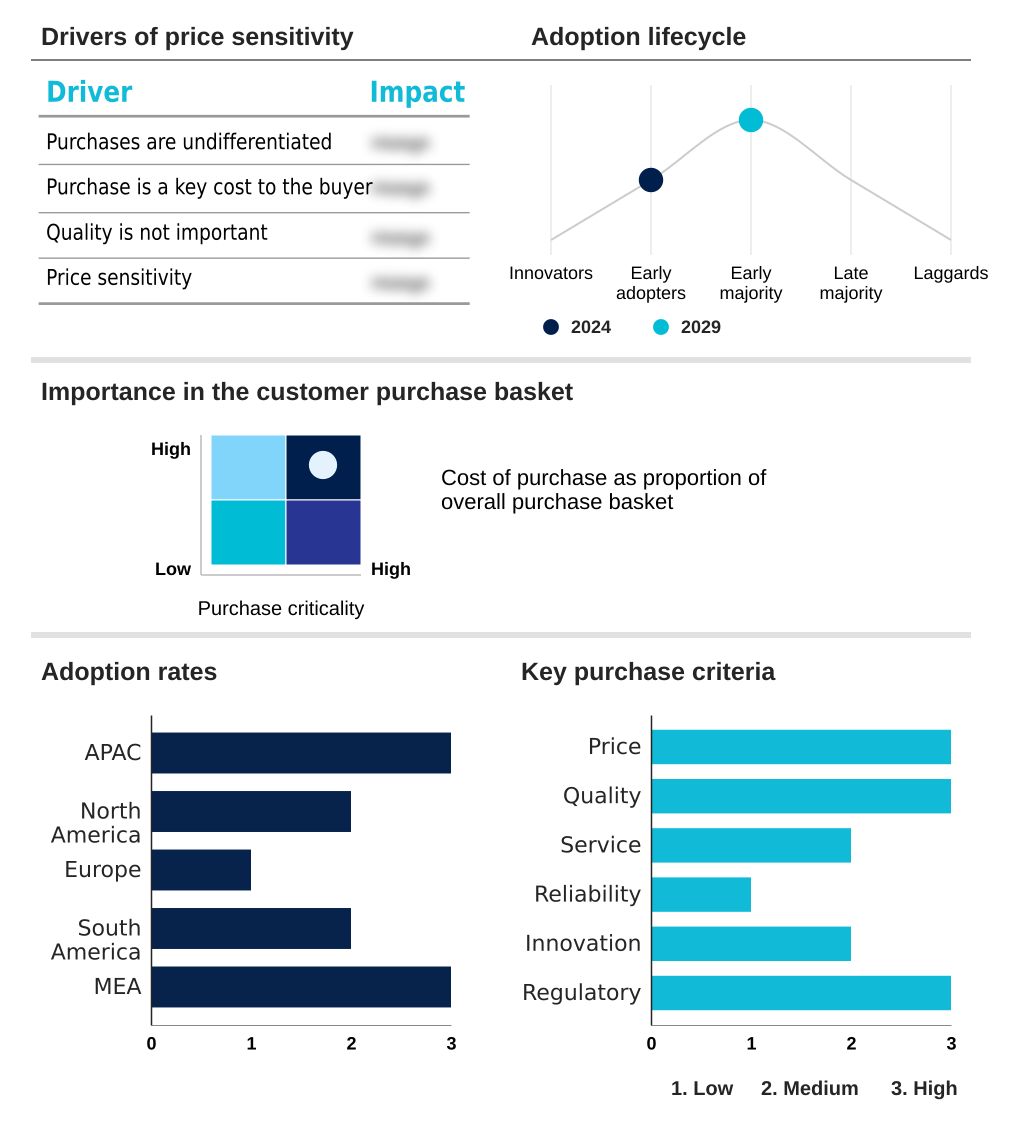
Exclusive Technavio Analysis on Customer Landscape

The packaged natural mineral water market forecasting report includes the adoption lifecycle of the market, covering from the innovator’s stage to the laggard’s stage. It focuses on adoption rates in different regions based on penetration. Furthermore, the packaged natural mineral water market report also includes key purchase criteria and drivers of price sensitivity to help companies evaluate and develop their market growth analysis strategies.

Customer Landscape of Packaged Natural Mineral Water Industry

Competitive Landscape

Companies are implementing various strategies, such as strategic alliances, packaged natural mineral water market forecast, partnerships, mergers and acquisitions, geographical expansion, and product/service launches, to enhance their presence in the industry.

Agthia Group PJSC - Offerings include premium and functional waters, differentiated by source purity, natural mineral composition, and advanced packaging solutions that cater to health-conscious consumers.

The industry research and growth report includes detailed analyses of the competitive landscape of the market and information about key companies, including:

  • Agthia Group PJSC
  • Beverly Hills Drink Co.
  • Bisleri International Pvt. Ltd.
  • China Resources Beverages Ltd.
  • Danone S.A.
  • Gerolsteiner Brunnen GmbH
  • Grupo Embotellador ATIC SA
  • Masafi Co. LLC
  • Mountain Valley Spring Co. LLC
  • Nestle SA
  • Parle Agro Pvt Ltd.
  • PepsiCo Inc.
  • Tata Consumer Products Ltd.
  • The Coca Cola Co.
  • The Wonderful Co. LLC
  • United Breweries Ltd.
  • VOSS Global Inc.

Qualitative and quantitative analysis of companies has been conducted to help clients understand the wider business environment as well as the strengths and weaknesses of key industry players. Data is qualitatively analyzed to categorize companies as pure play, category-focused, industry-focused, and diversified; it is quantitatively analyzed to categorize companies as dominant, leading, strong, tentative, and weak.

Recent Development and News in Packaged natural mineral water market

  • In August 2024, Flow Beverage Corp. announced the upcoming launch of its new Flow Sparkling Mineral Spring Water in aluminum bottles, made from over 70% recycled material, targeting both Canada and the US.
  • In October 2024, Water Almighty launched its Mighty Pure and Mighty Minerals waters in infinitely recyclable aluminum bottles in the UK, directly addressing consumer concerns over plastic waste.
  • In January 2025, Agthia Group PJSC completed its acquisition of Riviere, a UAE-based water company, to significantly bolster its home and office delivery segment.
  • In March 2025, Gerolsteiner Brunnen GmbH and Co. KG initiated a product recall for certain glass bottles due to a production flaw that posed a risk of cracking.

Dive into Technavio’s robust research methodology, blending expert interviews, extensive data synthesis, and validated models for unparalleled Packaged Natural Mineral Water Market insights. See full methodology.

Market Scope
Page number 292
Base year 2024
Historic period 2019-2023
Forecast period 2025-2029
Growth momentum & CAGR Accelerate at a CAGR of 6.1%
Market growth 2025-2029 USD 55198.2 million
Market structure Fragmented
YoY growth 2024-2025(%) 5.6%
Key countries China, India, Japan, Indonesia, South Korea, Australia, US, Canada, Mexico, Germany, Italy, France, Spain, UK, Hungary, Brazil, Argentina, Colombia, Saudi Arabia, UAE, South Africa, Egypt and Morocco
Competitive landscape Leading Companies, Market Positioning of Companies, Competitive Strategies, and Industry Risks

Request Free Sample

Research Analyst Overview

  • The packaged natural mineral water market is evolving beyond basic hydration, driven by sophisticated consumer demands for both purity and purpose. Core offerings of packaged natural still mineral water and its sparkling counterpart are being augmented by a rapidly expanding functional beverage category, including vitamin-infused water and electrolyte-infused water.
  • This shift reflects a broader health and wellness trend, pushing producers to innovate with offerings like alkaline water with antioxidants. However, the most significant strategic imperative is sustainability. The industry is actively transitioning away from single-use plastics toward sustainable packaging solutions such as recycled PET (rPET), glass bottle packaging, and aluminum can packaging.
  • Initiatives promoting a circular economy and the development of a biodegradable water bottle are gaining traction. Sourcing from a geologically protected underground source or a pristine artesian aquifer remains a key differentiator, but companies must also demonstrate robust water stewardship programs.
  • Firms that proactively manage their water resources exhibit an operational risk profile that is up to 20% lower than competitors in water-stressed regions, highlighting the connection between environmental responsibility and long-term viability.

What are the Key Data Covered in this Packaged Natural Mineral Water Market Research and Growth Report?

  • What is the expected growth of the Packaged Natural Mineral Water Market between 2025 and 2029?

    • USD 55.20 billion, at a CAGR of 6.1%

  • What segmentation does the market report cover?

    • The report is segmented by Distribution Channel (Offline, and Online), Product (Packaged natural sparkling mineral water, and Packaged natural still mineral water), Type of Packaging (Plastic bottles, Glass bottles, and Cans) and Geography (APAC, North America, Europe, South America, Middle East and Africa)

  • Which regions are analyzed in the report?

    • APAC, North America, Europe, South America and Middle East and Africa

  • What are the key growth drivers and market challenges?

    • Heightened health and wellness consciousness propelling market growth, Heightened environmental scrutiny and regulatory pressure on packaging

  • Who are the major players in the Packaged Natural Mineral Water Market?

    • Agthia Group PJSC, Beverly Hills Drink Co., Bisleri International Pvt. Ltd., China Resources Beverages Ltd., Danone S.A., Gerolsteiner Brunnen GmbH, Grupo Embotellador ATIC SA, Masafi Co. LLC, Mountain Valley Spring Co. LLC, Nestle SA, Parle Agro Pvt Ltd., PepsiCo Inc., Tata Consumer Products Ltd., The Coca Cola Co., The Wonderful Co. LLC, United Breweries Ltd. and VOSS Global Inc.

Market Research Insights

  • The market is shaped by a significant consumer preference shift toward healthier hydration, driven by a pervasive health and wellness trend. This dynamic has led to a notable pivot away from sugar-sweetened beverages. In response, companies are innovating with value-added hydration products that offer enhanced wellness benefits.
  • For instance, firms that pivot to sustainable packaging formats, such as recycled PET, report customer engagement rates up to 20% higher than competitors using virgin materials.
  • Furthermore, the push for a reduced carbon footprint through the adoption of alternative packaging materials is accelerating, with new product launches in cans or cartons capturing market share twice as fast as traditional offerings in some segments, reflecting a strong eco-conscious consumer demand.

We can help! Our analysts can customize this packaged natural mineral water market research report to meet your requirements.

Get in touch

1. Executive Summary

1.1 Market overview

Executive Summary - Chart on Market Overview
Executive Summary - Data Table on Market Overview
Executive Summary - Chart on Global Market Characteristics
Executive Summary - Chart on Market by Geography
Executive Summary - Chart on Market Segmentation by Distribution Channel
Executive Summary - Chart on Market Segmentation by Product
Executive Summary - Chart on Market Segmentation by Type of Packaging
Executive Summary - Chart on Incremental Growth
Executive Summary - Data Table on Incremental Growth
Executive Summary - Chart on Company Market Positioning

2. Technavio Analysis

2.1 Analysis of price sensitivity, lifecycle, customer purchase basket, adoption rates, and purchase criteria

2.2 Criticality of inputs and Factors of differentiation

Chart on Overview on criticality of inputs and factors of differentiation

2.3 Factors of disruption

Chart on Overview on factors of disruption

2.4 Impact of drivers and challenges

Chart on Impact of drivers and challenges in 2024 and 2029

3. Market Landscape

3.1 Market ecosystem

Chart on Parent Market
Data Table on - Parent Market

3.2 Market characteristics

Chart on Market characteristics analysis

3.3 Value chain analysis

Chart on Value chain analysis

4. Market Sizing

4.1 Market definition

Data Table on Offerings of companies included in the market definition

4.2 Market segment analysis

Market segments

4.3 Market size 2024

4.4 Market outlook: Forecast for 2024-2029

Chart on Global - Market size and forecast 2024-2029 ($ million)
Data Table on Global - Market size and forecast 2024-2029 ($ million)
Chart on Global Market: Year-over-year growth 2024-2029 (%)
Data Table on Global Market: Year-over-year growth 2024-2029 (%)

5. Historic Market Size

5.1 Global Packaged Natural Mineral Water Market 2019 - 2023

Historic Market Size - Data Table on Global Packaged Natural Mineral Water Market 2019 - 2023 ($ million)

5.2 Distribution Channel segment analysis 2019 - 2023

Historic Market Size - Distribution Channel Segment 2019 - 2023 ($ million)

5.3 Product segment analysis 2019 - 2023

Historic Market Size - Product Segment 2019 - 2023 ($ million)

5.4 Type of Packaging segment analysis 2019 - 2023

Historic Market Size - Type of Packaging Segment 2019 - 2023 ($ million)

5.5 Geography segment analysis 2019 - 2023

Historic Market Size - Geography Segment 2019 - 2023 ($ million)

5.6 Country segment analysis 2019 - 2023

Historic Market Size - Country Segment 2019 - 2023 ($ million)

6. Qualitative Analysis

6.1 The AI impact on Global Packaged Natural Mineral Water Market

7. Five Forces Analysis

7.1 Five forces summary

Five forces analysis - Comparison between 2024 and 2029

7.2 Bargaining power of buyers

Bargaining power of buyers - Impact of key factors 2024 and 2029

7.3 Bargaining power of suppliers

Bargaining power of suppliers - Impact of key factors in 2024 and 2029

7.4 Threat of new entrants

Threat of new entrants - Impact of key factors in 2024 and 2029

7.5 Threat of substitutes

Threat of substitutes - Impact of key factors in 2024 and 2029

7.6 Threat of rivalry

Threat of rivalry - Impact of key factors in 2024 and 2029

7.7 Market condition

Chart on Market condition - Five forces 2024 and 2029

8. Market Segmentation by Distribution Channel

8.1 Market segments

Chart on Distribution Channel - Market share 2024-2029 (%)
Data Table on Distribution Channel - Market share 2024-2029 (%)

8.2 Comparison by Distribution Channel

Chart on Comparison by Distribution Channel
Data Table on Comparison by Distribution Channel

8.3 Offline - Market size and forecast 2024-2029

Chart on Offline - Market size and forecast 2024-2029 ($ million)
Data Table on Offline - Market size and forecast 2024-2029 ($ million)
Chart on Offline - Year-over-year growth 2024-2029 (%)
Data Table on Offline - Year-over-year growth 2024-2029 (%)

8.4 Online - Market size and forecast 2024-2029

Chart on Online - Market size and forecast 2024-2029 ($ million)
Data Table on Online - Market size and forecast 2024-2029 ($ million)
Chart on Online - Year-over-year growth 2024-2029 (%)
Data Table on Online - Year-over-year growth 2024-2029 (%)

8.5 Market opportunity by Distribution Channel

Market opportunity by Distribution Channel ($ million)
Data Table on Market opportunity by Distribution Channel ($ million)

9. Market Segmentation by Product

9.1 Market segments

Chart on Product - Market share 2024-2029 (%)
Data Table on Product - Market share 2024-2029 (%)

9.2 Comparison by Product

Chart on Comparison by Product
Data Table on Comparison by Product

9.3 Packaged natural sparkling mineral water - Market size and forecast 2024-2029

Chart on Packaged natural sparkling mineral water - Market size and forecast 2024-2029 ($ million)
Data Table on Packaged natural sparkling mineral water - Market size and forecast 2024-2029 ($ million)
Chart on Packaged natural sparkling mineral water - Year-over-year growth 2024-2029 (%)
Data Table on Packaged natural sparkling mineral water - Year-over-year growth 2024-2029 (%)

9.4 Packaged natural still mineral water - Market size and forecast 2024-2029

Chart on Packaged natural still mineral water - Market size and forecast 2024-2029 ($ million)
Data Table on Packaged natural still mineral water - Market size and forecast 2024-2029 ($ million)
Chart on Packaged natural still mineral water - Year-over-year growth 2024-2029 (%)
Data Table on Packaged natural still mineral water - Year-over-year growth 2024-2029 (%)

9.5 Market opportunity by Product

Market opportunity by Product ($ million)
Data Table on Market opportunity by Product ($ million)

10. Market Segmentation by Type of Packaging

10.1 Market segments

Chart on Type of Packaging - Market share 2024-2029 (%)
Data Table on Type of Packaging - Market share 2024-2029 (%)

10.2 Comparison by Type of Packaging

Chart on Comparison by Type of Packaging
Data Table on Comparison by Type of Packaging

10.3 Plastic bottles - Market size and forecast 2024-2029

Chart on Plastic bottles - Market size and forecast 2024-2029 ($ million)
Data Table on Plastic bottles - Market size and forecast 2024-2029 ($ million)
Chart on Plastic bottles - Year-over-year growth 2024-2029 (%)
Data Table on Plastic bottles - Year-over-year growth 2024-2029 (%)

10.4 Glass bottles - Market size and forecast 2024-2029

Chart on Glass bottles - Market size and forecast 2024-2029 ($ million)
Data Table on Glass bottles - Market size and forecast 2024-2029 ($ million)
Chart on Glass bottles - Year-over-year growth 2024-2029 (%)
Data Table on Glass bottles - Year-over-year growth 2024-2029 (%)

10.5 Cans - Market size and forecast 2024-2029

Chart on Cans - Market size and forecast 2024-2029 ($ million)
Data Table on Cans - Market size and forecast 2024-2029 ($ million)
Chart on Cans - Year-over-year growth 2024-2029 (%)
Data Table on Cans - Year-over-year growth 2024-2029 (%)

10.6 Market opportunity by Type of Packaging

Market opportunity by Type of Packaging ($ million)
Data Table on Market opportunity by Type of Packaging ($ million)

11. Customer Landscape

11.1 Customer landscape overview

Analysis of price sensitivity, lifecycle, customer purchase basket, adoption rates, and purchase criteria

12. Geographic Landscape

12.1 Geographic segmentation

Chart on Market share by geography 2024-2029 (%)
Data Table on Market share by geography 2024-2029 (%)

12.2 Geographic comparison

Chart on Geographic comparison
Data Table on Geographic comparison

12.3 APAC - Market size and forecast 2024-2029

Chart on APAC - Market size and forecast 2024-2029 ($ million)
Data Table on APAC - Market size and forecast 2024-2029 ($ million)
Chart on APAC - Year-over-year growth 2024-2029 (%)
Data Table on APAC - Year-over-year growth 2024-2029 (%)
Chart on Regional Comparison - APAC
Data Table on Regional Comparison - APAC

12.3.1 China - Market size and forecast 2024-2029

Chart on China - Market size and forecast 2024-2029 ($ million)
Data Table on China - Market size and forecast 2024-2029 ($ million)
Chart on China - Year-over-year growth 2024-2029 (%)
Data Table on China - Year-over-year growth 2024-2029 (%)

12.3.2 India - Market size and forecast 2024-2029

Chart on India - Market size and forecast 2024-2029 ($ million)
Data Table on India - Market size and forecast 2024-2029 ($ million)
Chart on India - Year-over-year growth 2024-2029 (%)
Data Table on India - Year-over-year growth 2024-2029 (%)

12.3.3 Japan - Market size and forecast 2024-2029

Chart on Japan - Market size and forecast 2024-2029 ($ million)
Data Table on Japan - Market size and forecast 2024-2029 ($ million)
Chart on Japan - Year-over-year growth 2024-2029 (%)
Data Table on Japan - Year-over-year growth 2024-2029 (%)

12.3.4 Indonesia - Market size and forecast 2024-2029

Chart on Indonesia - Market size and forecast 2024-2029 ($ million)
Data Table on Indonesia - Market size and forecast 2024-2029 ($ million)
Chart on Indonesia - Year-over-year growth 2024-2029 (%)
Data Table on Indonesia - Year-over-year growth 2024-2029 (%)

12.3.5 South Korea - Market size and forecast 2024-2029

Chart on South Korea - Market size and forecast 2024-2029 ($ million)
Data Table on South Korea - Market size and forecast 2024-2029 ($ million)
Chart on South Korea - Year-over-year growth 2024-2029 (%)
Data Table on South Korea - Year-over-year growth 2024-2029 (%)

12.3.6 Australia - Market size and forecast 2024-2029

Chart on Australia - Market size and forecast 2024-2029 ($ million)
Data Table on Australia - Market size and forecast 2024-2029 ($ million)
Chart on Australia - Year-over-year growth 2024-2029 (%)
Data Table on Australia - Year-over-year growth 2024-2029 (%)

12.4 North America - Market size and forecast 2024-2029

Chart on North America - Market size and forecast 2024-2029 ($ million)
Data Table on North America - Market size and forecast 2024-2029 ($ million)
Chart on North America - Year-over-year growth 2024-2029 (%)
Data Table on North America - Year-over-year growth 2024-2029 (%)
Chart on Regional Comparison - North America
Data Table on Regional Comparison - North America

12.4.1 US - Market size and forecast 2024-2029

Chart on US - Market size and forecast 2024-2029 ($ million)
Data Table on US - Market size and forecast 2024-2029 ($ million)
Chart on US - Year-over-year growth 2024-2029 (%)
Data Table on US - Year-over-year growth 2024-2029 (%)

12.4.2 Canada - Market size and forecast 2024-2029

Chart on Canada - Market size and forecast 2024-2029 ($ million)
Data Table on Canada - Market size and forecast 2024-2029 ($ million)
Chart on Canada - Year-over-year growth 2024-2029 (%)
Data Table on Canada - Year-over-year growth 2024-2029 (%)

12.4.3 Mexico - Market size and forecast 2024-2029

Chart on Mexico - Market size and forecast 2024-2029 ($ million)
Data Table on Mexico - Market size and forecast 2024-2029 ($ million)
Chart on Mexico - Year-over-year growth 2024-2029 (%)
Data Table on Mexico - Year-over-year growth 2024-2029 (%)

12.5 Europe - Market size and forecast 2024-2029

Chart on Europe - Market size and forecast 2024-2029 ($ million)
Data Table on Europe - Market size and forecast 2024-2029 ($ million)
Chart on Europe - Year-over-year growth 2024-2029 (%)
Data Table on Europe - Year-over-year growth 2024-2029 (%)
Chart on Regional Comparison - Europe
Data Table on Regional Comparison - Europe

12.5.1 Germany - Market size and forecast 2024-2029

Chart on Germany - Market size and forecast 2024-2029 ($ million)
Data Table on Germany - Market size and forecast 2024-2029 ($ million)
Chart on Germany - Year-over-year growth 2024-2029 (%)
Data Table on Germany - Year-over-year growth 2024-2029 (%)

12.5.2 Italy - Market size and forecast 2024-2029

Chart on Italy - Market size and forecast 2024-2029 ($ million)
Data Table on Italy - Market size and forecast 2024-2029 ($ million)
Chart on Italy - Year-over-year growth 2024-2029 (%)
Data Table on Italy - Year-over-year growth 2024-2029 (%)

12.5.3 France - Market size and forecast 2024-2029

Chart on France - Market size and forecast 2024-2029 ($ million)
Data Table on France - Market size and forecast 2024-2029 ($ million)
Chart on France - Year-over-year growth 2024-2029 (%)
Data Table on France - Year-over-year growth 2024-2029 (%)

12.5.4 Spain - Market size and forecast 2024-2029

Chart on Spain - Market size and forecast 2024-2029 ($ million)
Data Table on Spain - Market size and forecast 2024-2029 ($ million)
Chart on Spain - Year-over-year growth 2024-2029 (%)
Data Table on Spain - Year-over-year growth 2024-2029 (%)

12.5.5 UK - Market size and forecast 2024-2029

Chart on UK - Market size and forecast 2024-2029 ($ million)
Data Table on UK - Market size and forecast 2024-2029 ($ million)
Chart on UK - Year-over-year growth 2024-2029 (%)
Data Table on UK - Year-over-year growth 2024-2029 (%)

12.5.6 Hungary - Market size and forecast 2024-2029

Chart on Hungary - Market size and forecast 2024-2029 ($ million)
Data Table on Hungary - Market size and forecast 2024-2029 ($ million)
Chart on Hungary - Year-over-year growth 2024-2029 (%)
Data Table on Hungary - Year-over-year growth 2024-2029 (%)

12.6 South America - Market size and forecast 2024-2029

Chart on South America - Market size and forecast 2024-2029 ($ million)
Data Table on South America - Market size and forecast 2024-2029 ($ million)
Chart on South America - Year-over-year growth 2024-2029 (%)
Data Table on South America - Year-over-year growth 2024-2029 (%)
Chart on Regional Comparison - South America
Data Table on Regional Comparison - South America

12.6.1 Brazil - Market size and forecast 2024-2029

Chart on Brazil - Market size and forecast 2024-2029 ($ million)
Data Table on Brazil - Market size and forecast 2024-2029 ($ million)
Chart on Brazil - Year-over-year growth 2024-2029 (%)
Data Table on Brazil - Year-over-year growth 2024-2029 (%)

12.6.2 Argentina - Market size and forecast 2024-2029

Chart on Argentina - Market size and forecast 2024-2029 ($ million)
Data Table on Argentina - Market size and forecast 2024-2029 ($ million)
Chart on Argentina - Year-over-year growth 2024-2029 (%)
Data Table on Argentina - Year-over-year growth 2024-2029 (%)

12.6.3 Colombia - Market size and forecast 2024-2029

Chart on Colombia - Market size and forecast 2024-2029 ($ million)
Data Table on Colombia - Market size and forecast 2024-2029 ($ million)
Chart on Colombia - Year-over-year growth 2024-2029 (%)
Data Table on Colombia - Year-over-year growth 2024-2029 (%)

12.7 Middle East and Africa - Market size and forecast 2024-2029

Chart on Middle East and Africa - Market size and forecast 2024-2029 ($ million)
Data Table on Middle East and Africa - Market size and forecast 2024-2029 ($ million)
Chart on Middle East and Africa - Year-over-year growth 2024-2029 (%)
Data Table on Middle East and Africa - Year-over-year growth 2024-2029 (%)
Chart on Regional Comparison - Middle East and Africa
Data Table on Regional Comparison - Middle East and Africa

12.7.1 Saudi Arabia - Market size and forecast 2024-2029

Chart on Saudi Arabia - Market size and forecast 2024-2029 ($ million)
Data Table on Saudi Arabia - Market size and forecast 2024-2029 ($ million)
Chart on Saudi Arabia - Year-over-year growth 2024-2029 (%)
Data Table on Saudi Arabia - Year-over-year growth 2024-2029 (%)

12.7.2 UAE - Market size and forecast 2024-2029

Chart on UAE - Market size and forecast 2024-2029 ($ million)
Data Table on UAE - Market size and forecast 2024-2029 ($ million)
Chart on UAE - Year-over-year growth 2024-2029 (%)
Data Table on UAE - Year-over-year growth 2024-2029 (%)

12.7.3 South Africa - Market size and forecast 2024-2029

Chart on South Africa - Market size and forecast 2024-2029 ($ million)
Data Table on South Africa - Market size and forecast 2024-2029 ($ million)
Chart on South Africa - Year-over-year growth 2024-2029 (%)
Data Table on South Africa - Year-over-year growth 2024-2029 (%)

12.7.4 Egypt - Market size and forecast 2024-2029

Chart on Egypt - Market size and forecast 2024-2029 ($ million)
Data Table on Egypt - Market size and forecast 2024-2029 ($ million)
Chart on Egypt - Year-over-year growth 2024-2029 (%)
Data Table on Egypt - Year-over-year growth 2024-2029 (%)

12.7.5 Morocco - Market size and forecast 2024-2029

Chart on Morocco - Market size and forecast 2024-2029 ($ million)
Data Table on Morocco - Market size and forecast 2024-2029 ($ million)
Chart on Morocco - Year-over-year growth 2024-2029 (%)
Data Table on Morocco - Year-over-year growth 2024-2029 (%)

12.8 Market opportunity by geography

Market opportunity by geography ($ million)
Data Tables on Market opportunity by geography ($ million)

13. Drivers, Challenges, and Opportunity

13.1 Market drivers

Heightened health and wellness consciousness propelling market growth
Surging demand for premium and functional water variants
Imperative of sustainability and eco-friendly packaging

13.2 Market challenges

Heightened environmental scrutiny and regulatory pressure on packaging
Intensifying competition from functional beverages and water alternatives
Water scarcity, source sustainability, and operational pressures

13.3 Impact of drivers and challenges

Impact of drivers and challenges in 2024 and 2029

13.4 Market opportunities

Critical imperative of sustainable packaging
Ascent of functional and flavored waters
Enduring allure of premiumization

14. Competitive Landscape

14.1 Overview

14.2

Overview on criticality of inputs and factors of differentiation

14.3 Landscape disruption

Overview on factors of disruption

14.4 Industry risks

Impact of key risks on business

15. Competitive Analysis

15.1 Companies profiled

Companies covered

15.2 Company ranking index

15.3 Market positioning of companies

Matrix on companies position and classification

15.4 Agthia Group PJSC

Agthia Group PJSC - Overview
Agthia Group PJSC - Business segments
Agthia Group PJSC - Key offerings
Agthia Group PJSC - Segment focus
SWOT

15.5 Bisleri International Pvt. Ltd.

Bisleri International Pvt. Ltd. - Overview
Bisleri International Pvt. Ltd. - Product / Service
Bisleri International Pvt. Ltd. - Key offerings
SWOT

15.6 China Resources Beverages Ltd.

China Resources Beverages Ltd. - Overview
China Resources Beverages Ltd. - Business segments
China Resources Beverages Ltd. - Key offerings
China Resources Beverages Ltd. - Segment focus
SWOT

15.7 Danone S.A.

Danone S.A. - Overview
Danone S.A. - Business segments
Danone S.A. - Key news
Danone S.A. - Key offerings
Danone S.A. - Segment focus
SWOT

15.8 Gerolsteiner Brunnen GmbH

Gerolsteiner Brunnen GmbH - Overview
Gerolsteiner Brunnen GmbH - Product / Service
Gerolsteiner Brunnen GmbH - Key offerings
SWOT

15.9 Grupo Embotellador ATIC SA

Grupo Embotellador ATIC SA - Overview
Grupo Embotellador ATIC SA - Product / Service
Grupo Embotellador ATIC SA - Key offerings
SWOT

15.10 Masafi Co. LLC

Masafi Co. LLC - Overview
Masafi Co. LLC - Product / Service
Masafi Co. LLC - Key offerings
SWOT

15.11 Mountain Valley Spring Co. LLC

Mountain Valley Spring Co. LLC - Overview
Mountain Valley Spring Co. LLC - Product / Service
Mountain Valley Spring Co. LLC - Key offerings
SWOT

15.12 Nestle SA

Nestle SA - Overview
Nestle SA - Business segments
Nestle SA - Key news
Nestle SA - Key offerings
Nestle SA - Segment focus
SWOT

15.13 Parle Agro Pvt Ltd.

Parle Agro Pvt Ltd. - Overview
Parle Agro Pvt Ltd. - Product / Service
Parle Agro Pvt Ltd. - Key offerings
SWOT

15.14 PepsiCo Inc.

PepsiCo Inc. - Overview
PepsiCo Inc. - Business segments
PepsiCo Inc. - Key news
PepsiCo Inc. - Key offerings
PepsiCo Inc. - Segment focus
SWOT

15.15 Tata Consumer Products Ltd.

Tata Consumer Products Ltd. - Overview
Tata Consumer Products Ltd. - Business segments
Tata Consumer Products Ltd. - Key offerings
Tata Consumer Products Ltd. - Segment focus
SWOT

15.16 The Coca Cola Co.

The Coca Cola Co. - Overview
The Coca Cola Co. - Business segments
The Coca Cola Co. - Key news
The Coca Cola Co. - Key offerings
The Coca Cola Co. - Segment focus
SWOT

15.17 The Wonderful Co. LLC

The Wonderful Co. LLC - Overview
The Wonderful Co. LLC - Product / Service
The Wonderful Co. LLC - Key offerings
SWOT

15.18 VOSS Global Inc.

VOSS Global Inc. - Overview
VOSS Global Inc. - Product / Service
VOSS Global Inc. - Key offerings
SWOT

16. Appendix

16.1 Scope of the report

Market definition
Objectives
Notes and caveats

16.2 Inclusions and exclusions checklist

Inclusions checklist
Exclusions checklist

16.3 Currency conversion rates for US$

16.4 Research methodology

16.5 Data procurement

Information sources

16.6 Data validation

16.7 Validation techniques employed for market sizing

16.8 Data synthesis

16.9 360 degree market analysis

16.10 List of abbreviations

Research Methodology

Technavio presents a detailed picture of the market by way of study, synthesis, and summation of data from multiple sources. The analysts have presented the various facets of the market with a particular focus on identifying the key industry influencers. The data thus presented is comprehensive, reliable, and the result of extensive research, both primary and secondary.

INFORMATION SOURCES

Primary sources

  • Manufacturers and suppliers
  • Channel partners
  • Industry experts
  • Strategic decision makers

Secondary sources

  • Industry journals and periodicals
  • Government data
  • Financial reports of key industry players
  • Historical data
  • Press releases

DATA ANALYSIS

Data Synthesis

  • Collation of data
  • Estimation of key figures
  • Analysis of derived insights

Data Validation

  • Triangulation with data models
  • Reference against proprietary databases
  • Corroboration with industry experts

REPORT WRITING

Qualitative

  • Market drivers
  • Market challenges
  • Market trends
  • Five forces analysis

Quantitative

  • Market size and forecast
  • Market segmentation
  • Geographical insights
  • Competitive landscape

Interested in this report?

Get your sample now to see our research methodology and insights!

Download Now

Frequently Asked Questions

Packaged Natural Mineral Water market growth will increase by USD 55198.2 million during 2025-2029.

The Packaged Natural Mineral Water market is expected to grow at a CAGR of 6.1% during 2025-2029.

Packaged Natural Mineral Water market is segmented by Distribution channel (Offline, Online) Product (Packaged natural sparkling mineral water, Packaged natural still mineral water) Type of packaging (Plastic bottles, Glass bottles, Cans)

Agthia Group PJSC, Beverly Hills Drink Co., Bisleri International Pvt. Ltd., China Resources Beverages Ltd., Danone S.A., Gerolsteiner Brunnen GmbH, Grupo Embotellador ATIC SA, Masafi Co. LLC, Mountain Valley Spring Co. LLC, Nestle SA, Parle Agro Pvt Ltd., PepsiCo Inc., Tata Consumer Products Ltd., The Coca Cola Co., The Wonderful Co. LLC, United Breweries Ltd., VOSS Global Inc. are a few of the key vendors in the Packaged Natural Mineral Water market.

APAC will register the highest growth rate of 41.6% among the other regions. Therefore, the Packaged Natural Mineral Water market in APAC is expected to garner significant business opportunities for the vendors during the forecast period.

China, India, Japan, Indonesia, South Korea, Australia, US, Canada, Mexico, Germany, Italy, France, Spain, UK, Hungary, Brazil, Argentina, Colombia, Saudi Arabia, UAE, South Africa, Egypt, Morocco

  • Heightened health and wellness consciousness propelling market growth is the driving factor this market.

The Packaged Natural Mineral Water market vendors should focus on grabbing business opportunities from the Distribution channel segment as it accounted for the largest market share in the base year.