US - Packaged Rice Snacks Market by Distribution Channel, Product and Type - Forecast and Analysis 2024-2028

US - Packaged Rice Snacks Market by Distribution Channel, Product and Type - Forecast and Analysis 2024-2028

Published: Jan 2024 87 Pages SKU: IRTNTR45880

Market Overview at a Glance

$396.82 Mn
Market Opportunity
5.82%
CAGR
4.8
YoY growth 2023-2024(%)

US Packaged Rice Snacks Market Size 2024-2028 

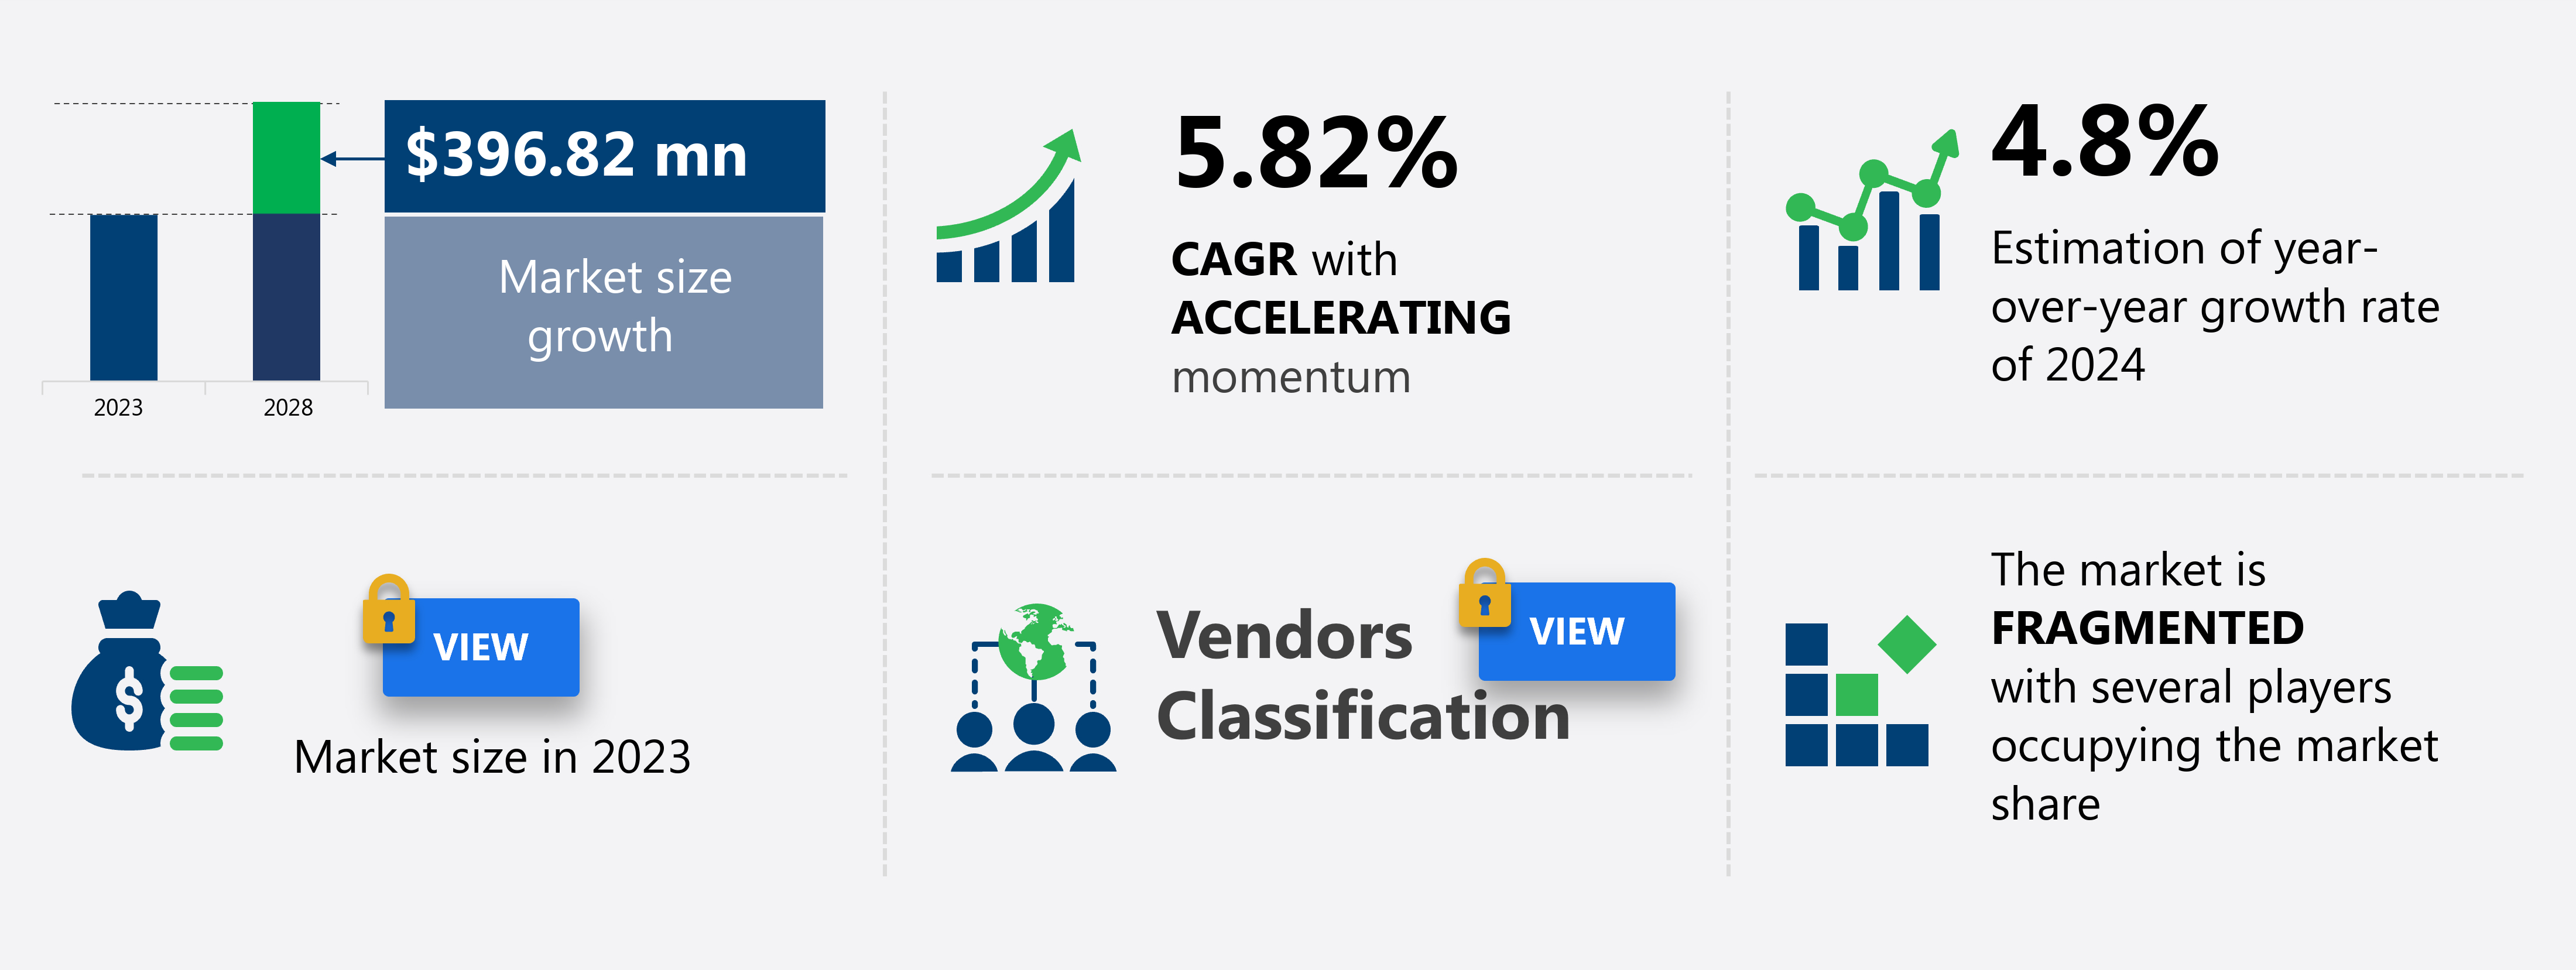
The US Packaged Rice Snacks market size is forecast to increase by USD 396.82 million at a CAGR of 5.82% between 2023 and 2028.

  • The packaged rice snacks market in the US is witnessing significant growth due to the rising demand for healthy snack options. Consumers are increasingly opting for rice snacks due to their perceived health benefits, such as being gluten-free and low in sodium. This trend is further fueled by the expanding retail and online distribution landscape, making rice snacks more accessible to a wider audience. However, the market faces stiff competition from other packaged snacks, including chips and popcorn. Companies in the rice snacks industry must differentiate themselves through innovative product offerings, unique flavors, and effective marketing strategies to capture market share.
  • Additionally, addressing consumer concerns regarding the potential presence of artificial additives and preservatives is crucial for maintaining brand reputation and customer loyalty. To capitalize on the market's growth potential and navigate competition effectively, companies must focus on product innovation, strategic partnerships, and targeted marketing efforts.

What will be the size of the US Packaged Rice Snacks Market during the forecast period?

Packaged Rice Snacks Market in US Size

 Explore in-depth regional segment analysis with market size data - historical 2018-2022 and forecasts 2024-2028 - in the full report.  
Request Free Sample

  • In the US packaged rice snacks market, distribution network optimization and product lifecycle management are key focus areas for market players. Companies are investing in advanced technologies to enhance their supply chain efficiency and ensure timely delivery of products. Product recyclability is another crucial trend, with manufacturers exploring coating application methods and process improvement methods to create eco-friendly packaging solutions. Rice variety selection and brand awareness metrics play a significant role in market share calculation. Packaging film properties are under scrutiny for their impact on product freshness and consumer perception. Market leaders are leveraging demand forecasting models and inventory management systems to minimize energy consumption and optimize resources.
  • Pricing strategy simulation and consumer insights research are essential for staying competitive in the market. Nutrient fortification strategies and microbial contamination control are critical for maintaining product quality and safety. Automation solutions and circular economy principles are driving innovation in production processes. Consumer feedback analysis and cost reduction measures are essential for maintaining customer satisfaction and profitability. Texture modification techniques and ingredient substitution options cater to evolving consumer preferences. Seal integrity testing and allergen management practices ensure food safety and regulatory compliance. E-commerce sales channels and digital marketing strategies are transforming the way rice snacks are marketed and sold.
  • Promotional campaign effectiveness and marketing ROI analysis are crucial metrics for measuring marketing success. Sales data visualization and quality assurance protocols enable data-driven decision-making and continuous improvement.

How is this market segmented?

The market research report provides comprehensive data (region-wise segment analysis), with forecasts and estimates in "USD million" for the period 2024-2028, as well as historical data from 2018-2022 for the following segments.

  • Distribution Channel
    • Offline
    • Online
  • Product
    • Rice cakes
    • RCCB
    • Rice crisps
  • Type
    • Conventional
    • Organic
  • Geography
    • North America
      • US

By Distribution Channel Insights

The offline segment is estimated to witness significant growth during the forecast period.

In the dynamic packaged rice snacks market, various entities play crucial roles in shaping trends and market activities. Ingredient cost analysis is a significant factor in product formulation, with manufacturers continually optimizing sodium, fat, and calorie content to cater to consumer preferences. Waste reduction strategies are prioritized through process optimization techniques and packaging design innovation. Shelf stability testing ensures product longevity, while production line efficiency is essential for maintaining competitiveness. Consumer preference data and segmentation guide new product development, with a focus on sustainability and nutritional content labeling. Ingredient sourcing sustainability is a growing concern, with companies adopting traceability systems and eco-friendly practices.

Marketing campaign effectiveness is assessed through sales performance tracking and consumer feedback, driving continuous improvement. Packaging waste management is a critical aspect, with sustainable materials and recycling initiatives gaining traction. Supply chain management and distribution channel efficiency are essential for maintaining product availability and competitive pricing. Competitive product analysis and food safety regulations ensure quality and compliance. Carbohydrate composition, rice snack texture, and flavor profile optimization cater to diverse consumer preferences. Retail display optimization and sensory evaluation methods are employed to enhance consumer appeal and satisfaction. Target audience profiles guide product pricing strategies, with a focus on value and affordability.

Snack food processing techniques, such as extrusion and puffing, are continually refined for improved texture and taste. Overall, the packaged rice snacks market is characterized by innovation, efficiency, and a commitment to consumer preferences and sustainability.

Packaged Rice Snacks Market in US Share by Distribution Channel

Request Free Sample

The Offline segment was valued at  USD 804.03 million in 2018 and showed a gradual increase during the forecast period.

Market Dynamics

The Packaged rice snacks US market is experiencing significant growth, driven by a rising consumer demand for healthy rice snacks US. This trend is particularly evident in the increasing preference for gluten-free rice snacks US, making rice cakes US and rice crackers US highly popular choices. Many consumers are seeking low-calorie rice snacks US and Organic Rice snacks US for their daily consumption. The market also sees strong interest in diverse product types like puffed rice snacks US and rice chips US. As lifestyles become more fast-paced, the need for convenient on-the-go rice snacks US is paramount. Exploring the US rice snack market dynamics reveals continuous innovation, with leading rice snack brands US focusing on developing new flavors, especially savory rice snacks US. This widespread appeal extends to children's rice snacks US, and the overall rice snack industry trends US indicate a robust future, particularly for brown rice crackers US as a nutritious option, further influencing rice snack innovation US.

Our researchers analyzed the data with 2023 as the base year, along with the key drivers, trends, and challenges. A holistic analysis of drivers will help companies refine their marketing strategies to gain a competitive advantage.

What are the US Packaged Rice Snacks Market market drivers leading to the rise in adoption of the Industry?

  • The surge in consumer preference for health-conscious snacking options is the primary market catalyst, driving significant growth within this industry. 
  • Packaged rice snacks have gained significant traction in the US market due to the increasing preference for healthier alternatives to traditional snacks. The trend of snacking during work hours and in between meals has become prevalent, leading to a surge in demand for nutritious and convenient options. However, consumer concerns regarding the excessive use of trans fats, sodium, calorie content, sugar, and other harmful ingredients in processed snacks have fueled the adoption of packaged rice snacks. These snacks offer a healthier alternative, often containing whole grains and minimal additives. To cater to this demand, companies are focusing on ingredient cost analysis, waste reduction strategies, and production line efficiency.
  • Shelf stability testing is crucial to ensure the longevity of these snacks. Packaging design innovation plays a significant role in attracting consumers, with an emphasis on sustainability and consumer segmentation. Consumer preference data is extensively used to understand market dynamics and tailor product offerings. Additionally, ingredient sourcing sustainability is a growing concern, with companies prioritizing ethical and environmentally friendly practices. These factors contribute to the continued growth and competitiveness of the packaged rice snacks market.

What are the US Packaged Rice Snacks Market market trends shaping the Industry?

  • The retail and online distribution landscapes are experiencing significant expansion, representing a prominent market trend. This growth encompasses both brick-and-mortar stores and e-commerce platforms, offering consumers greater convenience and accessibility.
  • Packaged rice snacks have experienced growing demand in the US market due to their health benefits. Distributors play a crucial role in the supply chain, providing both branded and local options to consumers. Supermarkets and hypermarkets are the primary channels for purchasing packaged food products, offering convenience and cost-effectiveness. The proliferation of these distribution channels has significantly expanded across the US. Effective marketing campaigns are essential for companies to stand out in this competitive market. Sustainability is a key consideration, with packaging waste management and the use of sustainable materials becoming increasingly important.
  • Sales performance tracking is another critical aspect, allowing companies to monitor their market position and respond to trends. Product formulation, including sodium content reduction, is also a focus area for companies seeking to cater to health-conscious consumers. Competitive product analysis is ongoing, as companies strive to differentiate themselves and meet evolving consumer preferences.

How does US Packaged Rice Snacks Market market faces challenges face during its growth?

  • The packaged snack industry faces significant competition from various other snack brands, posing a substantial challenge to its growth. 
  • The packaged rice snacks market in the US faces challenges from increasing competition and shifting consumer preferences. Other snack categories, such as cereal bars, dried fruit, meat snacks, and Frozen Yogurt, are gaining popularity due to their nutritional value and innovative offerings. Consumers' preferences for snacks containing buckwheat and popcorn instead of rice snacks also impact market growth. Moreover, the relatively low consumption of rice and rice-based products in the US, outside of the Asian population, adversely affects the market.
  • To remain competitive, companies are focusing on process optimization techniques, fat content optimization, and flavor profile optimization to meet quality control metrics and calorie reduction strategies. Nutritional content labeling and ingredient traceability systems are also essential for maintaining consumer trust and regulatory compliance. New product development remains a key strategy for market growth, with an emphasis on catering to diverse consumer preferences and dietary needs.

Exclusive US Packaged Rice Snacks Market Customer Landscape

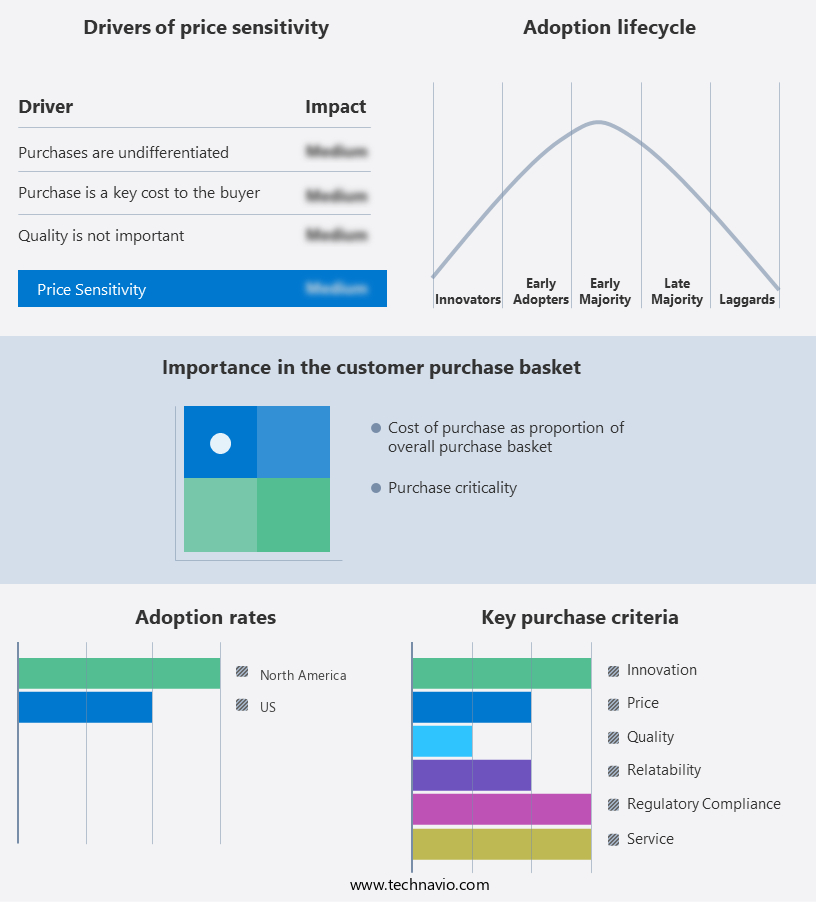
The market forecasting report includes the adoption lifecycle of the market, covering from the innovator's stage to the laggard's stage. It focuses on adoption rates in different regions based on penetration. Furthermore, the report also includes key purchase criteria and drivers of price sensitivity to help companies evaluate and develop their market growth analysis strategies.

Packaged Rice Snacks Market in US Share by Geography

 Customer Landscape

Key Companies & Market Insights

Companies are implementing various strategies, such as strategic alliances, market forecast partnerships, mergers and acquisitions, geographical expansion, and product/service launches, to enhance their presence in the market.

The market research and growth report includes detailed analyses of the competitive landscape of the market and information about key companies, including:

  • Blue Diamond Growers
  • Dang Foods Co.
  • De Katjang BV
  • Edward and Sons Trading Co.
  • Element Snacks Inc
  • Galil Brands
  • General Mills Inc.
  • High Valley Grains
  • JOY SNACKS LLC
  • KAMEDA SEIKA CO. LTD.
  • Kellogg Co.
  • Lundberg Family Farms
  • Paskesz Candy Co.
  • PepsiCo Inc.
  • Ricegrowers Ltd.
  • TH Foods Inc.
  • Topco Associates LLC
  • Umeya Inc.
  • Wholesome Goodness LLC.
  • Wide Faith Foods Co Ltd

Qualitative and quantitative analysis of companies has been conducted to help clients understand the wider business environment as well as the strengths and weaknesses of key market players. Data is qualitatively analyzed to categorize companies as pure play, category-focused, industry-focused, and diversified; it is quantitatively analyzed to categorize companies as dominant, leading, strong, tentative, and weak.

Recent Development and News in Packaged Rice Snacks Market In US

  • In January 2024, Quaker Oats, a subsidiary of PepsiCo, introduced a new line of rice snacks called "Quaker Rice Crisps" in the US market. These rice snacks are gluten-free, non-GMO, and come in various flavors, expanding Quaker's product portfolio and catering to the growing demand for healthier snack options (Quaker Oats press release).
  • In March 2024, Conagra Brands, a leading food company, announced a strategic partnership with Biena Foods, a rice snack manufacturer, to distribute and market Biena's rice snacks under the Conagra umbrella. This collaboration aimed to leverage Conagra's extensive distribution network and Biena's innovative rice snack products (Conagra Brands press release).
  • In May 2024, RiceWorks, a rice snack manufacturer, completed a USD25 million Series C funding round, led by S2G Ventures. This investment will be used to expand RiceWorks' production capacity and support the launch of new product lines (RiceWorks press release).
  • In January 2025, the US Food and Drug Administration (FDA) approved the use of a new natural preservative, natamycin, for rice-based snacks. This approval opened the door for manufacturers to offer longer shelf life and improved product quality, addressing a significant challenge in the packaged rice snacks market (FDA press release).

Research Analyst Overview

The packaged rice snacks market in the US continues to evolve, with dynamic market activities unfolding across various sectors. Process optimization techniques are being integrated into production lines to enhance efficiency and reduce waste. Ingredient cost analysis is a critical consideration, with a focus on fat content optimization and flavor profile optimization to cater to diverse consumer preferences. Quality control metrics are stringently enforced to ensure consistency and adherence to food safety regulations. New product development is a key driver, with calorie reduction strategies and nutritional content labeling becoming increasingly important. Ingredient sourcing sustainability is a growing concern, with companies implementing traceability systems to ensure transparency and ethical sourcing.

Sensory evaluation methods are used to optimize rice snack texture and taste, while marketing campaign effectiveness is closely monitored to maximize sales performance. Sustainable packaging materials are gaining popularity, with waste management a priority in the supply chain. Competitive product analysis is ongoing, with companies continuously innovating to differentiate themselves. Product pricing strategy is a crucial factor in distribution channel efficiency, with retail display optimization a key consideration to maximize visibility and sales. Carbohydrate composition and target audience profiles are also important factors in formulating new rice snack offerings. The market's continuous dynamism underscores the importance of staying agile and responsive to evolving consumer trends and regulatory requirements.

Dive into Technavio's robust research methodology, blending expert interviews, extensive data synthesis, and validated models for unparalleled Packaged Rice Snacks Market in US insights. See full methodology.

Market Scope

Report Coverage

Details

Page number

87

Base year

2023

Historic period

2018-2022

Forecast period

2024-2028

Growth momentum & CAGR

Accelerate at a CAGR of 5.82%

Market growth 2024-2028

USD 396.82 million

Market structure

Fragmented

YoY growth 2023-2024(%)

4.8

Competitive landscape

Leading Companies, Market Positioning of Companies, Competitive Strategies, and Industry Risks

Request Free Sample

What are the Key Data Covered in this Market Research Report?

  • CAGR of the market during the forecast period
  • Detailed information on factors that will drive the market growth and forecasting between 2024 and 2028
  • Precise estimation of the size of the market  and its contribution of the market in focus to the parent market
  • Accurate predictions about upcoming market growth and trends and changes in consumer behaviour
  • Growth of the market across US
  • Thorough analysis of the market's competitive landscape and detailed information about companies
  • Comprehensive analysis of factors that will challenge the growth of market companies

We can help! Our analysts can customize this market research report to meet your requirements Get in touch

1 Executive Summary

  • 1.1 Market overview
    • Exhibit 01: Executive Summary – Chart on Market Overview
    • Exhibit 02: Executive Summary – Data Table on Market Overview
    • Exhibit 03: Executive Summary – Chart on Country Market Characteristics
    • Exhibit 04: Executive Summary – Chart on Market Segmentation by Distribution Channel
    • Exhibit 05: Executive Summary – Chart on Market Segmentation by Product
    • Exhibit 06: Executive Summary – Chart on Market Segmentation by Type
    • Exhibit 07: Executive Summary – Chart on Vendor Market Positioning

2 Market Landscape

  • 2.1 Market ecosystem
    • Exhibit 08: Parent market
    • Exhibit 09: Market Characteristics

3 Market Sizing

  • 3.1 Market definition
    • Exhibit 10: Offerings of vendors included in the market definition
  • 3.2 Market segment analysis
    • Exhibit 11: Market segments
  • 3.3 Market size 2023
    • 3.4 Market outlook: Forecast for 2023-2028
      • Exhibit 12: Chart on US - Market size and forecast 2023-2028 ($ million)
      • Exhibit 13: Data Table on US - Market size and forecast 2023-2028 ($ million)
      • Exhibit 14: Chart on US: Year-over-year growth 2023-2028 (%)
      • Exhibit 15: Data Table on US: Year-over-year growth 2023-2028 (%)

    4 Historic Market Size

    • 4.1 Packaged rice snacks market in US 2018 - 2022
      • Exhibit 16: Historic Market Size – Data Table on packaged rice snacks market in US 2018 - 2022 ($ million)
    • 4.2 Distribution Channel Segment Analysis 2018 - 2022
      • Exhibit 17: Historic Market Size – Distribution Channel Segment 2018 - 2022 ($ million)
    • 4.3 Product Segment Analysis 2018 - 2022
      • Exhibit 18: Historic Market Size – Product Segment 2018 - 2022 ($ million)
    • 4.4 Type Segment Analysis 2018 - 2022
      • Exhibit 19: Historic Market Size – Type Segment 2018 - 2022 ($ million)

    5 Five Forces Analysis

    • 5.1 Five forces summary
      • Exhibit 20: Five forces analysis - Comparison between 2023 and 2028
    • 5.2 Bargaining power of buyers
      • Exhibit 21: Chart on Bargaining power of buyers – Impact of key factors 2023 and 2028
    • 5.3 Bargaining power of suppliers
      • Exhibit 22: Bargaining power of suppliers – Impact of key factors in 2023 and 2028
    • 5.4 Threat of new entrants
      • Exhibit 23: Threat of new entrants – Impact of key factors in 2023 and 2028
    • 5.5 Threat of substitutes
      • Exhibit 24: Threat of substitutes – Impact of key factors in 2023 and 2028
    • 5.6 Threat of rivalry
      • Exhibit 25: Threat of rivalry – Impact of key factors in 2023 and 2028
    • 5.7 Market condition
      • Exhibit 26: Chart on Market condition - Five forces 2023 and 2028

    6 Market Segmentation by Distribution Channel

    • 6.1 Market segments
      • Exhibit 27: Chart on Distribution Channel - Market share 2023-2028 (%)
      • Exhibit 28: Data Table on Distribution Channel - Market share 2023-2028 (%)
    • 6.2 Comparison by Distribution Channel
      • Exhibit 29: Chart on Comparison by Distribution Channel
      • Exhibit 30: Data Table on Comparison by Distribution Channel
    • 6.3 Offline - Market size and forecast 2023-2028
      • Exhibit 31: Chart on Offline - Market size and forecast 2023-2028 ($ million)
      • Exhibit 32: Data Table on Offline - Market size and forecast 2023-2028 ($ million)
      • Exhibit 33: Chart on Offline - Year-over-year growth 2023-2028 (%)
      • Exhibit 34: Data Table on Offline - Year-over-year growth 2023-2028 (%)
    • 6.4 Online - Market size and forecast 2023-2028
      • Exhibit 35: Chart on Online - Market size and forecast 2023-2028 ($ million)
      • Exhibit 36: Data Table on Online - Market size and forecast 2023-2028 ($ million)
      • Exhibit 37: Chart on Online - Year-over-year growth 2023-2028 (%)
      • Exhibit 38: Data Table on Online - Year-over-year growth 2023-2028 (%)
    • 6.5 Market opportunity by Distribution Channel
      • Exhibit 39: Market opportunity by Distribution Channel ($ million)
      • Exhibit 40: Data Table on Market opportunity by Distribution Channel ($ million)

    7 Market Segmentation by Product

    • 7.1 Market segments
      • Exhibit 41: Chart on Product - Market share 2023-2028 (%)
      • Exhibit 42: Data Table on Product - Market share 2023-2028 (%)
    • 7.2 Comparison by Product
      • Exhibit 43: Chart on Comparison by Product
      • Exhibit 44: Data Table on Comparison by Product
    • 7.3 Rice cakes - Market size and forecast 2023-2028
      • Exhibit 45: Chart on Rice cakes - Market size and forecast 2023-2028 ($ million)
      • Exhibit 46: Data Table on Rice cakes - Market size and forecast 2023-2028 ($ million)
      • Exhibit 47: Chart on Rice cakes - Year-over-year growth 2023-2028 (%)
      • Exhibit 48: Data Table on Rice cakes - Year-over-year growth 2023-2028 (%)
    • 7.4 RCCB - Market size and forecast 2023-2028
      • Exhibit 49: Chart on RCCB - Market size and forecast 2023-2028 ($ million)
      • Exhibit 50: Data Table on RCCB - Market size and forecast 2023-2028 ($ million)
      • Exhibit 51: Chart on RCCB - Year-over-year growth 2023-2028 (%)
      • Exhibit 52: Data Table on RCCB - Year-over-year growth 2023-2028 (%)
    • 7.5 Rice crisps - Market size and forecast 2023-2028
      • Exhibit 53: Chart on Rice crisps - Market size and forecast 2023-2028 ($ million)
      • Exhibit 54: Data Table on Rice crisps - Market size and forecast 2023-2028 ($ million)
      • Exhibit 55: Chart on Rice crisps - Year-over-year growth 2023-2028 (%)
      • Exhibit 56: Data Table on Rice crisps - Year-over-year growth 2023-2028 (%)
    • 7.6 Market opportunity by Product
      • Exhibit 57: Market opportunity by Product ($ million)
      • Exhibit 58: Data Table on Market opportunity by Product ($ million)

    8 Market Segmentation by Type

    • 8.1 Market segments
      • Exhibit 59: Chart on Type - Market share 2023-2028 (%)
      • Exhibit 60: Data Table on Type - Market share 2023-2028 (%)
    • 8.2 Comparison by Type
      • Exhibit 61: Chart on Comparison by Type
      • Exhibit 62: Data Table on Comparison by Type
    • 8.3 Conventional - Market size and forecast 2023-2028
      • Exhibit 63: Chart on Conventional - Market size and forecast 2023-2028 ($ million)
      • Exhibit 64: Data Table on Conventional - Market size and forecast 2023-2028 ($ million)
      • Exhibit 65: Chart on Conventional - Year-over-year growth 2023-2028 (%)
      • Exhibit 66: Data Table on Conventional - Year-over-year growth 2023-2028 (%)
    • 8.4 Organic - Market size and forecast 2023-2028
      • Exhibit 67: Chart on Organic - Market size and forecast 2023-2028 ($ million)
      • Exhibit 68: Data Table on Organic - Market size and forecast 2023-2028 ($ million)
      • Exhibit 69: Chart on Organic - Year-over-year growth 2023-2028 (%)
      • Exhibit 70: Data Table on Organic - Year-over-year growth 2023-2028 (%)
    • 8.5 Market opportunity by Type
      • Exhibit 71: Market opportunity by Type ($ million)
      • Exhibit 72: Data Table on Market opportunity by Type ($ million)

    9 Customer Landscape

    • 9.1 Customer landscape overview
      • Exhibit 73: Analysis of price sensitivity, lifecycle, customer purchase basket, adoption rates, and purchase criteria

    10 Drivers, Challenges, and Trends

    • 10.1 Market drivers
      • 10.2 Market challenges
        • 10.3 Impact of drivers and challenges
          • Exhibit 74: Impact of drivers and challenges in 2023 and 2028
        • 10.4 Market trends

          11 Vendor Landscape

          • 11.1 Overview
            • 11.2 Vendor landscape
              • Exhibit 75: Overview on Criticality of inputs and Factors of differentiation
            • 11.3 Landscape disruption
              • Exhibit 76: Overview on factors of disruption
            • 11.4 Industry risks
              • Exhibit 77: Impact of key risks on business

            12 Vendor Analysis

            • 12.1 Vendors covered
              • Exhibit 78: Vendors covered
            • 12.2 Market positioning of vendors
              • Exhibit 79: Matrix on vendor position and classification
            • 12.3 Blue Diamond Growers
              • Exhibit 80: Blue Diamond Growers - Overview
              • Exhibit 81: Blue Diamond Growers - Product / Service
              • Exhibit 82: Blue Diamond Growers - Key offerings
            • 12.4 Dang Foods Co.
              • Exhibit 83: Dang Foods Co. - Overview
              • Exhibit 84: Dang Foods Co. - Product / Service
              • Exhibit 85: Dang Foods Co. - Key offerings
            • 12.5 Edward and Sons Trading Co.
              • Exhibit 86: Edward and Sons Trading Co. - Overview
              • Exhibit 87: Edward and Sons Trading Co. - Product / Service
              • Exhibit 88: Edward and Sons Trading Co. - Key offerings
            • 12.6 Element Snacks Inc
              • Exhibit 89: Element Snacks Inc - Overview
              • Exhibit 90: Element Snacks Inc - Product / Service
              • Exhibit 91: Element Snacks Inc - Key offerings
            • 12.7 Galil Brands
              • Exhibit 92: Galil Brands - Overview
              • Exhibit 93: Galil Brands - Product / Service
              • Exhibit 94: Galil Brands - Key offerings
            • 12.8 General Mills Inc.
              • Exhibit 95: General Mills Inc. - Overview
              • Exhibit 96: General Mills Inc. - Business segments
              • Exhibit 97: General Mills Inc. - Key news
              • Exhibit 98: General Mills Inc. - Key offerings
              • Exhibit 99: General Mills Inc. - Segment focus
            • 12.9 High Valley Grains
              • Exhibit 100: High Valley Grains - Overview
              • Exhibit 101: High Valley Grains - Product / Service
              • Exhibit 102: High Valley Grains - Key offerings
            • 12.10 KAMEDA SEIKA CO. LTD.
              • Exhibit 103: KAMEDA SEIKA CO. LTD. - Overview
              • Exhibit 104: KAMEDA SEIKA CO. LTD. - Product / Service
              • Exhibit 105: KAMEDA SEIKA CO. LTD. - Key offerings
            • 12.11 Kellogg Co.
              • Exhibit 106: Kellogg Co. - Overview
              • Exhibit 107: Kellogg Co. - Business segments
              • Exhibit 108: Kellogg Co. - Key news
              • Exhibit 109: Kellogg Co. - Key offerings
              • Exhibit 110: Kellogg Co. - Segment focus
            • 12.12 Lundberg Family Farms
              • Exhibit 111: Lundberg Family Farms - Overview
              • Exhibit 112: Lundberg Family Farms - Product / Service
              • Exhibit 113: Lundberg Family Farms - Key offerings
            • 12.13 Paskesz Candy Co.
              • Exhibit 114: Paskesz Candy Co. - Overview
              • Exhibit 115: Paskesz Candy Co. - Product / Service
              • Exhibit 116: Paskesz Candy Co. - Key offerings
            • 12.14 PepsiCo Inc.
              • Exhibit 117: PepsiCo Inc. - Overview
              • Exhibit 118: PepsiCo Inc. - Business segments
              • Exhibit 119: PepsiCo Inc. - Key news
              • Exhibit 120: PepsiCo Inc. - Key offerings
              • Exhibit 121: PepsiCo Inc. - Segment focus
            • 12.15 Ricegrowers Ltd.
              • Exhibit 122: Ricegrowers Ltd. - Overview
              • Exhibit 123: Ricegrowers Ltd. - Product / Service
              • Exhibit 124: Ricegrowers Ltd. - Key offerings
            • 12.16 Topco Associates LLC
              • Exhibit 125: Topco Associates LLC - Overview
              • Exhibit 126: Topco Associates LLC - Product / Service
              • Exhibit 127: Topco Associates LLC - Key offerings
            • 12.17 Umeya Inc.
              • Exhibit 128: Umeya Inc. - Overview
              • Exhibit 129: Umeya Inc. - Product / Service
              • Exhibit 130: Umeya Inc. - Key offerings

            13 Appendix

            • 13.1 Scope of the report
              • 13.2 Inclusions and exclusions checklist
                • Exhibit 131: Inclusions checklist
                • Exhibit 132: Exclusions checklist
              • 13.3 Currency conversion rates for US$
                • Exhibit 133: Currency conversion rates for US$
              • 13.4 Research methodology
                • Exhibit 134: Research methodology
                • Exhibit 135: Validation techniques employed for market sizing
                • Exhibit 136: Information sources
              • 13.5 List of abbreviations
                • Exhibit 137: List of abbreviations

              Research Methodology

              Technavio presents a detailed picture of the market by way of study, synthesis, and summation of data from multiple sources. The analysts have presented the various facets of the market with a particular focus on identifying the key industry influencers. The data thus presented is comprehensive, reliable, and the result of extensive research, both primary and secondary.

              INFORMATION SOURCES

              Primary sources

              • Manufacturers and suppliers
              • Channel partners
              • Industry experts
              • Strategic decision makers

              Secondary sources

              • Industry journals and periodicals
              • Government data
              • Financial reports of key industry players
              • Historical data
              • Press releases

              DATA ANALYSIS

              Data Synthesis

              • Collation of data
              • Estimation of key figures
              • Analysis of derived insights

              Data Validation

              • Triangulation with data models
              • Reference against proprietary databases
              • Corroboration with industry experts

              REPORT WRITING

              Qualitative

              • Market drivers
              • Market challenges
              • Market trends
              • Five forces analysis

              Quantitative

              • Market size and forecast
              • Market segmentation
              • Geographical insights
              • Competitive landscape

              Interested in this report?

              Get your sample now to see our research methodology and insights!

              Download Now

              Frequently Asked Questions

              Packaged Rice Snacksin US market growth will increase by $ 396.82 mn during 2024-2028 .

              The Packaged Rice Snacksin US market is expected to grow at a CAGR of 5.82% during 2024-2028 .

              Packaged Rice Snacksin US market is segmented by Distribution Channel( Offline, Online, Rice crisps) Product( Rice cakes, RCCB, Rice crisps) Type( Conventional, Organic)

              Blue Diamond Growers, Dang Foods Co., De Katjang BV, Edward and Sons Trading Co., Element Snacks Inc, Galil Brands, General Mills Inc., High Valley Grains, JOY SNACKS LLC, KAMEDA SEIKA CO. LTD., Kellogg Co., Lundberg Family Farms, Paskesz Candy Co., PepsiCo Inc., Ricegrowers Ltd., TH Foods Inc., Topco Associates LLC, Umeya Inc., Wholesome Goodness LLC., Wide Faith Foods Co Ltd are a few of the key vendors in the Packaged Rice Snacksin US market.

              North America will register the highest growth rate of 100% among the other regions. Therefore, the Packaged Rice Snacksin US market in North America is expected to garner significant business opportunities for the vendors during the forecast period.

              US, North America

              • Rising demand for healthy snacksSnacks are popular alternatives to whole food meals. The trend of snacking during working hours and in between meals has become popular in the US. This has increased the demand for healthy snacks among consumers. Moreover is the driving factor this market.
              • the excess of trans fats is the driving factor this market.
              • sodium is the driving factor this market.
              • calorie content is the driving factor this market.
              • sugar is the driving factor this market.
              • and other harmful content in processed snacks is increasing the adoption of packaged healthy snacks. Eating junk foods as snacks may lead to obesity and various other chronic diseases such as type-2 diabetes is the driving factor this market.
              • cancer is the driving factor this market.
              • liver diseases is the driving factor this market.
              • and cardiovascular diseases (CVDs). According to the data stated by the Centers for Disease Control and Prevention (CDC) in September 2020 is the driving factor this market.
              • coronary heart disease is the driving factor this market.
              • which is one of the most common types of CVDs is the driving factor this market.
              • leads to the death of more than 370 is the driving factor this market.
              • 000 people each year in the US. Hence is the driving factor this market.
              • the growing prevalence and incidence of CVDs and various other chronic diseases are raising the demand for healthy snacks in the US. Food products containing brown rice help reduce the risk of chronic diseases and certain cancers. Hence is the driving factor this market.
              • the health benefits offered by rice products can encourage consumers to shift to packaged rice snacks and is the driving factor this market.
              • subsequently is the driving factor this market.
              • drive the growth of the global packaged rice snacks market during the forecast period. Packaged rice snacks are generally made from brown rice and are a good source of fiber and carbohydrates. These snacks help in reducing various chronic diseases is the driving factor this market.
              • including cancer. Packaged rice snacks are fortified with minerals such as magnesium is the driving factor this market.
              • zinc is the driving factor this market.
              • and iron. The fiber content of packaged rice snacks helps improve gut health is the driving factor this market.
              • reducing inflammation is the driving factor this market.
              • and boosting metabolism. Rice is considered an important source of energy is the driving factor this market.
              • as it contains a high amount of whole grain. Hence is the driving factor this market.
              • packaged rice snacks are healthy alternatives to potato chips and other unhealthy snacking options. Rice snacks such as rice cakes are low in calories is the driving factor this market.
              • protein is the driving factor this market.
              • and fiber. Therefore is the driving factor this market.
              • they are mainly consumed as low-calorie suitable substitutes for bread and other crackers. In addition is the driving factor this market.
              • gluten-free packaged rice snacks are available for individuals with celiac disease or gluten sensitivities. Vendors in the packaged rice snacks market in US are offering a wide range of rice snacks that are gluten-free and low in calories. Some of the examples are mentioned below: The Quaker Oats Co. (a part of PepsiCo Inc.) offers Quaker Rice Crisps Chocolate is the driving factor this market.
              • which are gluten-free and low-fat rice snacks made with whole grain brown rice and corn. TH Foods Inc. (a part of KAMEDA SEIKA CO. LTD.) offers low-fat is the driving factor this market.
              • low-calorie is the driving factor this market.
              • and hypoallergenic rice crackers in North America is the driving factor this market.
              • including the US. The growing prevalence of various chronic diseases is the driving factor this market.
              • coupled with unhealthy food habits is the driving factor this market.
              • increasing awareness of healthy snacking is the driving factor this market.
              • and easy availability of healthy rice snacks is the driving factor this market.
              • is raising the demand for packaged rice snacks in the US. This is the driving factor this market.
              • in turn is the driving factor this market.
              • is fostering the growth of the packaged rice snacks market in US and will encourage consumers to opt for gluten-free products such as rice cakes is the driving factor this market.
              • which will eventually increase the overall sales of rice cakes globally is the driving factor this market.
              • which in turn will drive the growth of the packaged rice snacks market in US during the forecast period. is the driving factor this market.

              The Packaged Rice Snacksin US market vendors should focus on grabbing business opportunities from the Offline segment as it accounted for the largest market share in the base year.