Packaged Rice Snacks Market Size 2026-2030
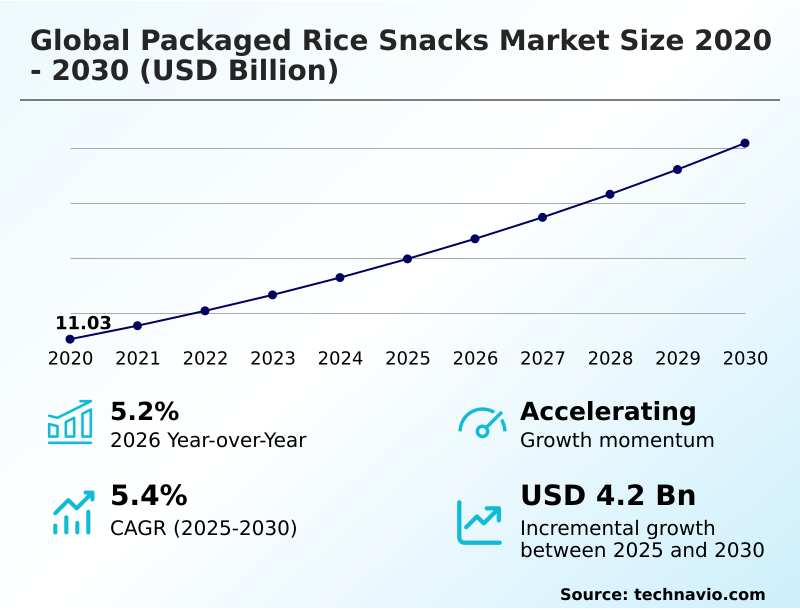
The packaged rice snacks market size is valued to increase by USD 4.20 billion, at a CAGR of 5.4% from 2025 to 2030. Prevalence of gluten sensitivity and celiac disease will drive the packaged rice snacks market.
Major Market Trends & Insights
- APAC dominated the market and accounted for a 45.5% growth during the forecast period.
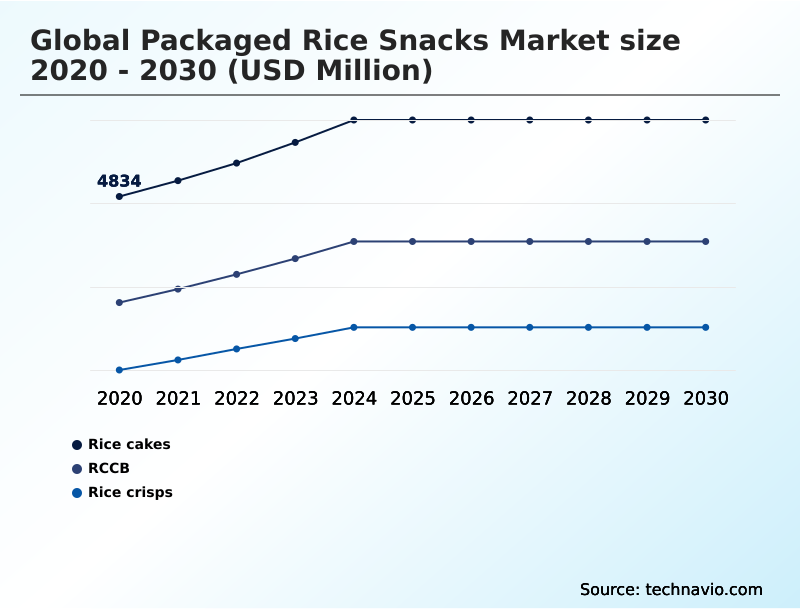
- By Product - Rice cakes segment was valued at USD 5.78 billion in 2024
- By Packaging - Pouches segment accounted for the largest market revenue share in 2024
Market Size & Forecast
- Market Opportunities: USD 7.12 billion
- Market Future Opportunities: USD 4.20 billion
- CAGR from 2025 to 2030 : 5.4%
Market Summary
- The packaged rice snacks market is shaped by a fundamental consumer shift towards healthier, convenience-oriented food choices. The demand for gluten-free, plant-based, and low-calorie options has moved products like rice crackers and puffed clusters from niche health food aisles into the mainstream snack category.
- This evolution is driven by increasing awareness of gluten intolerance and a broader perception of rice as a light and digestible ingredient. Modern urban lifestyles, characterized by on-the-go consumption, further catalyze demand for portable, portion-controlled formats that do not compromise nutritional value.
- For instance, a mid-sized manufacturer can leverage this trend by optimizing its supply chain for certified organic rice, enabling it to produce a premium, clean-label product line that commands a higher price point. Manufacturers are responding by diversifying portfolios with clean-label formulations, replacing artificial additives with natural seasonings and functional ingredients.
- The expansion of retail infrastructure and e-commerce has also improved product accessibility, allowing regional snack formats to gain global reach. Innovation in flavor, packaging, and supply chain resilience remains critical for navigating raw material cost fluctuations and environmental regulations.
What will be the Size of the Packaged Rice Snacks Market during the forecast period?
Get Key Insights on Market Forecast (PDF) Get Free Sample
How is the Packaged Rice Snacks Market Segmented?
The packaged rice snacks industry research report provides comprehensive data (region-wise segment analysis), with forecasts and estimates in "USD million" for the period 2026-2030, as well as historical data from 2020-2024 for the following segments.
- Product
- Rice cakes
- RCCB
- Rice crisps
- Packaging
- Pouches
- Bags
- Boxes
- Distribution channel
- Supermarkets or hypermarkets
- Convenience stores
- Online retail
- Specialty food stores
- Geography
- APAC
- China
- Japan
- India
- North America
- US
- Canada
- Mexico
- Europe
- Germany
- UK
- France
- South America
- Brazil
- Argentina
- Middle East and Africa
- Saudi Arabia
- UAE
- South Africa
- Rest of World (ROW)
- APAC
By Product Insights
The rice cakes segment is estimated to witness significant growth during the forecast period.
The rice cakes segment is defined by its core offering as a versatile, low-calorie, gluten-free bread alternative. Manufacturing relies on advanced air-popped manufacturing and extrusion process technologies to create a lightweight, neutral base for diverse flavor applications.
Market growth is supported by a consumer shift toward minimally processed foods, with an emphasis on ancient grain integration for enhanced nutritional value. Innovation in this space focuses on high-pressure processing to improve texture and shelf life.
Adherence to sustainability is driving a transition to paperboard packaging solutions, recyclable mono-materials, and compostable films, with some producers achieving a 15% reduction in packaging waste.
This focus on clean-label, artisanal quality snacks with transparent sourcing stories positions the segment for sustained relevance among health-conscious consumers.
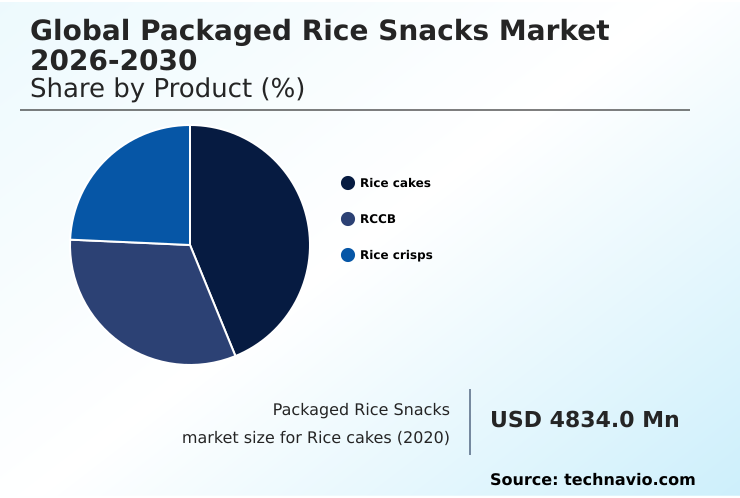
The Rice cakes segment was valued at USD 5.78 billion in 2024 and showed a gradual increase during the forecast period.
Regional Analysis
APAC is estimated to contribute 45.5% to the growth of the global market during the forecast period.Technavio’s analysts have elaborately explained the regional trends and drivers that shape the market during the forecast period.
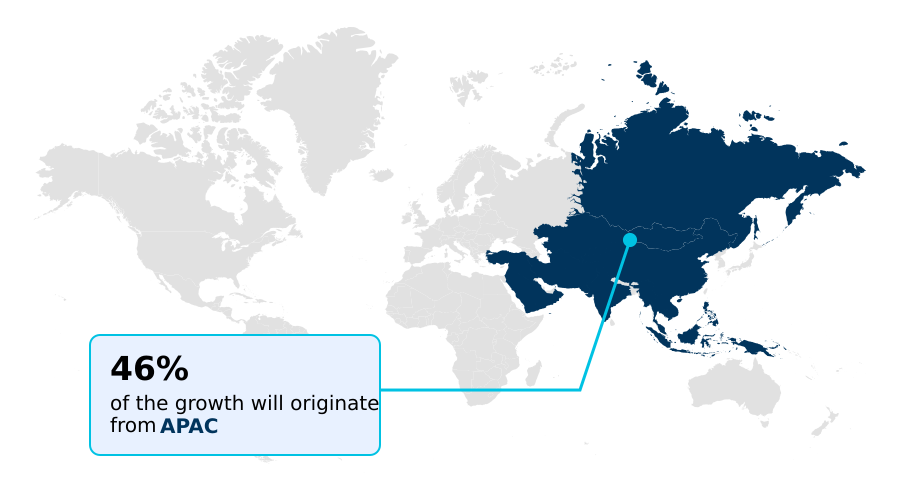
See How Packaged Rice Snacks Market Demand is Rising in APAC Get Free Sample
The geographic landscape is led by APAC, which serves as both the largest production and consumption hub, contributing over 45% of the market's incremental growth. This is driven by a long tradition of rice cultivation and the modernization of retail.
In this region, on-the-go consumption habits are fueling demand for products utilizing advanced baking technology and shelf-stable food processing.
In North America, a mature yet dynamic market, the focus is on health and wellness, with a strong consumer preference for non-GMO verification and premium snack category items.
Manufacturers here leverage nitrogen flushing technique and superior moisture barrier packaging to preserve freshness, which can extend product shelf-life by up to 25% compared to basic packaging.
The proliferation of convenience store inventory with nutrient-dense snacks and functional food ingredients further supports market expansion in developed regions.
Market Dynamics
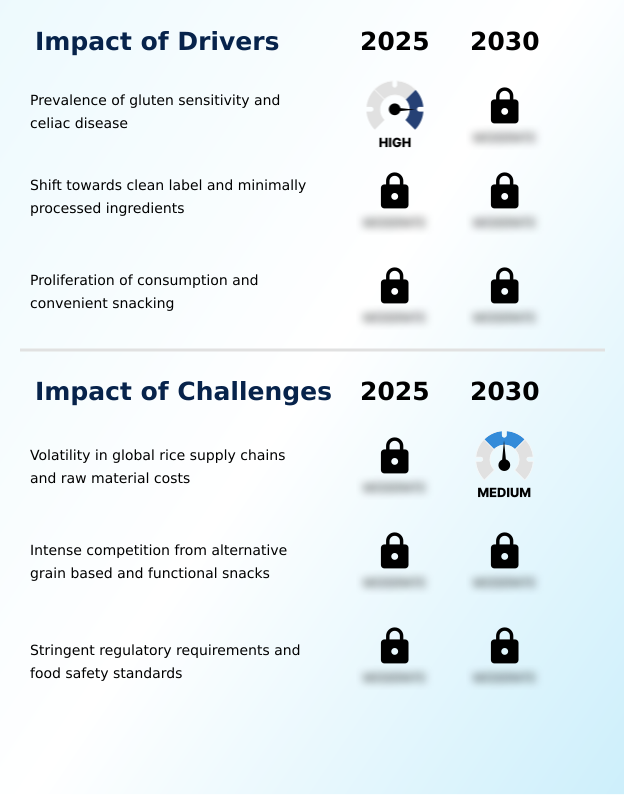
Our researchers analyzed the data with 2025 as the base year, along with the key drivers, trends, and challenges. A holistic analysis of drivers will help companies refine their marketing strategies to gain a competitive advantage.
- Strategic decision-making in the packaged rice snacks market increasingly revolves around navigating complex consumer preferences and production variables. Understanding the health benefits of baked vs fried rice snacks is crucial, as consumer demand for healthier options influences manufacturing choices and equipment investments. Concurrently, innovations in rice snack flavor fusion are key to differentiation, allowing brands to capture new demographics.
- The impact of packaging on rice snack freshness directly affects consumer satisfaction and repeat purchases, making material science a critical competitive battlefield. A clear understanding of how rice crisps and corn-based snacks nutrition compare allows for targeted marketing messages that highlight the advantages of rice-based products.
- Furthermore, the role of ancient grains in premium rice snacks is redefining the high-end market segment, offering enhanced nutritional profiles. However, addressing the challenges in sourcing organic rice for snacks remains a significant hurdle.
- Companies that implement transparent and resilient supply chains for organic materials can often secure more consistent pricing, sometimes improving margin stability by over 10% compared to those reliant on the volatile spot market.
What are the key market drivers leading to the rise in the adoption of Packaged Rice Snacks Industry?
- The growing prevalence of gluten sensitivity and celiac disease is a primary driver for the market, positioning rice-based snacks as safe and desirable dietary alternatives.
- The primary growth engine is the increasing consumer focus on health and wellness, which manifests in several ways. The demand for low-calorie food products and gluten-free certification has made rice snacks a staple in the healthy snacking landscape.
- This is amplified by concerns over diet-related health issues, leading consumers to seek out portion-controlled snack formats and meal replacement snacks. Manufacturers are responding with clean-label formulation, incorporating whole-grain brown rice and superfood fortification to boost nutritional content.
- The use of natural seasoning techniques aligns with the clean-label trend. The convenience factor is also paramount, with single-serve multipacks designed for on-the-go lifestyles driving sales.
- Furthermore, a shift toward plant-based snacking and the use of food-grade recycled plastics in packaging, reducing virgin plastic use by up to 30% in some cases, reinforces the market's alignment with modern consumer values.
What are the market trends shaping the Packaged Rice Snacks Industry?
- A key market trend is the proliferation of ethnic and global flavor fusions, which caters to an increasingly adventurous consumer base seeking novel sensory experiences.
- The market is experiencing a significant trend toward premiumization and flavor diversification. The proliferation of savory flavor profiles, including complex umami-rich ingredients, is moving products beyond their traditional health-food image into the indulgent snack experience category.
- This is supported by consumer-centric packaging, such as resealable pouch technology, which improves convenience and extends product freshness, leading to a reported 10% decrease in food waste at the household level. Innovations in rice flour milling allow for finer textures, enhancing the overall sensory experience.
- Simultaneously, sustainability is a major focus, with a shift toward mono-material structures and other sustainable packaging materials. This is driven by consumer demand and tightening regulations around extended producer responsibility, with sustainable options now making up over 25% of new product launches in some regions. This creates a better-for-you portfolio that also aligns with ecological values.
What challenges does the Packaged Rice Snacks Industry face during its growth?
- Volatility within global rice supply chains, which directly impacts raw material costs, presents a significant challenge to industry growth and pricing stability.
- Key challenges stem from operational complexities and a competitive market. Ensuring supply chain transparency and managing raw material procurement strategies are difficult due to climatic and geopolitical volatility, which can cause price fluctuations of over 20% in a single quarter. Adherence to stringent food safety standards, including inorganic arsenic limits and comprehensive allergen disclosure regulations, adds significant overhead.
- The rise of private-label alternatives in mass market consumption exerts constant pressure on pricing, forcing brands to differentiate. The market also faces competition from other savory snack options in both retail and foodservice markets. Navigating front-of-package labeling requirements while maintaining flavor and consumer appeal is a delicate balance.
- The mindful eating trend also means consumers are more selective, scrutinizing every aspect of a product from its sourcing to its alignment with circular economy principles.
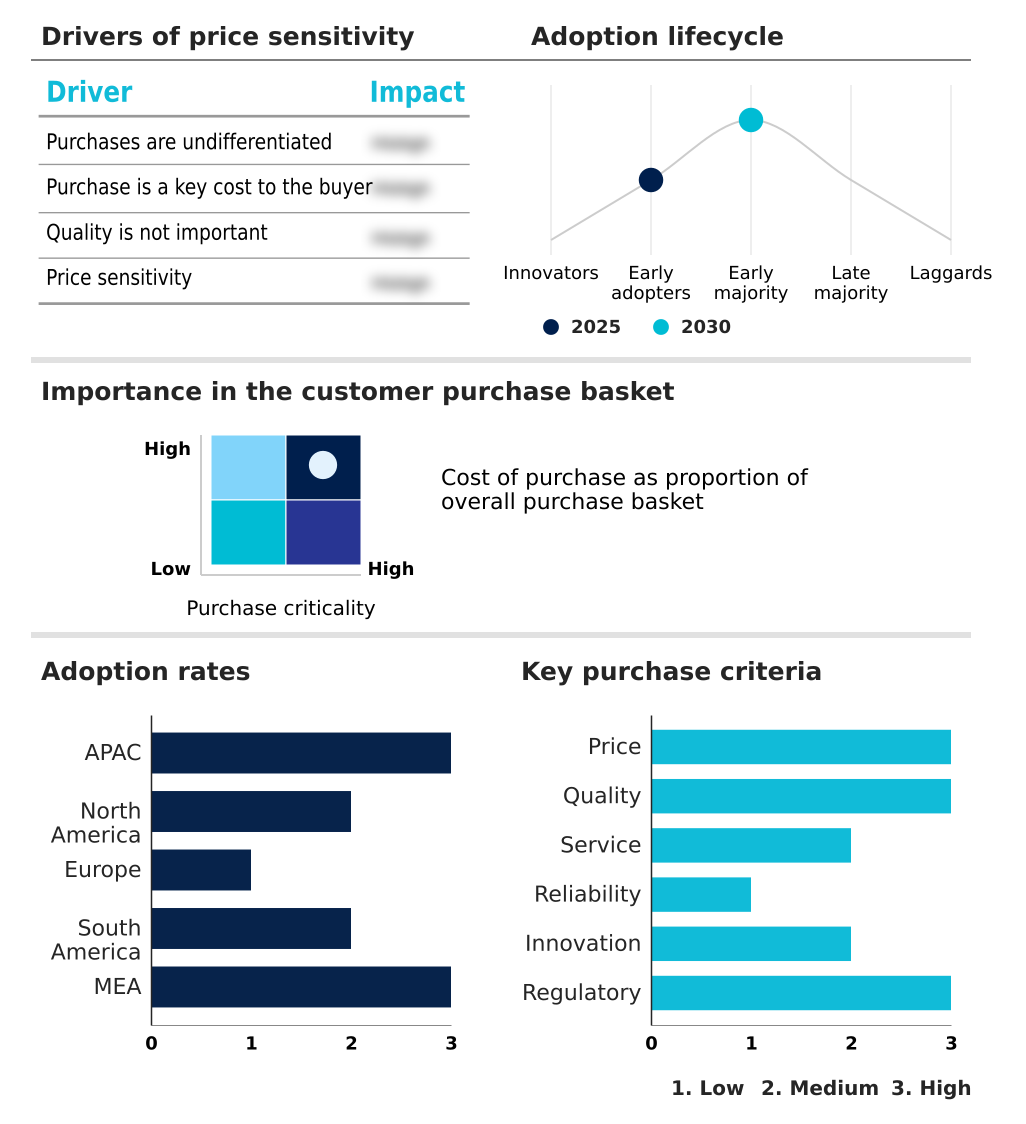
Exclusive Technavio Analysis on Customer Landscape
The packaged rice snacks market forecasting report includes the adoption lifecycle of the market, covering from the innovator’s stage to the laggard’s stage. It focuses on adoption rates in different regions based on penetration. Furthermore, the packaged rice snacks market report also includes key purchase criteria and drivers of price sensitivity to help companies evaluate and develop their market growth analysis strategies.
Customer Landscape of Packaged Rice Snacks Industry
Competitive Landscape
Companies are implementing various strategies, such as strategic alliances, packaged rice snacks market forecast, partnerships, mergers and acquisitions, geographical expansion, and product/service launches, to enhance their presence in the industry.
Annie Chuns Inc. - Offers a portfolio of rice-based chips and healthy seaweed snacks, reflecting consumer demand for convenient, Asian-inspired cuisine and flavors.
The industry research and growth report includes detailed analyses of the competitive landscape of the market and information about key companies, including:
- Annie Chuns Inc.
- Blue Diamond Growers
- Calbee Inc.
- Dang Foods Co.
- General Mills Inc.
- Hunter Foods LLC
- Kameda Seika Co. Ltd.
- Kellanova
- Lotte Corp.
- Lotus Foods Inc.
- Lundberg Family Farms
- Marys Gone Crackers
- Nongshim Co. Ltd.
- Panos Brands LLC
- PepsiCo Inc.
- Ricegrowers Ltd.
- Riceworks
- SanoRice
- The Campbell Co.
- Want Want China Holdings Ltd.
Qualitative and quantitative analysis of companies has been conducted to help clients understand the wider business environment as well as the strengths and weaknesses of key industry players. Data is qualitatively analyzed to categorize companies as pure play, category-focused, industry-focused, and diversified; it is quantitatively analyzed to categorize companies as dominant, leading, strong, tentative, and weak.
Recent Development and News in Packaged rice snacks market
- In May 2025, LT Foods entered a joint venture with Kameda Seika Co. Ltd. to strengthen its position in the roasted gluten-free snack segment.
- In May 2025, Graphic Packaging International announced the launch of a new portfolio of paperboard sushi packaging designed to help European foodservice operators comply with evolving packaging regulations.
- In April 2025, Rosseau Inc., a subsidiary of Dare Foods Ltd., acquired Mary Gone Crackers Inc., a US-based pioneer in organic and gluten-free snack products, to expand its product offerings and market reach.
- In March 2025, Kellanova announced the launch of its new Rice Krispies Treats Bliss snack bars, introducing a premium sweet-and-salty twist to the classic marshmallow treat.
Dive into Technavio’s robust research methodology, blending expert interviews, extensive data synthesis, and validated models for unparalleled Packaged Rice Snacks Market insights. See full methodology.
| Market Scope | |
|---|---|
| Page number | 301 |
| Base year | 2025 |
| Historic period | 2020-2024 |
| Forecast period | 2026-2030 |
| Growth momentum & CAGR | Accelerate at a CAGR of 5.4% |
| Market growth 2026-2030 | USD 4202.6 million |
| Market structure | Fragmented |
| YoY growth 2025-2026(%) | 5.2% |
| Key countries | China, Japan, India, South Korea, Australia, Indonesia, US, Canada, Mexico, Germany, UK, France, Italy, Spain, The Netherlands, Brazil, Argentina, Chile, Saudi Arabia, UAE, South Africa, Israel and Turkey |
| Competitive landscape | Leading Companies, Market Positioning of Companies, Competitive Strategies, and Industry Risks |
Research Analyst Overview
- The packaged rice snacks market is defined by its continuous adaptation to consumer health trends and technological advancements in food production. Key processes such as rice flour milling, extrusion process, and air-popped manufacturing are fundamental, but the competitive edge is found in the application of sophisticated baking technology and natural seasoning techniques.
- The integration of whole-grain brown rice and superfood fortification is becoming standard for premium offerings. In the boardroom, the push for sustainable packaging materials and recyclable mono-materials is a critical strategic decision, directly linked to brand perception and compliance with extended producer responsibility legislation.
- For example, firms adopting advanced paperboard packaging solutions have reported a 20% improvement in consumer engagement metrics related to sustainability. Navigating raw material procurement strategies for ingredients like umami-rich ingredients and ensuring supply chain transparency are central to mitigating price volatility and maintaining a consistent, high-quality output in a competitive global landscape.
What are the Key Data Covered in this Packaged Rice Snacks Market Research and Growth Report?
-
What is the expected growth of the Packaged Rice Snacks Market between 2026 and 2030?
-
USD 4.20 billion, at a CAGR of 5.4%
-
-
What segmentation does the market report cover?
-
The report is segmented by Product (Rice cakes, RCCB, and Rice crisps), Packaging (Pouches, Bags, and Boxes), Distribution Channel (Supermarkets or hypermarkets, Convenience stores, Online retail, and Specialty food stores) and Geography (APAC, North America, Europe, South America, Middle East and Africa)
-
-
Which regions are analyzed in the report?
-
APAC, North America, Europe, South America and Middle East and Africa
-
-
What are the key growth drivers and market challenges?
-
Prevalence of gluten sensitivity and celiac disease, Volatility in global rice supply chains and raw material costs
-
-
Who are the major players in the Packaged Rice Snacks Market?
-
Annie Chuns Inc., Blue Diamond Growers, Calbee Inc., Dang Foods Co., General Mills Inc., Hunter Foods LLC, Kameda Seika Co. Ltd., Kellanova, Lotte Corp., Lotus Foods Inc., Lundberg Family Farms, Marys Gone Crackers, Nongshim Co. Ltd., Panos Brands LLC, PepsiCo Inc., Ricegrowers Ltd., Riceworks, SanoRice, The Campbell Co. and Want Want China Holdings Ltd.
-
Market Research Insights
- The market's momentum is influenced by a convergence of consumer behaviors and operational imperatives. The rising demand for healthy snacking landscape options and plant-based snacking has created a robust foundation for growth. As diet-related health issues become more prominent, consumers are actively seeking functional food ingredients in portion-controlled snack formats.
- This shift has led to an increase in on-the-go consumption habits, with some convenience store inventories dedicating over 15% more shelf space to such products compared to three years ago. In response, manufacturers are focusing on a better-for-you portfolio, with product reformulations reducing sodium content by up to 20% to meet new front-of-package labeling guidelines.
- The rise of private-label alternatives also intensifies competition, compelling brand owners to innovate continuously to maintain market share.
We can help! Our analysts can customize this packaged rice snacks market research report to meet your requirements.
 RIA -
RIA - 
