Packaged Tacos Market Size 2024-2028
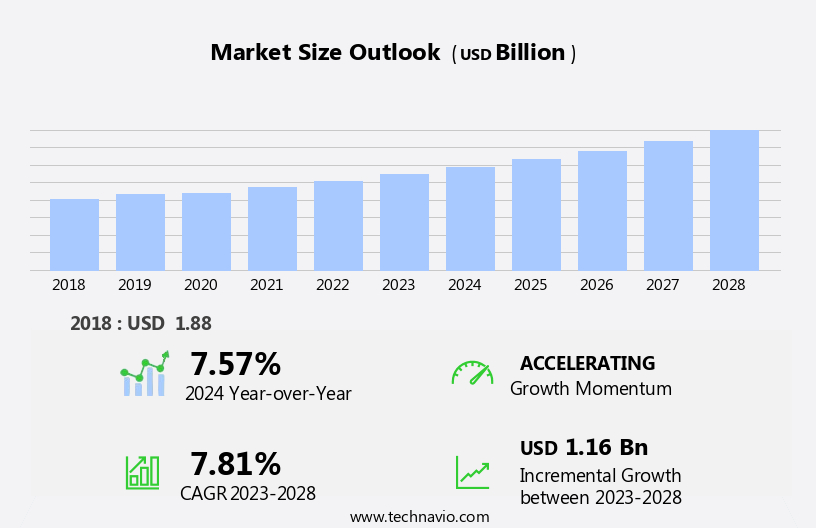
The packaged tacos market size is forecast to increase by USD 1.16 billion, at a CAGR of 7.81% between 2023 and 2028.
- The market is experiencing significant growth, driven by the increasing preference for convenience food products. Consumers' busy lifestyles and the desire for quick and easy meal solutions have led to a surge in demand for packaged tacos. This trend is further amplified by the growing popularity of food ordering through online portals and mobile apps, enabling customers to access their favorite taco brands with ease. However, the market faces challenges in distribution. Ensuring the freshness and quality of packaged tacos during transportation and storage remains a significant hurdle for market participants.
- This challenge is compounded by the perishable nature of some taco ingredients, necessitating careful handling and timely delivery to maintain product integrity. Companies must invest in robust supply chain management strategies and innovative packaging solutions to mitigate these challenges and meet consumer expectations for quality and convenience.
What will be the Size of the Packaged Tacos Market during the forecast period?
Explore in-depth regional segment analysis with market size data - historical 2018-2022 and forecasts 2024-2028 - in the full report.
Request Free Sample
The market continues to evolve, with dynamic market dynamics shaping its growth across various sectors. Product pricing strategies are continually adjusted to meet consumer demands and market conditions. Seasoning blend formulation is a critical area of innovation, with companies striving to differentiate their offerings and cater to diverse palates. Label compliance requirements are increasingly stringent, necessitating robust inventory management systems and automated packaging solutions. Filling ingredient optimization is a key focus, with companies leveraging data analysis to optimize ingredient sourcing and reduce costs. Automated packaging systems streamline production, ensuring consistency and efficiency. Quality control metrics are closely monitored, with thermal processing parameters and microbial contamination control being crucial areas of attention.
Texture modification techniques are being explored to enhance consumer experience, while nutritional content analysis and portion control strategies cater to health-conscious consumers. Sales data analysis and demand forecasting models inform marketing campaign effectiveness and brand positioning strategies. Waste reduction strategies and ingredient traceability systems are essential components of sustainable packaging and supply chain management. Consumer preference analysis informs product development and innovation, with companies continually seeking to meet evolving tastes and trends. Ingredient cost analysis and customer satisfaction metrics are critical indicators of market performance, driving continuous improvement and growth. Food safety protocols and product lifecycle management are essential components of a robust business strategy, ensuring regulatory compliance and maintaining brand reputation. Packaging material selection and production line efficiency are ongoing considerations, with companies balancing sustainability, cost, and functionality.
How is this Packaged Tacos Industry segmented?
The packaged tacos industry research report provides comprehensive data (region-wise segment analysis), with forecasts and estimates in "USD billion" for the period 2024-2028, as well as historical data from 2018-2022 for the following segments.
- Type
- Non-veg
- Veg
- Distribution Channel
- Offline
- Online
- Product Type
- Hard Shell Tacos
- Soft Shell Tacos
- Taco Kits
- Consumer Segment
- Household
- Commercial (Restaurants, Food Trucks)
- Geography
- North America
- US
- Canada
- Mexico
- Europe
- France
- Germany
- UK
- Middle East and Africa
- UAE
- APAC
- Indonesia
- Malaysia
- South Korea
- Thailand
- South America
- Brazil
- Rest of World (ROW)
- North America
By Type Insights
The non-veg segment is estimated to witness significant growth during the forecast period.
In the market, various factors drive the growth of non-vegetarian tacos. These tacos, featuring meat as a primary ingredient, offer a rich and diverse range of flavors. Common meat fillings include seasoned ground beef, shredded chicken, pork, and grilled steak. Toppings such as cheese, lettuce, tomatoes, salsa, and sour cream add to their allure. The convenience of ready-made taco kits and the availability of non-traditional fillings in restaurants have significantly contributed to the market's expansion. Supply chain management and distribution network efficiency ensure timely delivery of ingredients, maintaining product freshness. Energy consumption optimization in production processes reduces costs and minimizes environmental impact.
Quality control metrics and microbial contamination control ensure food safety, while thermal processing parameters preserve the texture and flavor of the tacos. Inventory management systems and portion control strategies help maintain consistency and reduce waste. Sales data analysis and demand forecasting models inform pricing strategies and brand positioning. Seasoning blend formulation and label compliance requirements cater to consumer preferences and regulatory requirements. Automated packaging systems and ingredient sourcing strategies ensure efficiency and cost savings. Consumer preference analysis and ingredient cost analysis inform product development and innovation. Food safety protocols, product lifecycle management, and packaging material selection maintain product quality and extend shelf life.
Production line efficiency and waste reduction strategies minimize operational costs and maximize productivity. Ingredient traceability systems provide transparency and build trust with customers. Marketing campaign effectiveness and customer satisfaction metrics are crucial in maintaining a strong market presence. Allergen management and nutritional content analysis cater to the diverse dietary needs of consumers. Brand positioning strategies and product pricing strategies ensure competitiveness in the market.
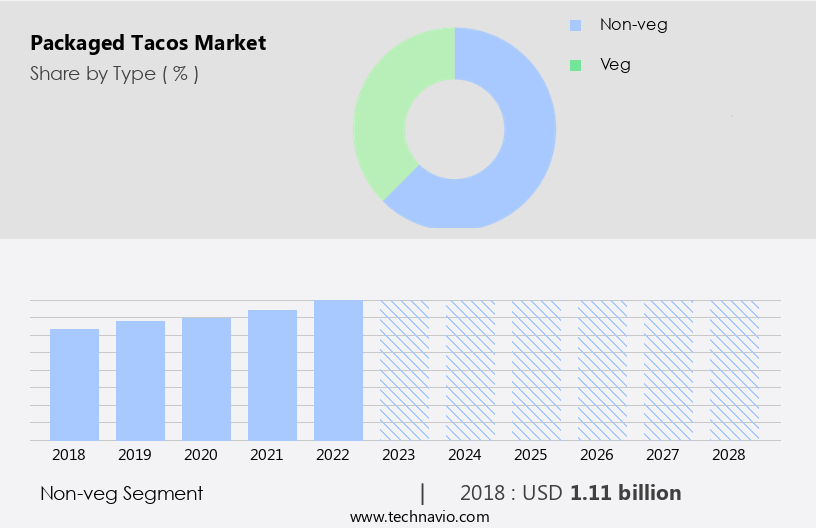
The Non-veg segment was valued at USD 1.11 billion in 2018 and showed a gradual increase during the forecast period.
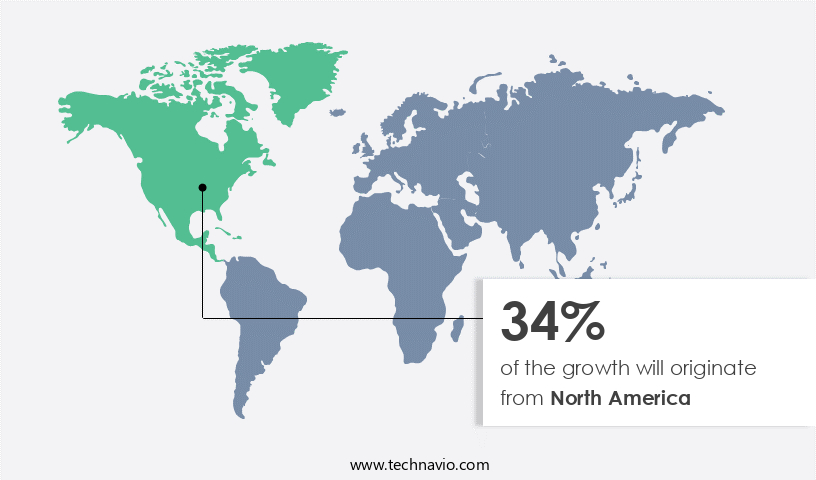
Regional Analysis
North America is estimated to contribute 34% to the growth of the global market during the forecast period.Technavio's analysts have elaborately explained the regional trends and drivers that shape the market during the forecast period.
The market in North America is experiencing consistent growth, driven by the increasing number of middle-class families and the convenience they offer to consumers with busy schedules. Packaged tacos have gained popularity as a quick meal solution, particularly in the US, where they are frequently consumed for breakfast. To meet the rising demand, retail chains are expanding their product offerings to include packaged tacos. Efficiency in various aspects of the value chain is crucial for market players. Energy consumption optimization and distribution network efficiency are key focus areas to reduce operational costs. Effective supply chain management and quality control metrics ensure consistent product quality.
Marketing campaign effectiveness is another critical factor, as companies invest in brand positioning strategies and consumer preference analysis to differentiate themselves. Tortilla production methods and texture modification techniques are essential for maintaining product appeal. Microbial contamination control and water usage reduction are essential for maintaining food safety and sustainability. Allergen management and thermal processing parameters are crucial for catering to diverse consumer needs. Nutritional content analysis, portion control strategies, and sales data analysis help companies optimize their product offerings and pricing strategies. Seasoning blend formulation and label compliance requirements are essential for product differentiation and regulatory compliance. Inventory management systems and filling ingredient optimization ensure efficient production and minimize waste.
Automated packaging systems and ingredient sourcing strategies streamline operations and reduce costs. Waste reduction strategies and ingredient traceability systems are essential for maintaining transparency and sustainability. Food safety protocols and product lifecycle management are crucial for maintaining brand reputation and consumer trust. Packaging material selection and production line efficiency are essential for cost-effective manufacturing and maintaining product quality. Overall, the market in North America is characterized by a focus on operational efficiency, product quality, and consumer preferences.
Market Dynamics
Our researchers analyzed the data with 2023 as the base year, along with the key drivers, trends, and challenges. A holistic analysis of drivers will help companies refine their marketing strategies to gain a competitive advantage.
The global packaged tacos market size and forecast projects growth, driven by packaged tacos market trends 2024-2028. B2B taco supply solutions leverage efficient taco production technologies for quality. Packaged tacos market growth opportunities 2025 include tacos for convenience stores and plant-based packaged tacos, meeting demand. Taco supply chain software optimizes operations, while packaged tacos market competitive analysis highlights key brands. Sustainable taco production practices align with eco-friendly food trends. Packaged tacos regulations 2024-2028 shapes taco demand in North America 2025. Healthy taco solutions and premium packaged taco insights boost adoption. Tacos for retail and customized taco packaging target niches. Packaged tacos market challenges and solutions address shelf life, with direct procurement strategies for tacos and taco pricing optimization enhancing profitability. Data-driven taco market analytics and vegan taco trends drive innovation.
What are the key market drivers leading to the rise in the adoption of Packaged Tacos Industry?
- The significant surge in consumer preference for convenient food solutions is the primary market catalyst, driving the demand for convenience food products.
- Packaged tacos have gained popularity due to the increasing urbanization and the rising number of working women worldwide. As of 2020, approximately 56.2% of the global population resided in urban areas, leading to an increase in disposable income and the demand for convenient, easy-to-prepare food options. The market caters to this trend, offering consumers a nutritious meal solution. The tortilla, a key component of tacos, is rich in complex carbohydrates, providing energy, while the meat or fish in the tacos offers protein. To cater to this growing demand, companies focus on energy consumption optimization, distribution network efficiency, and supply chain management.
- Quality control metrics are essential to ensure product consistency and customer satisfaction. Marketing campaign effectiveness is another crucial factor, with texture modification techniques and microbial contamination control playing significant roles in maintaining product quality. Tortilla production methods are continually evolving to meet consumer preferences and sustainability concerns. Overall, the market is a dynamic and evolving industry that prioritizes innovation, efficiency, and quality.
What are the market trends shaping the Packaged Tacos Industry?
- The increasing preference for ordering food online via portals and mobile applications represents a significant market trend. This digital shift in food ordering is becoming increasingly popular and mandatory for businesses aiming to stay competitive in today's market.
- In the market, businesses prioritize various strategies to meet consumer demands and enhance operational efficiency. One key area of focus is water usage reduction through optimized production processes. Another crucial aspect is allergen management to cater to diverse consumer needs. Thermal processing parameters are meticulously monitored to preserve the flavor profile and ensure food safety. To maintain nutritional content, nutritional analysis is conducted, and portion control strategies are implemented. Sales data analysis and demand forecasting models are employed to anticipate market trends and adjust production accordingly.
- Online platforms, including mobile apps, are utilized to streamline orders, providing a more efficient and consumer-friendly experience. Consumers leave valuable feedback on these platforms, which can be used to improve offerings and increase order values. By implementing these strategies, businesses in the market can stay competitive and cater to evolving consumer preferences.
What challenges does the Packaged Tacos Industry face during its growth?
- The packaged tacos industry faces significant distribution challenges, which represent a key impediment to market growth. Packaged tacos have gained significant popularity in retail stores, including supermarkets and large discount or convenience stores. However, this distribution channel poses challenges for manufacturers. They face pressure to maintain competitive product pricing strategies while ensuring profitability. Retailers demand frequent and smaller deliveries to minimize warehousing costs, which necessitates efficient inventory management systems. Additionally, retailers increasingly expect innovative merchandising units, such as movable shelves, to reduce store replenishment costs. To meet these demands, manufacturers must optimize filling ingredient formulations and sourcing strategies.
- Automated packaging systems streamline production and ensure label compliance requirements, ensuring a harmonious balance between efficiency and quality. Consumer preference analysis plays a crucial role in product development and pricing strategies, enabling manufacturers to cater to evolving market trends.
Exclusive Customer Landscape
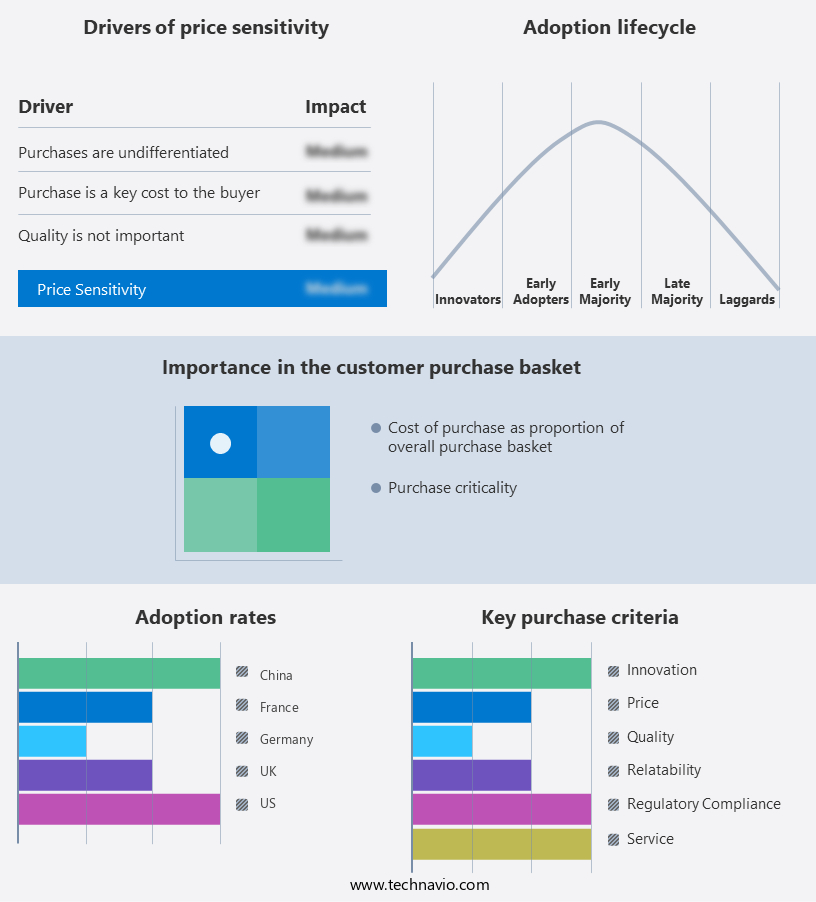
The packaged tacos market forecasting report includes the adoption lifecycle of the market, covering from the innovator's stage to the laggard's stage. It focuses on adoption rates in different regions based on penetration. Furthermore, the packaged tacos market report also includes key purchase criteria and drivers of price sensitivity to help companies evaluate and develop their market growth analysis strategies.
Customer Landscape
Key Companies & Market Insights
Companies are implementing various strategies, such as strategic alliances, packaged tacos market forecast, partnerships, mergers and acquisitions, geographical expansion, and product/service launches, to enhance their presence in the industry.
Ajinomoto Co. Inc. - This company specializes in producing a range of packaged tacos, including Queso chicken nacho, Loaded beef nacho, and Shredded chicken variants. Their offerings cater to diverse taste preferences, providing consumers with convenient, flavorful meal solutions.
The industry research and growth report includes detailed analyses of the competitive landscape of the market and information about key companies, including:
- Ajinomoto Co. Inc.
- B and G Foods Inc.
- General Mills Inc.
- Land O Lakes Inc.
- McCain Foods Ltd.
- McCormick and Co. Inc.
- The Hain Celestial Group Inc.
- Tyson Foods Inc.
- YUM Brands Inc.
Qualitative and quantitative analysis of companies has been conducted to help clients understand the wider business environment as well as the strengths and weaknesses of key industry players. Data is qualitatively analyzed to categorize companies as pure play, category-focused, industry-focused, and diversified; it is quantitatively analyzed to categorize companies as dominant, leading, strong, tentative, and weak.
Recent Development and News in Packaged Tacos Market
- In January 2024, Taco Bell, a leading fast-food chain, introduced its latest innovation to the market â the "Naked Crunch Tacos." These tacos, which come without a traditional shell, gained significant attention due to their unique selling proposition of offering a lower-carb option (Taco Bell press release).
- In March 2024, Tyson Foods, a major player in the meat industry, announced a strategic partnership with Greenleaf Foods S.E.C., a leading plant-based protein company. This collaboration aimed to explore opportunities in the plant-based packaged tacos segment, recognizing the growing consumer demand for sustainable and alternative protein options (Tyson Foods press release).
- In April 2025, General Mills, a leading food manufacturer, acquired a significant stake in Mission Foods, a prominent tortilla producer. This move strengthened General Mills' position in the market, enabling it to control the entire supply chain from tortilla production to the final packaged taco product (General Mills SEC filing).
- In May 2025, the U.S. Food and Drug Administration (FDA) approved a new preservative, natamycin, for use in soft tacos. This approval allowed manufacturers to extend the shelf life of packaged tacos, addressing a common challenge in the market and enhancing consumer convenience (FDA press release).
Research Analyst Overview
- The packaged taco market is characterized by a dynamic competitive landscape, with players continually seeking to optimize profit margins through value stream mapping and process improvement techniques such as six sigma methodology and lean manufacturing principles. Consumers' preferences for healthier options are driving trends towards sodium content reduction and fiber content enhancement, while vegan, vegetarian, and gluten-free filling choices expand the target market. Data analytics tools and business intelligence platforms enable brands to monitor key performance indicators, including brand awareness metrics and customer loyalty programs, to stay competitive.
- Sustainable packaging materials, such as compostable and recyclable options, are also gaining popularity as companies focus on reducing their environmental footprint and improving their return on investment. Sales promotion strategies, including social media marketing and predictive modeling, help brands reach consumers effectively and efficiently. Market share analysis and kaizen implementation are essential for continuous improvement and growth in this competitive industry.
Dive into Technavio's robust research methodology, blending expert interviews, extensive data synthesis, and validated models for unparalleled Packaged Tacos Market insights. See full methodology.
|
Market Scope |
|
|
Report Coverage |
Details |
|
Page number |
147 |
|
Base year |
2023 |
|
Historic period |
2018-2022 |
|
Forecast period |
2024-2028 |
|
Growth momentum & CAGR |
Accelerate at a CAGR of 7.81% |
|
Market growth 2024-2028 |
USD 1.16 billion |
|
Market structure |
Concentrated |
|
YoY growth 2023-2024(%) |
7.57 |
|
Key countries |
US, Malaysia, Indonesia, Germany, UK, South Korea, France, Canada, Brazil, Thailand, UAE, and Mexico |
|
Competitive landscape |
Leading Companies, Market Positioning of Companies, Competitive Strategies, and Industry Risks |
What are the Key Data Covered in this Packaged Tacos Market Research and Growth Report?
- CAGR of the Packaged Tacos industry during the forecast period
- Detailed information on factors that will drive the growth and forecasting between 2024 and 2028
- Precise estimation of the size of the market and its contribution of the industry in focus to the parent market
- Accurate predictions about upcoming growth and trends and changes in consumer behaviour
- Growth of the market across North America, Europe, APAC, South America, and Middle East and Africa
- Thorough analysis of the market's competitive landscape and detailed information about companies
- Comprehensive analysis of factors that will challenge the packaged tacos market growth of industry companies
We can help! Our analysts can customize this packaged tacos market research report to meet your requirements.
 RIA -
RIA - 
