Packaged Wastewater Treatment Market Size 2026-2030
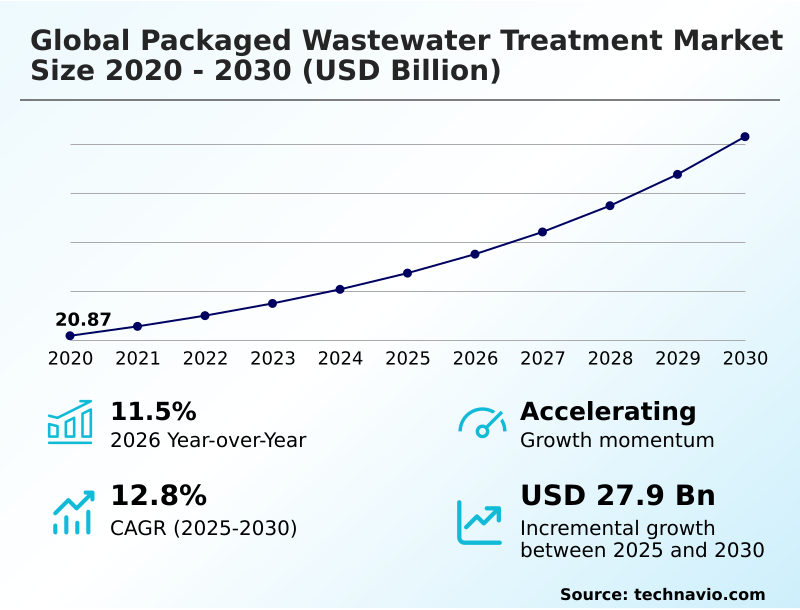
The packaged wastewater treatment market size is valued to increase by USD 27.90 billion, at a CAGR of 12.8% from 2025 to 2030. Increasing environmental regulations and discharge norms will drive the packaged wastewater treatment market.
Major Market Trends & Insights
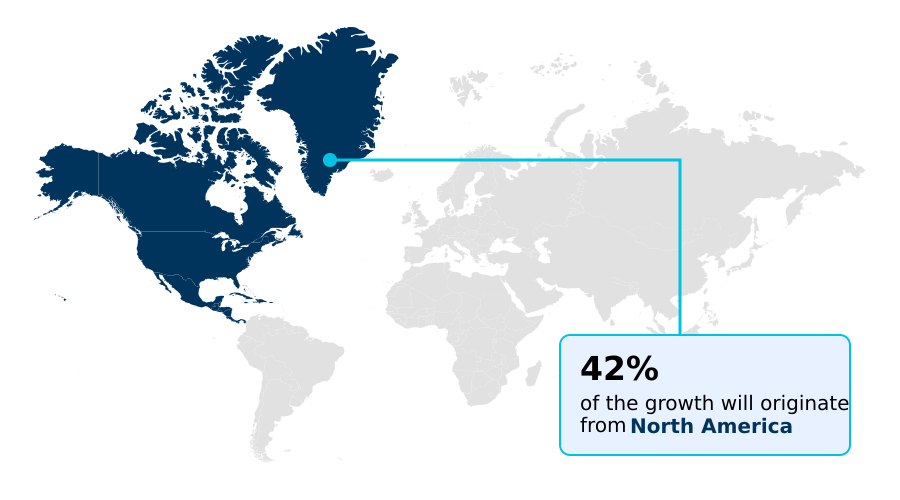
- North America dominated the market and accounted for a 41.6% growth during the forecast period.
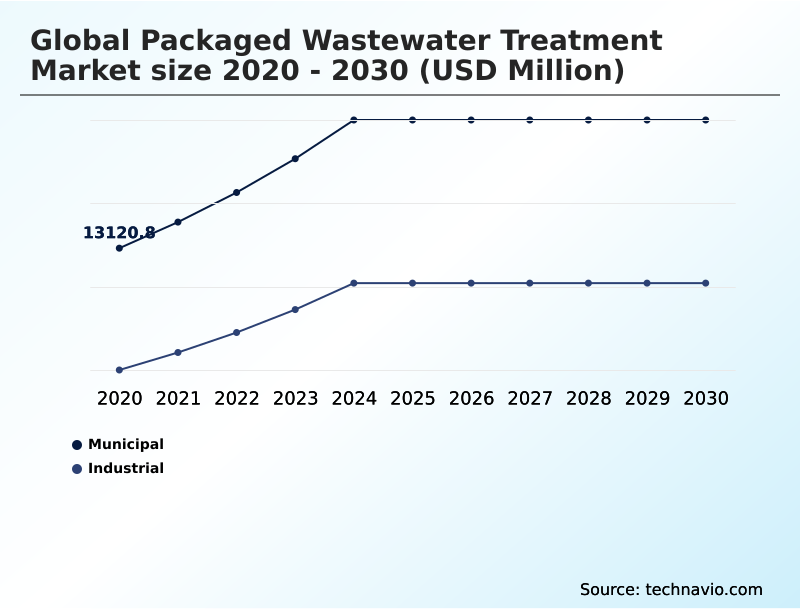
- By Application - Municipal segment was valued at USD 18.78 billion in 2024
- By Technology - Extended aeration segment accounted for the largest market revenue share in 2024
Market Size & Forecast
- Market Opportunities: USD 40.72 billion
- Market Future Opportunities: USD 27.90 billion
- CAGR from 2025 to 2030 : 12.8%
Market Summary
- The packaged wastewater treatment market is shaped by the pressing need for scalable infrastructure and decentralized management of water resources. Stringent environmental governance and the emphasis on water reuse and sustainability are compelling industries and municipalities to adopt more advanced solutions.
- A key trend is the integration of smart monitoring and automation, which enhances remote operability and supports predictive maintenance, reducing the reliance on constant onsite operational expertise.
- For instance, a remote mining operation can deploy a containerized system with MBR technology to treat process water, meeting strict effluent standards for discharge into a sensitive ecosystem while enabling over 80% water reuse. This not only ensures regulatory compliance but also significantly cuts freshwater transportation costs.
- However, the high capital investment for such advanced prefabricated modular systems and the shortage of skilled technicians in remote areas remain significant hurdles. The market is evolving with a focus on modular scalability and energy-efficient biological treatment processes to balance performance with economic viability, promoting sustainable wastewater management across diverse applications.
What will be the Size of the Packaged Wastewater Treatment Market during the forecast period?
Get Key Insights on Market Forecast (PDF) Get Free Sample
How is the Packaged Wastewater Treatment Market Segmented?
The packaged wastewater treatment industry research report provides comprehensive data (region-wise segment analysis), with forecasts and estimates in "USD million" for the period 2026-2030, as well as historical data from 2020-2024 for the following segments.
- Application
- Municipal
- Industrial
- Technology
- Extended aeration
- SBR technology
- MBBR technology
- MBR technology
- Capacity
- Large scale
- Medium scale
- Small scale
- Geography
- North America
- US
- Canada
- Mexico
- Europe
- Germany
- UK
- France
- APAC
- China
- Japan
- India
- South America
- Brazil
- Argentina
- Colombia
- Middle East and Africa
- Saudi Arabia
- UAE
- South Africa
- Rest of World (ROW)
- North America
By Application Insights
The municipal segment is estimated to witness significant growth during the forecast period.
The municipal segment is defined by the need for decentralized wastewater treatment to support urban and rural communities where centralized infrastructure is unfeasible. Demand is driven by population growth and stringent regulations governing effluent quality.
Prefabricated modular systems, incorporating technologies like advanced biological treatment and tertiary filtration, are critical for achieving regulatory compliance. These factory-assembled systems offer rapid deployment and operational reliability for managing domestic sewage.
North America commands over 41% of the market's incremental growth opportunity, underscoring the region's focus on decentralized sanitation and upgrading aging infrastructure with solutions that ensure high effluent quality.
This includes adopting biological treatment processes and skid-mounted systems for effective wastewater management and achieving superior nutrient removal and solids handling.
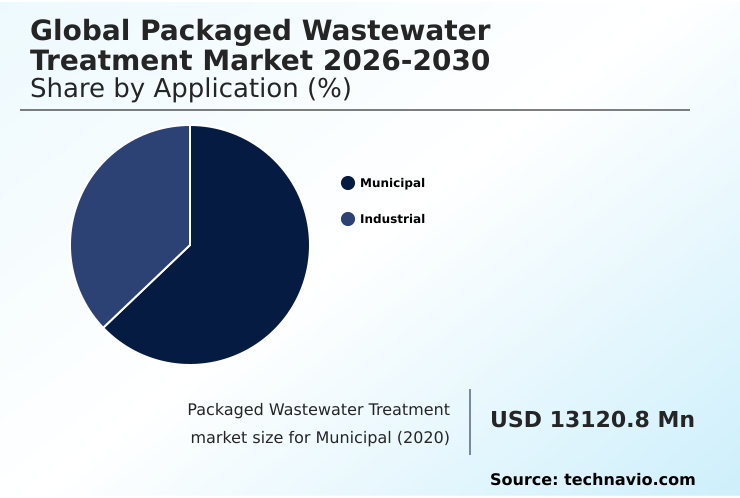
The Municipal segment was valued at USD 18.78 billion in 2024 and showed a gradual increase during the forecast period.
Regional Analysis
North America is estimated to contribute 41.6% to the growth of the global market during the forecast period.Technavio’s analysts have elaborately explained the regional trends and drivers that shape the market during the forecast period.
See How Packaged Wastewater Treatment Market Demand is Rising in North America Get Free Sample
The geographic landscape of the market is diversifying, with significant activity across both mature and emerging regions.
North America is projected to contribute nearly 42% of the market's incremental growth, driven by stringent regulatory demands and the need to upgrade aging infrastructure with decentralized management solutions.
The region's focus is on achieving superior effluent quality and water security.
In parallel, APAC is set to expand at a rate approximately 1.4 percentage points higher than Europe, fueled by rapid urbanization and industrialization that necessitate scalable infrastructure and fast deployable treatment options.
Key technologies like MBBR technology and MBR technology are being adopted globally to support water reuse and sustainability initiatives.
These factory-assembled systems, which incorporate advanced oxidation and microfiltration, are essential for meeting varying regulatory compliance standards and promoting environmental governance worldwide.
Market Dynamics
Our researchers analyzed the data with 2025 as the base year, along with the key drivers, trends, and challenges. A holistic analysis of drivers will help companies refine their marketing strategies to gain a competitive advantage.
- Strategic decision-making in the global packaged wastewater treatment market 2026-2030 requires a deep understanding of the long-term implications of technology choices and operational models. Evaluating the lifecycle cost of modular plants is crucial, as is understanding the benefits of modular wastewater design, which can reduce project deployment timelines by up to 60% compared to traditional construction methods.
- A detailed MBR versus SBR technology comparison reveals differences in footprint efficiency and sludge management in compact systems. While MBR offers superior effluent quality ideal for water reuse from packaged systems, SBR provides robust performance for managing high strength industrial wastewater.
- The cost of packaged wastewater treatment systems remains a primary consideration, but the focus is shifting toward total cost of ownership, which includes operational challenges in remote treatment and the energy efficiency in wastewater treatment. Packaged systems for industrial wastewater increasingly feature smart automation for treatment plants to ensure compliance with stringent effluent standards.
- For expanding municipalities, decentralized treatment for rural communities and upgrading lagoons with packaged technology are viable strategies. Prefabricated systems for real estate and those enabling rapid deployment for disaster relief highlight the market's versatility.
- Ultimately, selecting the right packaged system technology depends on balancing initial investment with long-term performance, whether for achieving nutrient removal in decentralized systems or advancing zero liquid discharge implementation strategies.
What are the key market drivers leading to the rise in the adoption of Packaged Wastewater Treatment Industry?
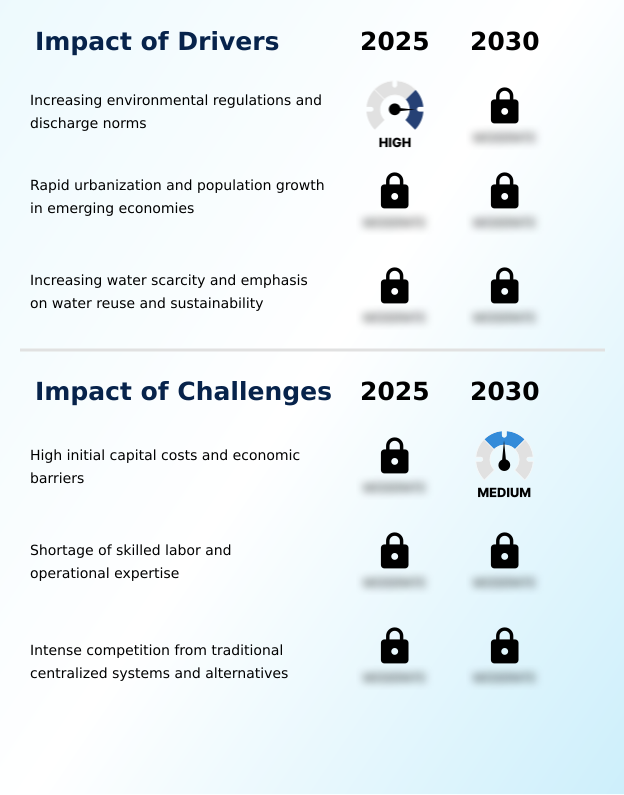
- Increasingly stringent environmental regulations and discharge norms are a key driver for the market's growth.
- Market growth is primarily propelled by stringent environmental governance and the urgent need for fast deployable treatment solutions in rapidly urbanizing areas.
- Increasingly strict regulatory demands for higher effluent quality and nutrient capture are compelling industries and municipalities to invest in advanced wastewater management.
- In response, decentralized systems are being deployed up to 75% faster than large-scale centralized projects, providing crucial urban resilience.
- The focus on water reuse and sustainability is another significant driver, with onsite treatment and recycling systems enabling industrial facilities to achieve up to 80% water reuse, thereby reducing reliance on fresh sources and minimizing their environmental footprint.
- This shift toward circular economy principles is supported by scalable infrastructure that ensures regulatory compliance and promotes long-term water security in water-stressed regions.
What are the market trends shaping the Packaged Wastewater Treatment Industry?
- The increasing adoption of energy-efficient technologies, such as the membrane aerated biofilm reactor, is an upcoming trend in the market. This shift reflects a growing emphasis on reducing operational costs and enhancing nutrient removal in compact modular formats.
- Key market trends are centered on optimizing operational efficiency and sustainability through technological innovation. The adoption of smart monitoring and automation is pivotal, with systems featuring advanced process control reducing the need for manual intervention by over 50%. This enhances remote operability, a crucial advantage for decentralized management.
- Furthermore, energy-efficient technologies like membrane aerated biofilm reactor (MABR) are gaining traction, capable of lowering aeration energy consumption by over 70% compared to conventional activated sludge systems. This focus on lowering the environmental footprint is complemented by the rising use of containerized systems and prefabricated modular systems, which enable rapid deployment and modular scalability.
- Such plug-and-play approaches, incorporating biofilm media and tertiary filtration, are instrumental in achieving high effluent standards and supporting water reuse and sustainability goals across various applications.
What challenges does the Packaged Wastewater Treatment Industry face during its growth?
- High initial capital costs and economic barriers represent a key challenge affecting industry growth.
- The primary market challenges revolve around economic and operational hurdles that can impede widespread adoption. High initial capital investment for advanced systems can be 30-50% greater than simpler, traditional alternatives, creating a significant barrier for smaller municipalities and industries with limited budgets. This is compounded by a persistent shortage of skilled operational expertise in many regions.
- The lack of qualified technicians for maintenance and troubleshooting can increase long-term operational costs by up to 25% due to improper system handling and unplanned downtime. This highlights the critical need for a robust technical support infrastructure.
- These factors create intense competition, forcing providers to balance innovation with affordability to expand market access and ensure the long-term lifecycle performance and operational reliability of their solutions.
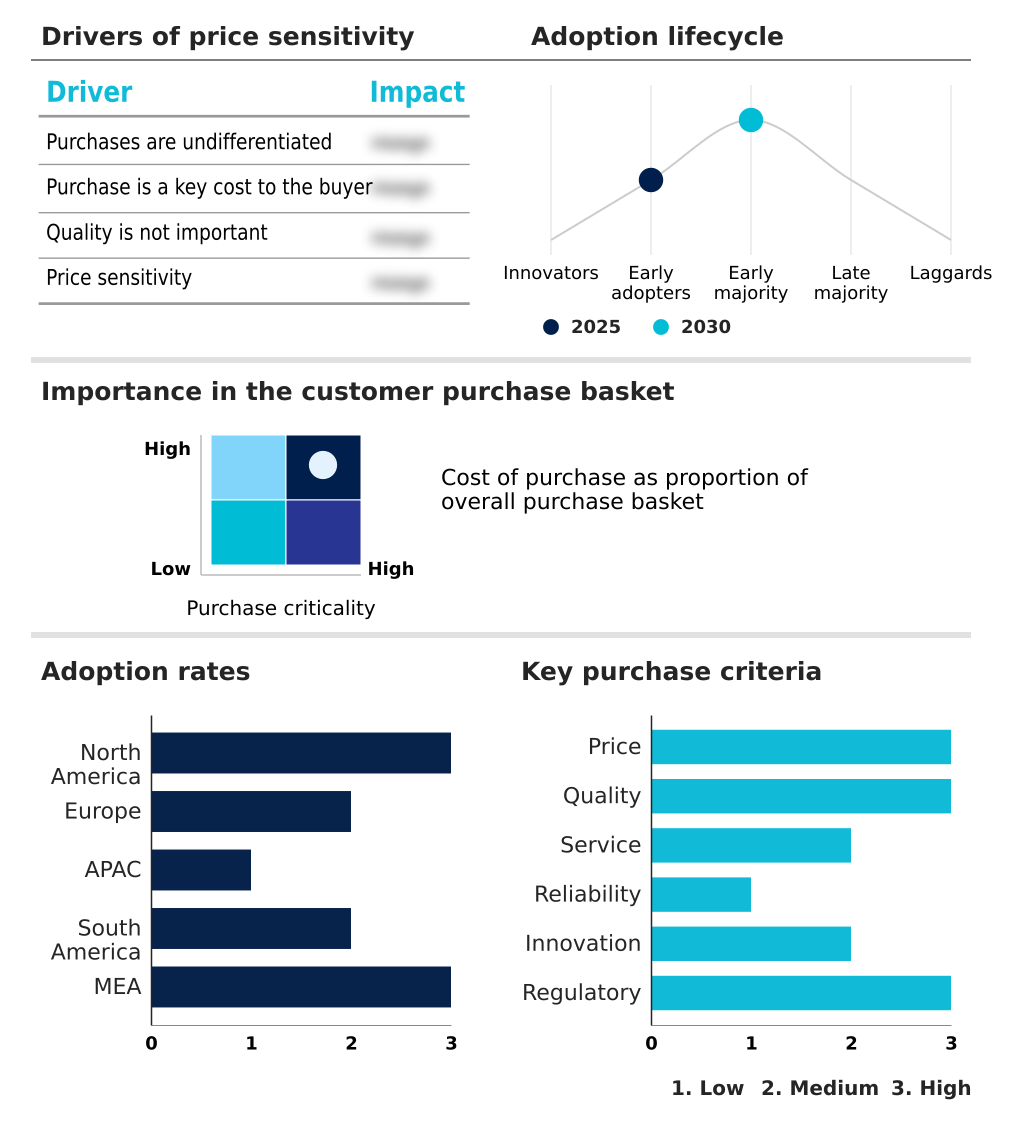
Exclusive Technavio Analysis on Customer Landscape
The packaged wastewater treatment market forecasting report includes the adoption lifecycle of the market, covering from the innovator’s stage to the laggard’s stage. It focuses on adoption rates in different regions based on penetration. Furthermore, the packaged wastewater treatment market report also includes key purchase criteria and drivers of price sensitivity to help companies evaluate and develop their market growth analysis strategies.
Customer Landscape of Packaged Wastewater Treatment Industry
Competitive Landscape
Companies are implementing various strategies, such as strategic alliances, packaged wastewater treatment market forecast, partnerships, mergers and acquisitions, geographical expansion, and product/service launches, to enhance their presence in the industry.
Aguapuro Equipments Pvt. Ltd. - Offers modular and containerized wastewater solutions, utilizing advanced membrane-based biological processes designed for decentralized and industrial applications within comprehensive design-build-operate frameworks.
The industry research and growth report includes detailed analyses of the competitive landscape of the market and information about key companies, including:
- Aguapuro Equipments Pvt. Ltd.
- Arvind Envisol Ltd.
- BioKube
- BioMicrobics Inc.
- Chokhavatia Associates
- CleanTech Water
- Clearford Water System Inc.
- Corix Group of Companies
- Daiki Axis Co. Ltd.
- DAS Environmental Expert USA Inc
- Fluence Corp. Ltd.
- Organica Water Inc.
- Ovivo Inc.
- Pentair Plc
- Pollution Control Systems Inc.
- Smith and Loveless Inc.
- SUEZ SA
- Veolia Environment SA
- WesTech Engineering LLC
- Xylem Inc.
Qualitative and quantitative analysis of companies has been conducted to help clients understand the wider business environment as well as the strengths and weaknesses of key industry players. Data is qualitatively analyzed to categorize companies as pure play, category-focused, industry-focused, and diversified; it is quantitatively analyzed to categorize companies as dominant, leading, strong, tentative, and weak.
Recent Development and News in Packaged wastewater treatment market
- In August 2024, The City of Chiloquin in Oregon approved financial assistance for its Wastewater Treatment Facility Project, initiating the replacement of its existing contact stabilization package treatment plant with an updated lagoon-based infrastructure to serve municipal needs.
- In October 2024, Xylem Inc. advanced its smart water capabilities through strategic acquisitions focused on digital analytics, which enables better optimization of packaged wastewater treatment operations globally.
- In January 2025, Axius Water acquired Aero Mod, a specialist in mechanical and biological wastewater treatment systems, to strengthen its packaged nutrient removal capabilities for both municipal and industrial applications.
- In March 2025, Fluence Corporation secured multiple contracts for its Aspiral Flex containerized wastewater treatment plants in the United States, with installations supporting recycled water regulations for housing developments and agricultural reuse.
Dive into Technavio’s robust research methodology, blending expert interviews, extensive data synthesis, and validated models for unparalleled Packaged Wastewater Treatment Market insights. See full methodology.
| Market Scope | |
|---|---|
| Page number | 293 |
| Base year | 2025 |
| Historic period | 2020-2024 |
| Forecast period | 2026-2030 |
| Growth momentum & CAGR | Accelerate at a CAGR of 12.8% |
| Market growth 2026-2030 | USD 27903.2 million |
| Market structure | Fragmented |
| YoY growth 2025-2026(%) | 11.5% |
| Key countries | US, Canada, Mexico, Germany, UK, France, Italy, Spain, The Netherlands, China, Japan, India, South Korea, Australia, Indonesia, Brazil, Argentina, Colombia, Saudi Arabia, UAE, South Africa, Israel and Turkey |
| Competitive landscape | Leading Companies, Market Positioning of Companies, Competitive Strategies, and Industry Risks |
Research Analyst Overview
- The packaged wastewater treatment market is evolving beyond conventional compliance-driven sales toward integrated, performance-based solutions. A core market dynamic is the adoption of prefabricated modular systems that offer unparalleled scalability and rapid deployment. For boardroom-level strategic planning, this shifts the capital expenditure conversation from large, one-time investments to phased, budget-aligned expansions.
- Scalable modular systems can offer a 10-fold expansion capacity, allowing a facility to grow from treating 150,000 to 1.5 million gallons per day without complete system replacement, fundamentally altering long-term financial and operational planning. Technologies such as MBR technology, SBR technology, and the membrane aerated biofilm reactor are central to this shift.
- These advanced biological treatment methods are integrated into containerized systems and skid-mounted systems that feature plug-and-play approaches. This ensures high effluent quality and effective nutrient removal. The emphasis is on delivering factory-assembled systems that provide reliable decentralized wastewater treatment, complete with tertiary polishing, robust solids handling, and options for process water recycling to support zero liquid discharge goals.
- This move towards decentralized sanitation is reshaping how industries approach both compliance and resource recovery.
What are the Key Data Covered in this Packaged Wastewater Treatment Market Research and Growth Report?
-
What is the expected growth of the Packaged Wastewater Treatment Market between 2026 and 2030?
-
USD 27.90 billion, at a CAGR of 12.8%
-
-
What segmentation does the market report cover?
-
The report is segmented by Application (Municipal, and Industrial), Technology (Extended aeration, SBR technology, MBBR technology, and MBR technology), Capacity (Large scale, Medium scale, and Small scale) and Geography (North America, Europe, APAC, South America, Middle East and Africa)
-
-
Which regions are analyzed in the report?
-
North America, Europe, APAC, South America and Middle East and Africa
-
-
What are the key growth drivers and market challenges?
-
Increasing environmental regulations and discharge norms, High initial capital costs and economic barriers
-
-
Who are the major players in the Packaged Wastewater Treatment Market?
-
Aguapuro Equipments Pvt. Ltd., Arvind Envisol Ltd., BioKube, BioMicrobics Inc., Chokhavatia Associates, CleanTech Water, Clearford Water System Inc., Corix Group of Companies, Daiki Axis Co. Ltd., DAS Environmental Expert USA Inc, Fluence Corp. Ltd., Organica Water Inc., Ovivo Inc., Pentair Plc, Pollution Control Systems Inc., Smith and Loveless Inc., SUEZ SA, Veolia Environment SA, WesTech Engineering LLC and Xylem Inc.
-
Market Research Insights
- The packaged wastewater treatment market is characterized by a shift toward scalable infrastructure and decentralized management to achieve greater urban resilience. Innovations in performance-based service models and rapid deployment capabilities are reshaping wastewater management strategies. Industrial facilities adopting advanced systems report up to 80% water reuse, directly impacting their environmental footprint and operational costs.
- The integration of smart monitoring for process control and remote monitoring reduces the need for constant onsite operational expertise by over 50%, a critical factor for remote installations. This emphasis on lifecycle performance and operational reliability reflects a move away from focusing solely on initial capital investment.
- As regulatory demands for higher effluent standards and resource recovery intensify, the market continues to evolve, prioritizing technical support infrastructure and sustainable circular economy principles.
We can help! Our analysts can customize this packaged wastewater treatment market research report to meet your requirements.
 RIA -
RIA - 
